
Last analysis of gold expected an end to a fourth wave correction to be followed by a sharp upwards thrust to about 1,399.73. This is what happened.
The question now is, is this intermediate degree correction over? Have we just seen a trend change back to the downside for gold?
Click on the charts below to enlarge.
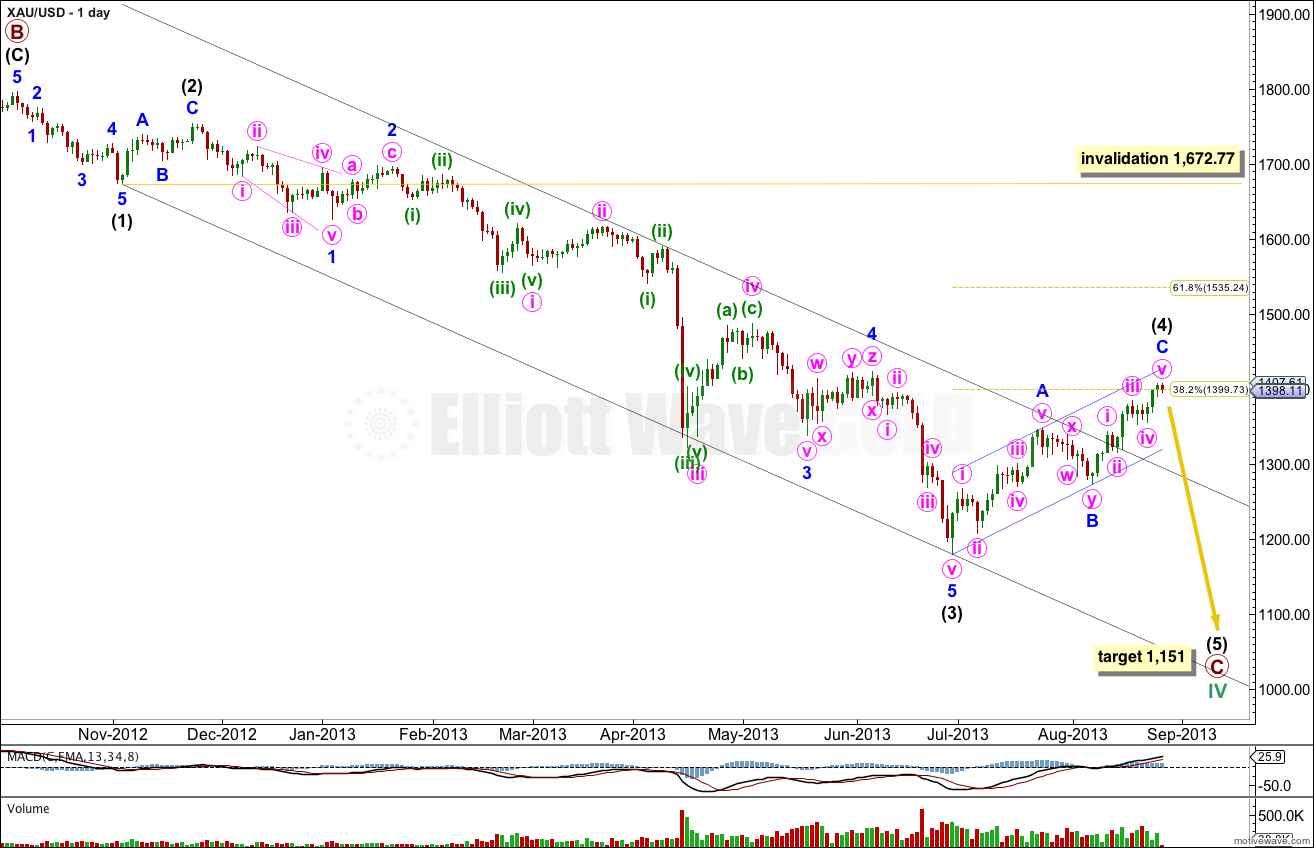
This daily chart focuses on the new downwards trend of primary wave C within a cycle degree wave IV.
Within primary wave C intermediate waves (1) through to (3) are complete.
Intermediate wave (4) so far has lasted eight weeks and may now be almost complete. Intermediate wave (2) lasted three weeks and was a deep 66% zigzag.
When the structure on the hourly chart is complete then we need to look for confirmation that intermediate wave (4) is over. If this current daily candlestick closes down, is red, that shall be a strong indicator of a trend change.
When we have confirmation on the hourly chart that we have seen a trend change then I will add to the target calculation for primary wave C at intermediate wave degree. I may be able to do this for you tomorrow.
At 1,151 primary wave C would reach 1.618 the length of primary wave A.
Within primary wave C intermediate wave (4) may not move into intermediate wave (1) price territory. This wave count is invalidated with movement above 1,672.77.
Main Hourly Wave Count.
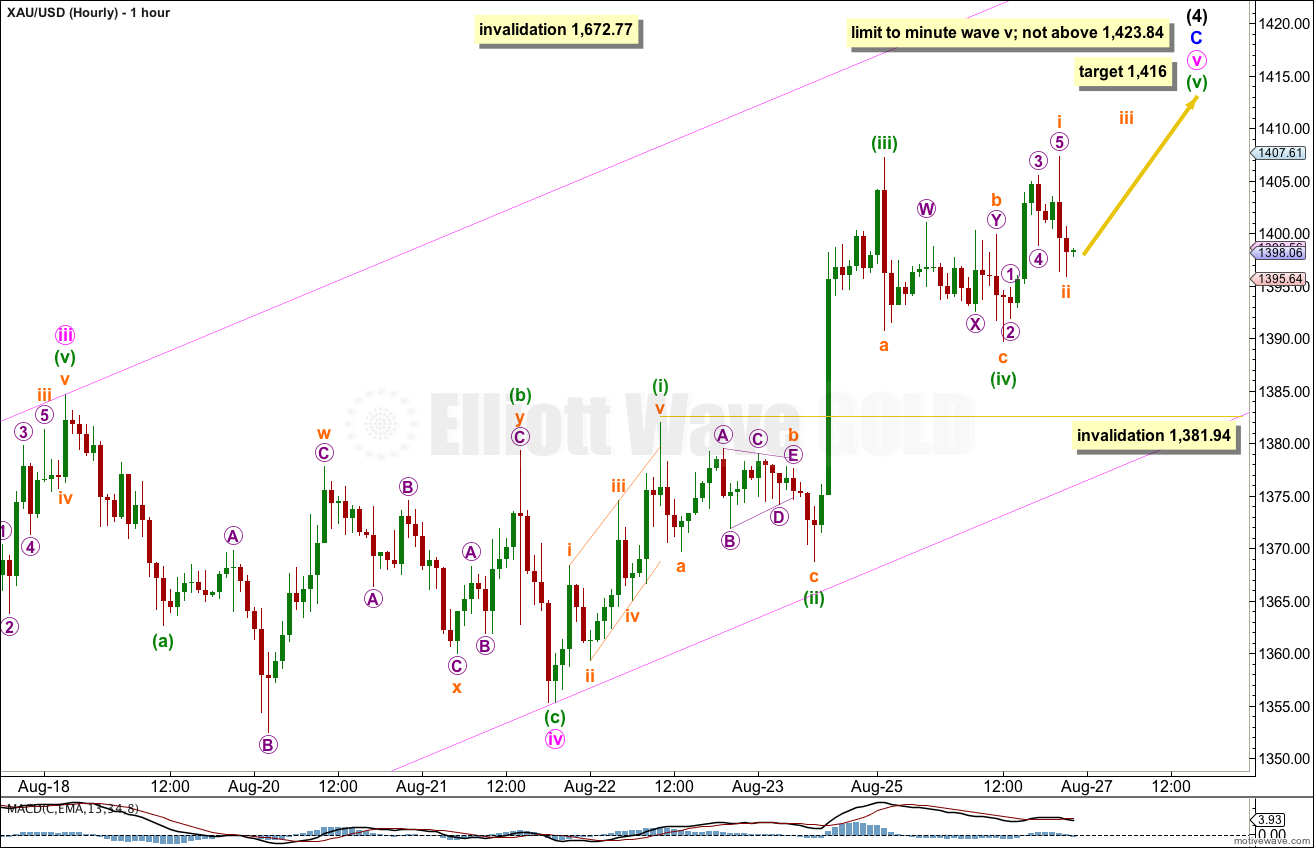
This hourly chart a good overall look because within minute wave v minuette waves (ii) and (iv) are nicely in proportion.
Draw a parallel channel about minor wave C using Elliott’s second technique. Draw the first trend line from the low of minute wave ii (you can see this on the daily chart) to minute wave iv, then place a parallel copy upon the high of minute wave iii. Expect minute wave v to end mid way within this channel. When this channel is breached by downwards movement we shall have trend channel confirmation that minor wave C is over, and intermediate wave (4) is extremely likely to be over.
Minute wave iv ended as a zigzag with a slightly truncated C wave, not as a triangle. Within the zigzag subminuette wave b was a time consuming double combination.
Minute wave iii is slightly shorter than minute wave i. This limits minute wave v to no longer than equality with minute wave iii at 1,423.84.
At 1,416 minuette wave (v) would reach equality in length with minuette wave (i).
If minuette wave (iv) is not over and continues further sideways then it may not move into minuette wave (i) price territory. This hourly wave count is invalidated with movement below 1,381.94.
Alternate Wave Count.
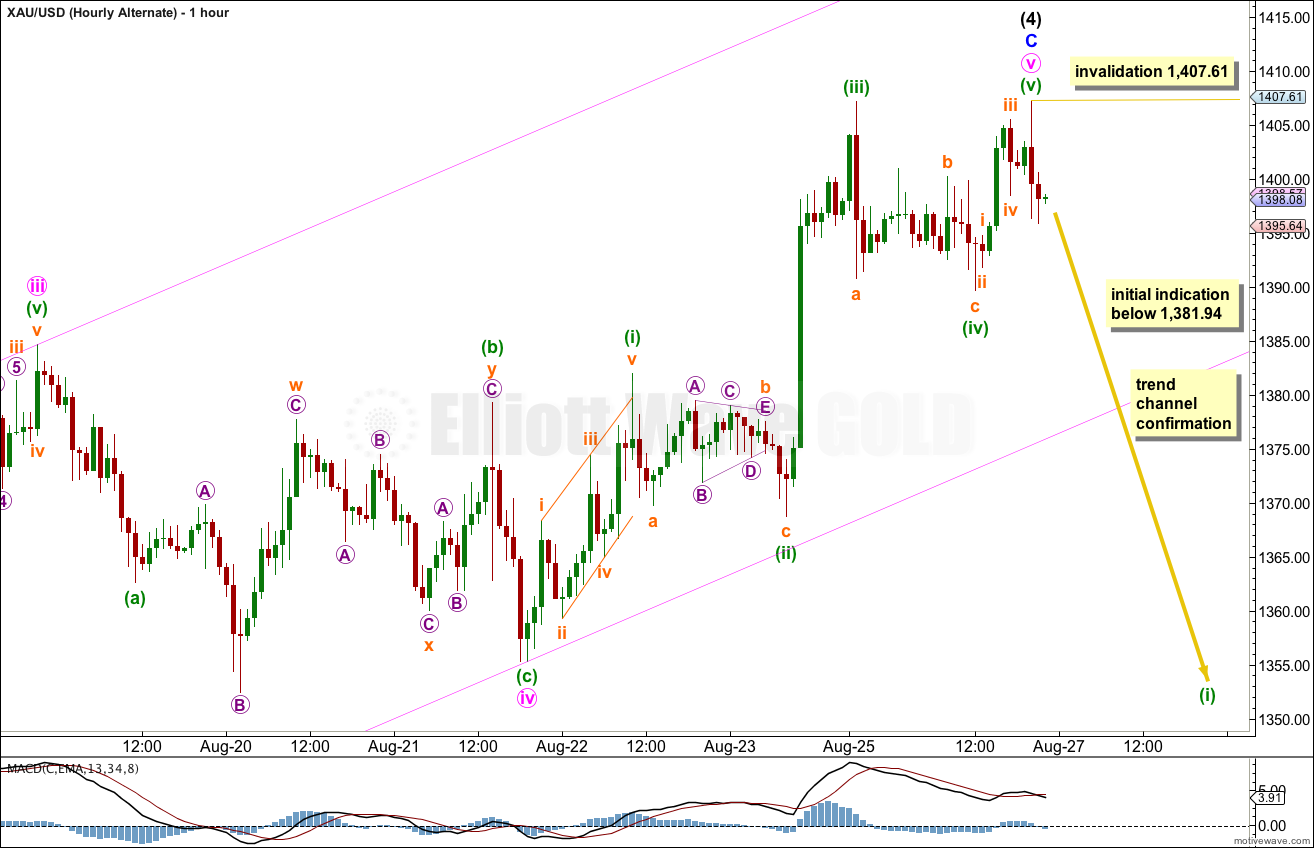
It is possible to see a completed five wave impulse for minute wave v. We may have just seen a trend change at intermediate wave degree.
There is no Fibonacci ratio between minor waves A and C.
Ratios within minor wave C are: minute wave iii is 2.62 short of equality with minute wave i, and minute wave v has no Fibonacci ratio to either of minute waves i or iii.
Ratios within minute wave v are: minuette wave (iii) has no Fibonacci ratio to minuette wave (i), and minuette wave (v) is 1.23 short of 0.618 the length of minuette wave (iii).
We need to see confirmation of this trend change before having confidence in it.
Firstly, movement below 1,381.94 would provide initial indication this wave count may be correct.
Second, movement below the parallel channel here on the hourly chart would provide trend channel confirmation that minor wave C is over and the next wave is underway.
Third, movement below the parallel channel on the daily chart would provide channel confirmation that the zigzag of intermediate wave (4) should be over.
Finally, price movement below 1,348.27 would provide confirmation that the upwards movement labeled intermediate wave (4) is a three wave structure and is corrective, because at that stage downwards movement may not be a fourth wave correction within an unfolding impulse upwards.
hi Lara
İt seems 3 th wave of last impulse is 1323.
I’m sorry, your comment does not make sense.
Sorry i wrote it wrong. İt s 1423. It was my guess 3 th wave you called it 5 th wave is 1423. Because i thought 4 th wave cant be too small in comparison to 2 th wave. But i understand in my case rule is broken.
Hi Lara, two questions, so that I can better understand your charts:
“limit to minute wave v; not above 1423.84”
what do you exactly mean by this phrase? That Gold shouldnt go above 1423.84 at all or not above in the daily chart or not above in the hourly chart???
Same question with your phrase “invalidation 1407.61”, do you mean here, if gold is above 1407.60 at the closing price of an hour or invalidation is at any time if gold is above 1407.60???
Thank you!
Susanne
Most excellent questions.
Invalidation points are points beyond which the wave count is invalid. In other words, if price breaches an invalidation point then I’ve got it wrong. Invalidation points are black and white, even a fraction of a cent beyond them invalidates a wave count. But importantly, price must move BEYOND an invalidation point, not just equal it.
Third waves may never be the shortest, it’s a core Elliott wave rule. If a third wave is shorter than the first wave, then that tells us that the fifth wave may not exceed equality with the third wave. My wave count with the third wave labeled as ending at 1,384.63 would have been invalidated with any movement beyond 1,423.84, even by a fraction of a cent. However, there is a problem with the data I am using and most unfortunately it makes a BIG difference to the wave count. On the daily chart the third wave starts at 1,315.92, but on the hourly chart this price point is not touched and the third wave starts at 1,316.05. That 13 cents makes a big difference, and I’ll explain why in today’s video.