
At the hourly chart level Gold has behaved as expected, continuing lower for a fourth wave correction. The target was 1,401. So far price has reached down to 1,402.63, but it cannot be confirmed that this correction is over. The hourly chart will be shown at the end of this analysis with a brief explanation.
Today I will focus the analysis on the monthly charts, at super cycle degree. I will also compare Gold to Silver.
Click on the charts below to enlarge.
Gold – Monthly Chart – Super Cycle Wave Count.
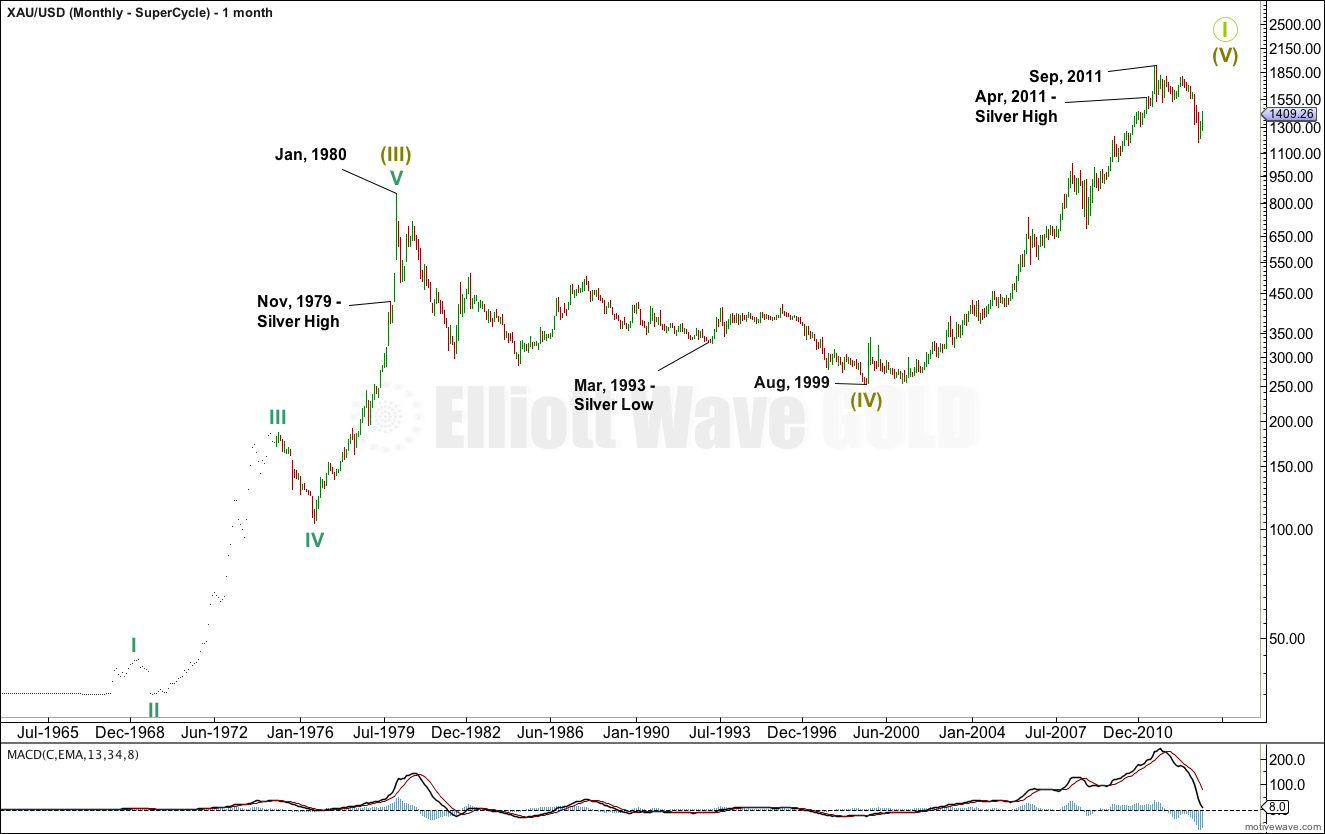
At super cycle degree for gold it looks like we have either seen the end of a long grand super cycle wave, or are close to the end. The key is the final fifth wave up at super cycle degree–is this structure complete or not? Is the recent downwards movement cycle wave IV within super cycle wave V, or is super cycle wave V over?
The next two monthly charts for gold will look at two possible interpretations for this structure. The wave count with the best fit and best Fibonacci ratios would be the most likely.
In comparison to silver we can see that these two markets do not always turn together. They are close, but not at the same time. Sometimes there is a difference of several months, and in the case of the 1990’s low for both markets gold turned 6 years and 5 months after silver found its low. In the case of the all time high gold turned 5 months after silver.
Silver appears to precede Gold. For this reason I have no problem with two wave counts for these markets that sees Silver having already completed a structure which Gold is yet to see unfold.
Although overall at the monthly chart level these two markets have similar looks, they are not the same. The wave structure must be different if the highs and lows are different.
Silver – Monthly Chart – Super Cycle Wave Count.
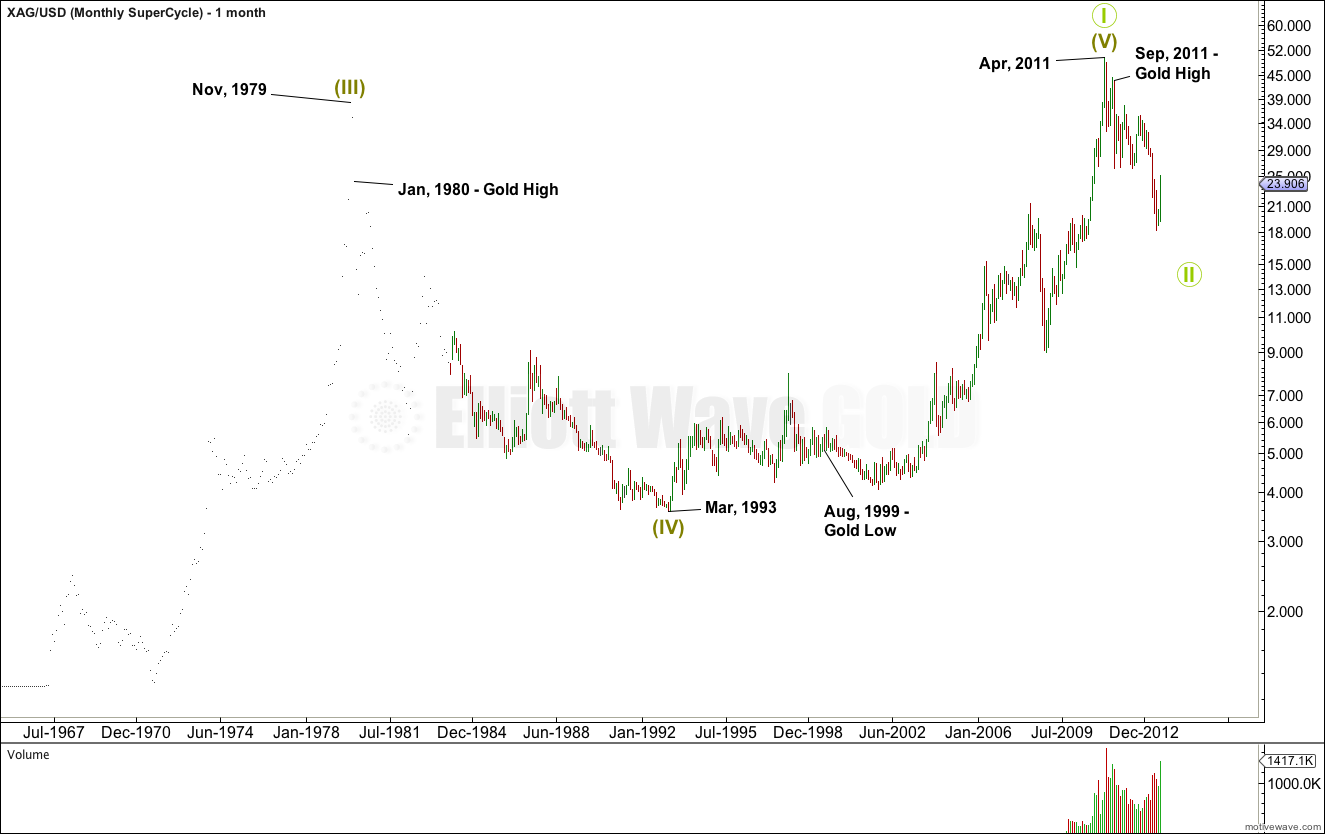
This chart is provided for comparison to the gold chart above. The highs and lows of both markets are highlighted on both charts.
This wave count for silver expects a new low to be formed before gold gets there. Which would fit with what has historically happened.
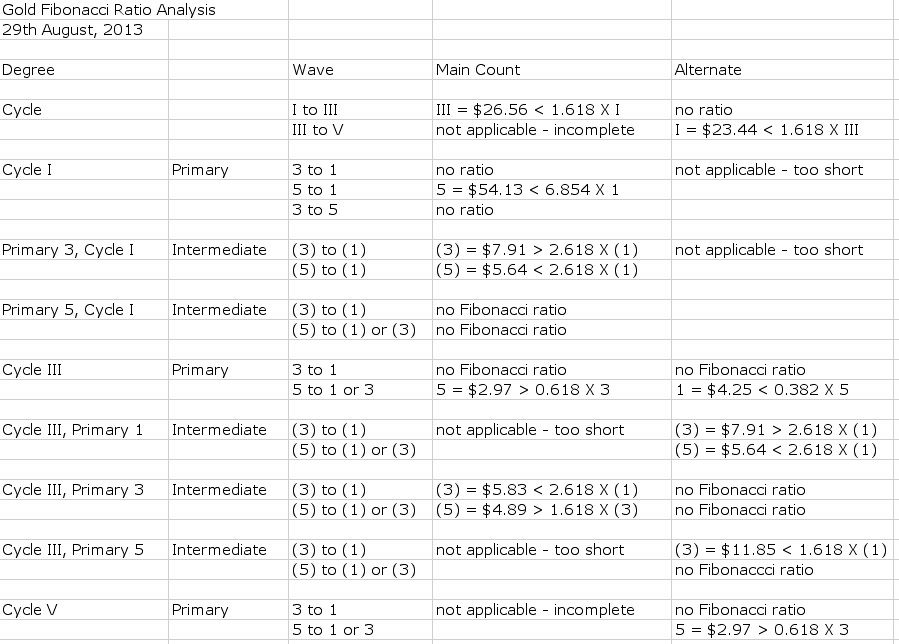
The table above compares Fibonacci ratios between the main and alternate wave counts for gold within cycle wave V. The main wave count is slightly better. Within the alternate there are no Fibonacci ratios within the middle of the third wave which is highly unusual for this market, and so must reduce the probability of the alternate wave count.
Gold – Main Monthly Wave Count.
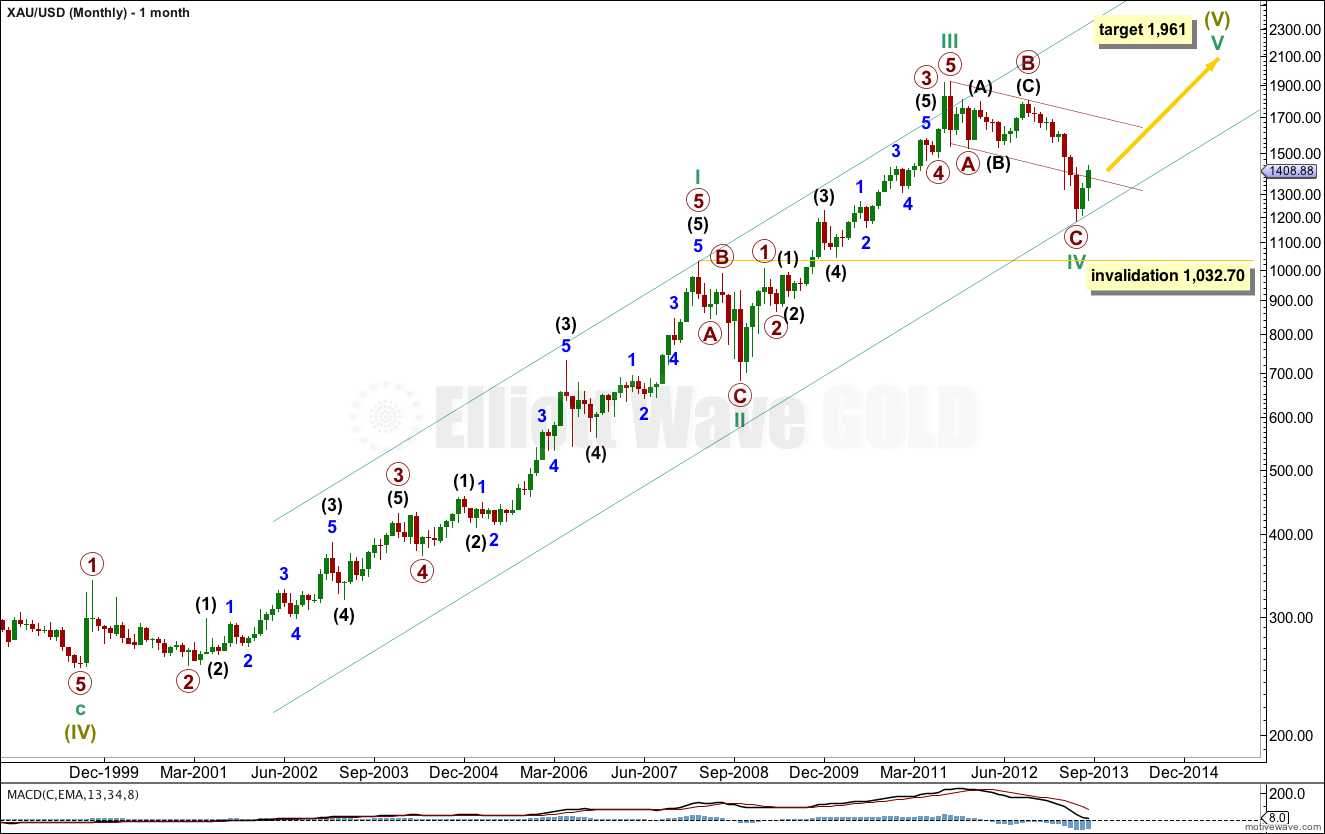
This will remain my main monthly wave count for gold because it has better Fibonacci ratios, particularly in the middle of the third wave. It is extremely common for gold to have excellent Fibonacci ratios in its third waves.
This wave count is adjusted from my last published analysis of the monthly chart. I have moved cycle waves I and II up. Previously, they were in the position where intermediate waves (3) and (4) now occupy, within primary wave 5 of cycle wave I. This change gives better proportion to cycle wave II.
With this labeling when we draw a channel about the upwards impulse using Elliott’s first technique cycle wave IV has strongly overshot the channel. Sometimes fourth waves do this and when they do we redraw the channel using Elliott’s second technique, and this is how I’ve drawn it. With this there is an overshoot for the end of cycle wave III which is very common.
If cycle wave V upwards has just begun, it should last about a year or longer. At 1,961 cycle wave V would reach equality in length with cycle wave I.
Cycle wave IV may not move into cycle wave I price territory. This wave count would be invalidated with movement below 1,032.70.
Gold – Alternate Monthly Wave Count.
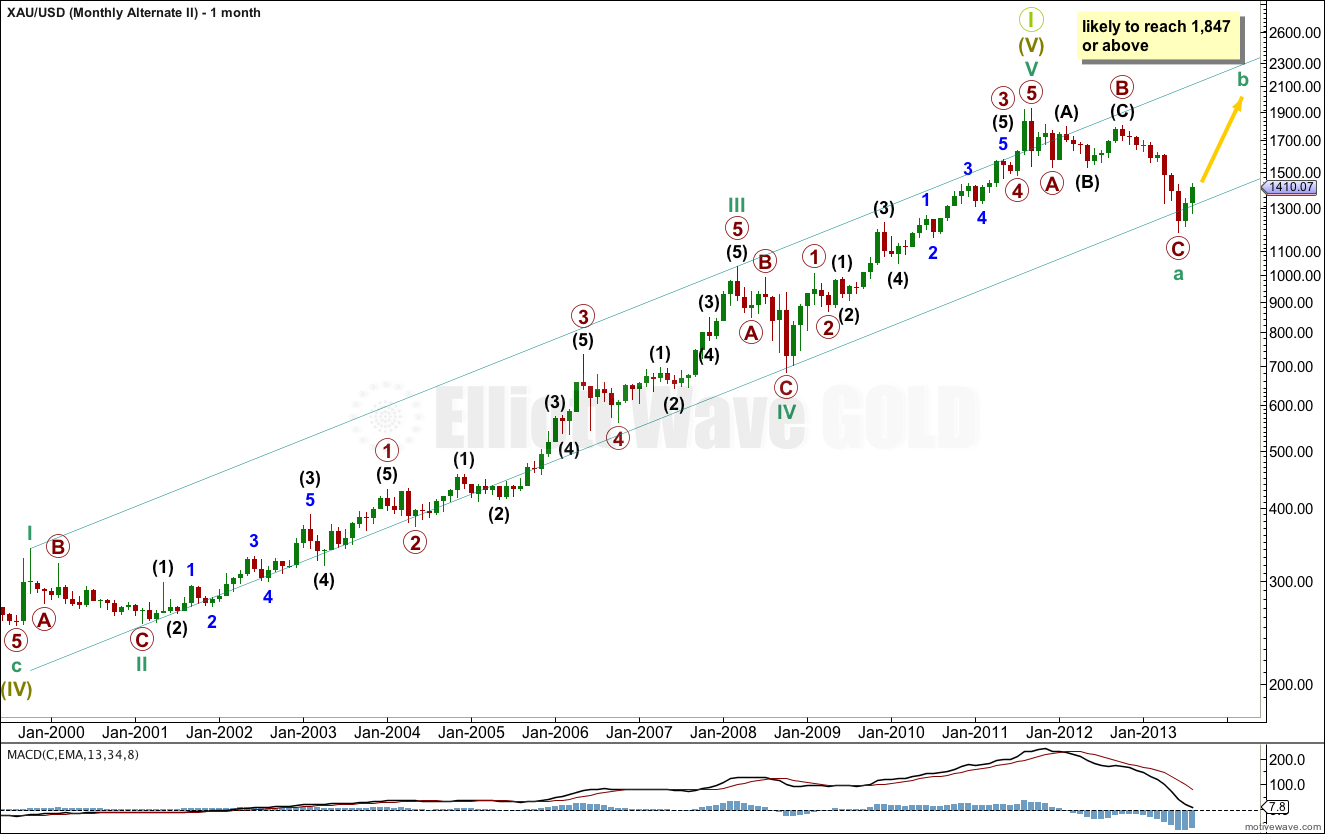
Alternatively, it is possible that a grand super cycle wave I is complete and this recent downwards movement is the start of a grand super cycle wave II.
At this stage, because the first part of the correction subdivides into a three wave structure, the correction may be a flat or double, both of which allow for new price extremes above 1,921.15 (a new all time high). A flat would expect upwards movement from here to subdivide as a three for cycle wave b which must reach a minimum of 90% the length of cycle wave a at 1,847 or above.
Alternatively, it may be that cycle wave a is an incomplete impulse. If that is the case then upwards movement which began on 28th June, 2013, would be a fourth wave correction at primary wave degree. It may not move into what would be primary wave 1 price territory (labeled here as primary wave A) above 1,522.75.
Movement above 1,522.75 would confirm the downwards correction as a completed three wave structure. At that stage I would have confidence that price should keep rising to about 1,847 or above and may make new highs.
In the mid to long term this alternate wave count does not diverge from the main wave count. Close attention to the structure of the next wave upwards is required to determine which of these two monthly wave counts is correct; if it is a three wave corrective structure this alternate is correct, and if it is a five wave motive structure the main wave count is correct.
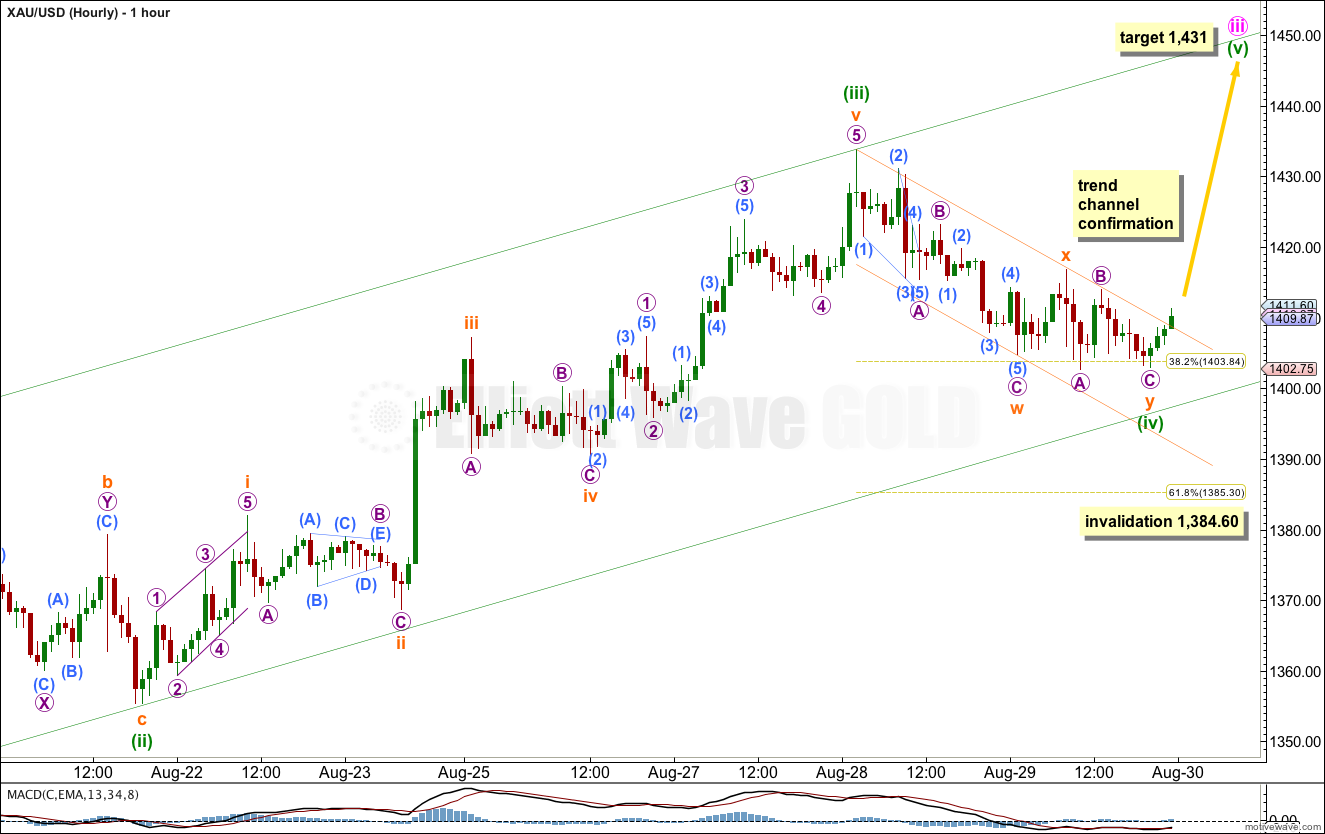
This hourly chart follows on directly from yesterday’s analysis.
Within minuette wave (iv) the structure may be complete, but it is also equally as likely that subminuette wave y may be an incomplete triangle.
Movement above the small parallel channel containing minuette wave (iv) would provide some confidence that minuette wave (iv) is over and minuette wave (v) has begun.
Minuette wave (iv) may not move into minuette wave (i) price territory. This wave count is invalidated with movement below 1,384.60.
Many thanks for explaining your thoughts on the longer term charts for the precious metals Lara.
Tyke
You’re welcome. That took me several hours!
It really was necessary to check turning points in relation to silver, and I had intended to take another look at my monthly wave counts for gold anyway this week.
Hi, are you sure that the target for minute iii is only 1431 as minuette iii has already passed that level?
Yes, at this stage I am sure.
That is where minute iii equals 1.618 the length of minute i.
It would see the fifth wave either slightly truncated, or ending about the same level as the third wave.
This is the only wave degree I can use to calculate the target at this stage.
When minuette wave (iv) is confirmed as complete then I can calculate the target at minuette wave degree, so it may change. I can’t do that yet.