
Last analysis expected more upwards movement for Friday which is what happened. Confidence in this wave count increased with price movement above 1,332.33.
The wave count remains the same.
Click on the charts below to enlarge.
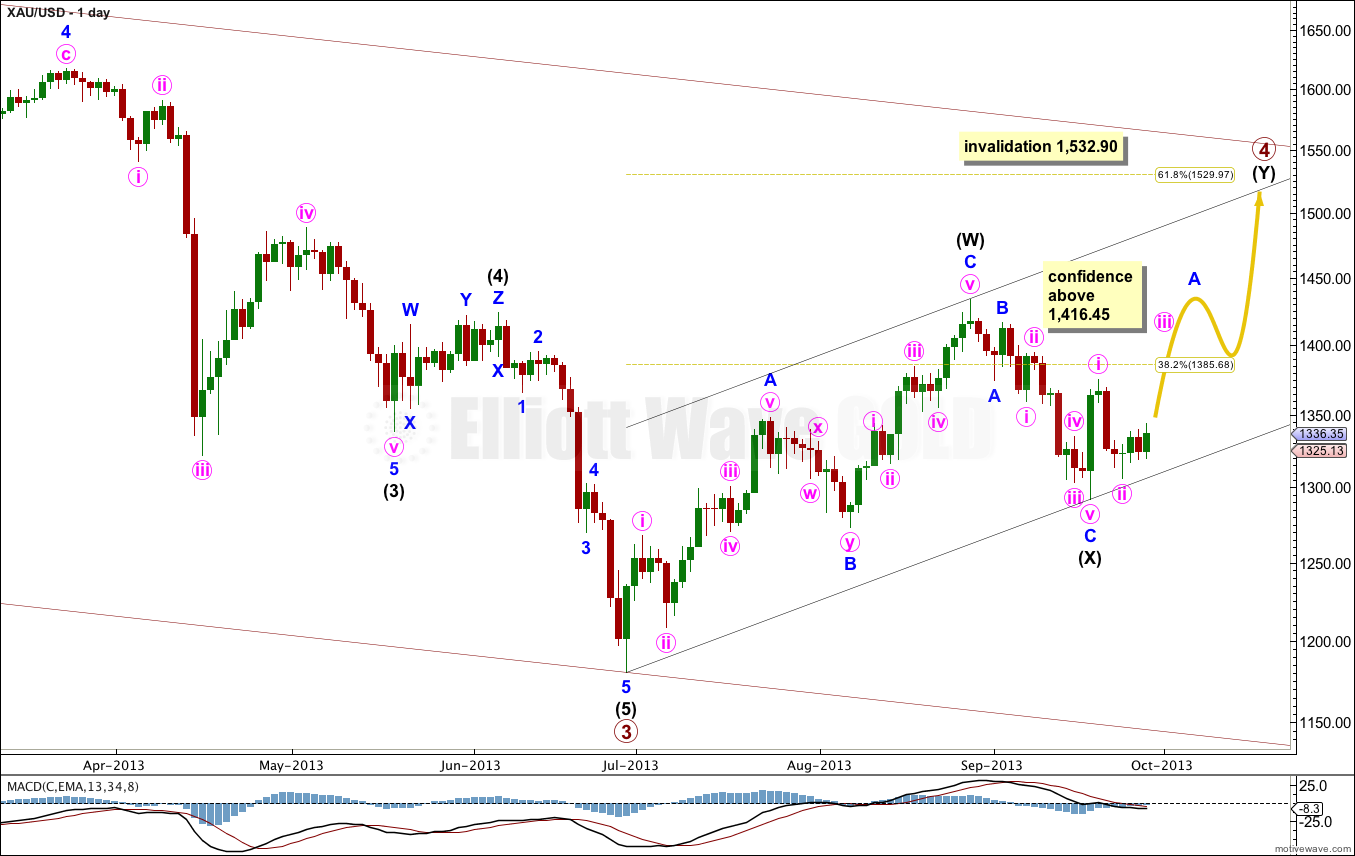
There are still several possible structures for primary wave 4. So far we have a three down from the high at 1,433.83. This three down is less than 90% the length of intermediate wave (W) so it cannot be a B wave within a flat over there. This structure may be a double zigzag or double combination. In a double combination the second structure labeled intermediate wave (Y) may be either a flat or triangle.
It is most likely at this stage that primary wave 4 is continuing as a double zigzag rather than a combination, because combinations commonly have X waves which are deeper than this one is. Intermediate wave (Y) is most likely to be a zigzag.
Primary wave 2 was a deep 68% regular flat correction lasting 54 weeks. Given the guideline of alternation we may expect primary wave 4 to continue for longer than it has so far, possibly for another eight weeks to last a Fibonacci 21 (give or take one week either side of this). If it completed as a double zigzag there would be nice alternation in structure with primary wave 2.
Primary wave 4 has already passed the 0.382 Fibonacci ratio, so it may end about the 0.618 Fibonacci ratio of primary wave 3 at 1,529.97. It should find resistance at the upper edge of the parallel channel drawn here using Elliott’s first technique.
When I know where minor waves A and B within primary wave Y have ended then I can use the ratio between minor waves A and C to calculate a target for upwards movement to end. I cannot do that yet.
Primary wave 4 may not move into primary wave 1 price territory. This wave count is invalidated with movement above 1,532.90.
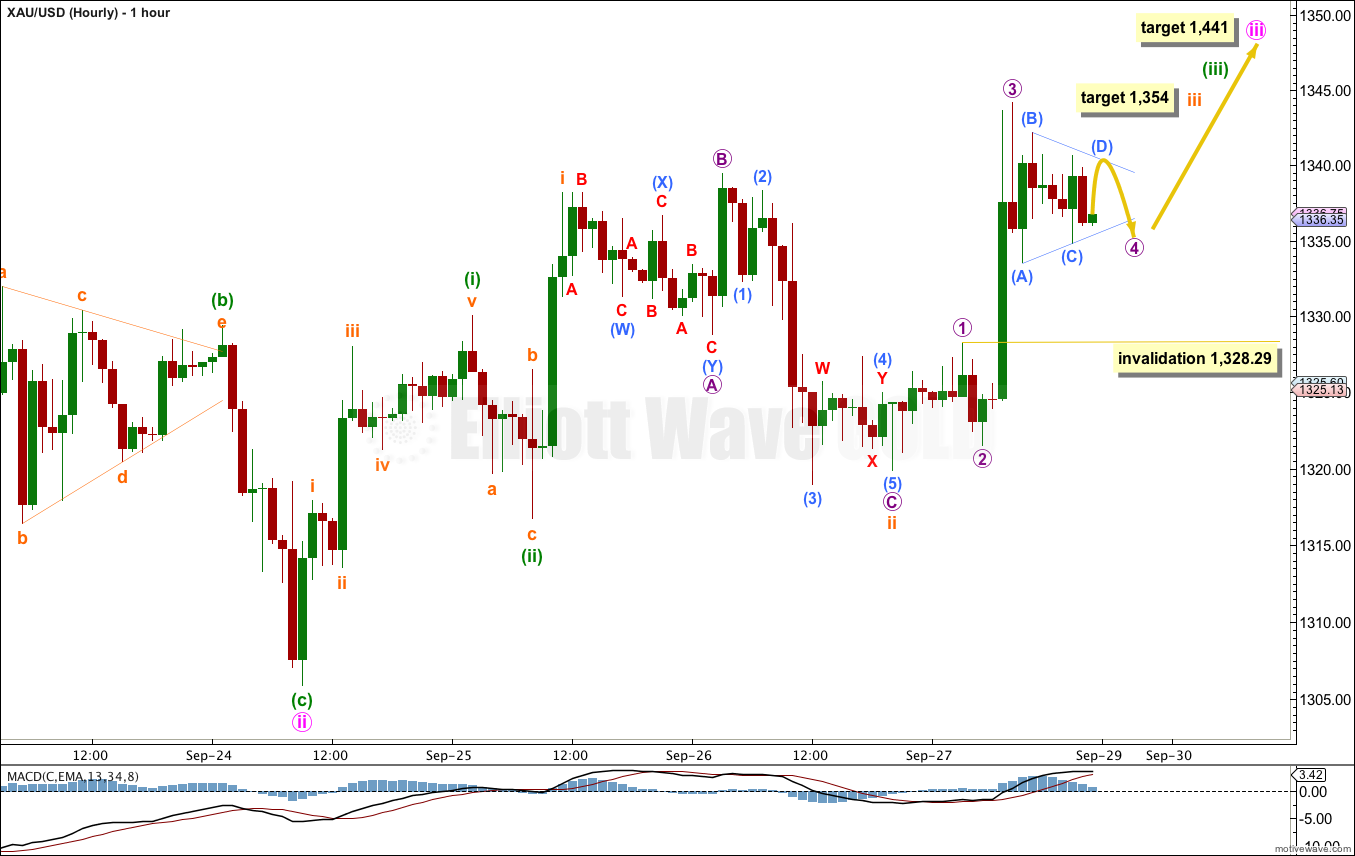
The session did begin with a little sideways and slightly lower movement, which was expected, but submicro wave (5) did not move beyond the end of submicro wave (3) and it was truncated.
Subminuette wave ii is an expanded flat correction: micro wave B was a 114% length of micro wave A, and there is no Fibonacci ratio between micro waves A and C.
Ratios within micro wave C are: submicro wave (3) is 0.7 longer than 1.618 the length of submicro wave (1), and submicro wave (5) has no Fibonacci ratio to submicro waves (1) or (3).
Within subminuette wave iii micro wave 3 is 0.7 longer than 2.618 the length of micro wave 1.
Micro wave 4 is most likely to be incomplete. At this stage it looks like it may be unfolding as a triangle. It also may be a flat or combination. It is likely that Monday will begin with sideways and lower movement for micro wave 5. This should be followed on Monday with upwards movement for micro wave 5.
Micro wave 4 may not move into micro wave 1 price territory. This wave count is invalidated with movement below 1,328.29.
At 1,354 subminuette wave iii would reach 1.618 the length of subminuette wave i. This target is short term for Monday to Tuesday.
At 1,441 minute wave iii would reach 1.618 the length of minute wave i. This mid term target may be about a week or so away.
Alternate Daily Wave Count
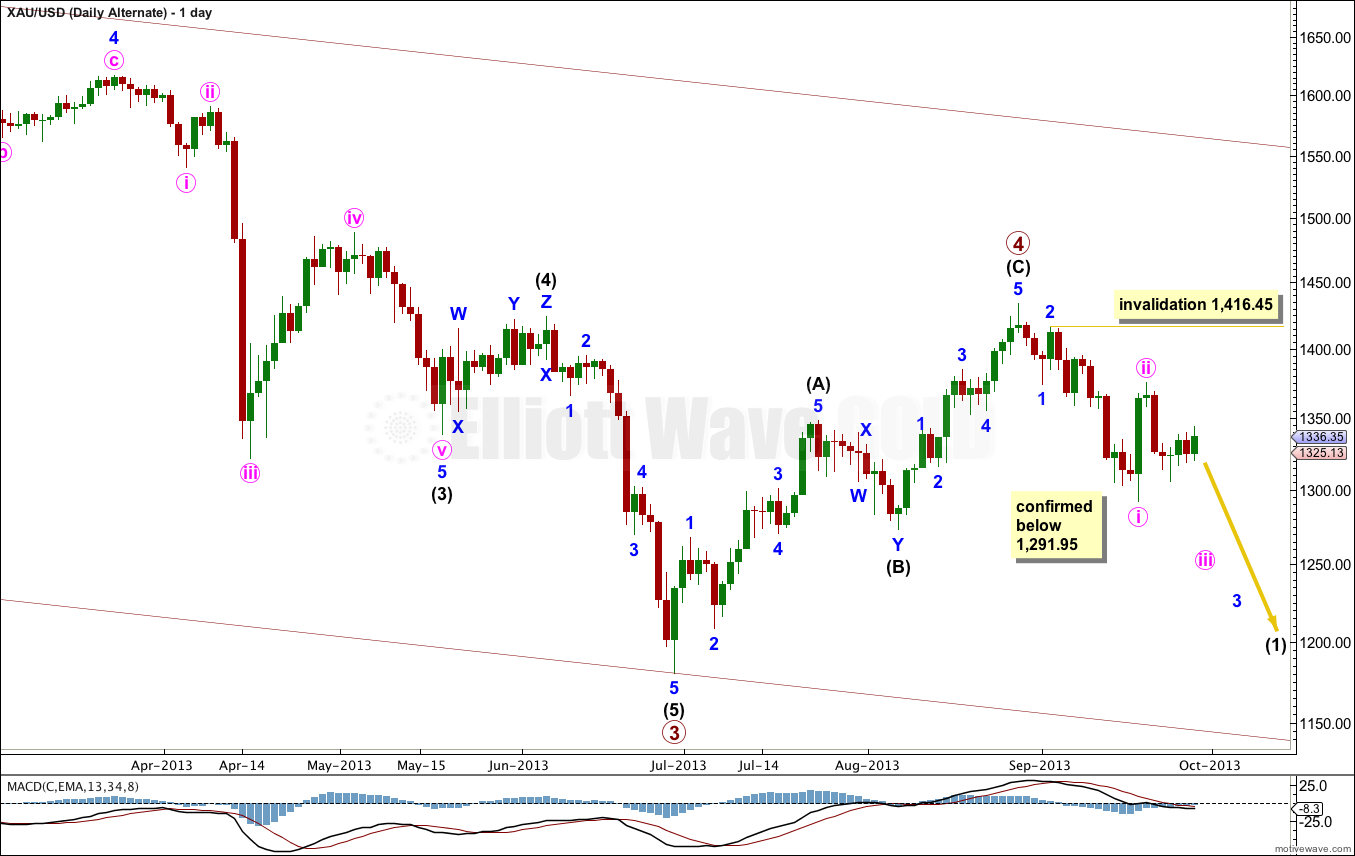
I have tried to see as many alternates as I can. This wave count is possible but it has problems of proportion which make it look odd. I will publish it as a slim outlying possibility. I would only use it if it is confirmed with movement below 1,291.95.
If primary wave 4 is over then it lasted only 9 weeks, compared to primary wave 2 which lasted 53 weeks. This gives the monthly chart the wrong look.
Within recent downwards movement minute wave ii may not move beyond the start of minute wave i. This wave count is invalidated with movement above 1,416.45. If price moves above this point next week I would have more confidence in the main wave count.
Dear Lara,
You wrote
“It is likely that Monday will begin with sideways and lower movement for micro wave 5”
I thinks you mean “micro wave 4″…Don’t you ?
Antoine
You’re absolutely right. I should have said micro wave 4, not 5. Thanks!