
Last analysis expected a completion of a small fourth wave triangle to be followed by upwards movement towards the short term target at 1,354.
The triangle completed as expected with sideways movement, and was followed by an upwards thrust which reached 1,352.90, just $1.10 short of the target.
Thereafter, price has turned lower for the next corrective wave.
The wave count remains the same.
Click on the charts below to enlarge.
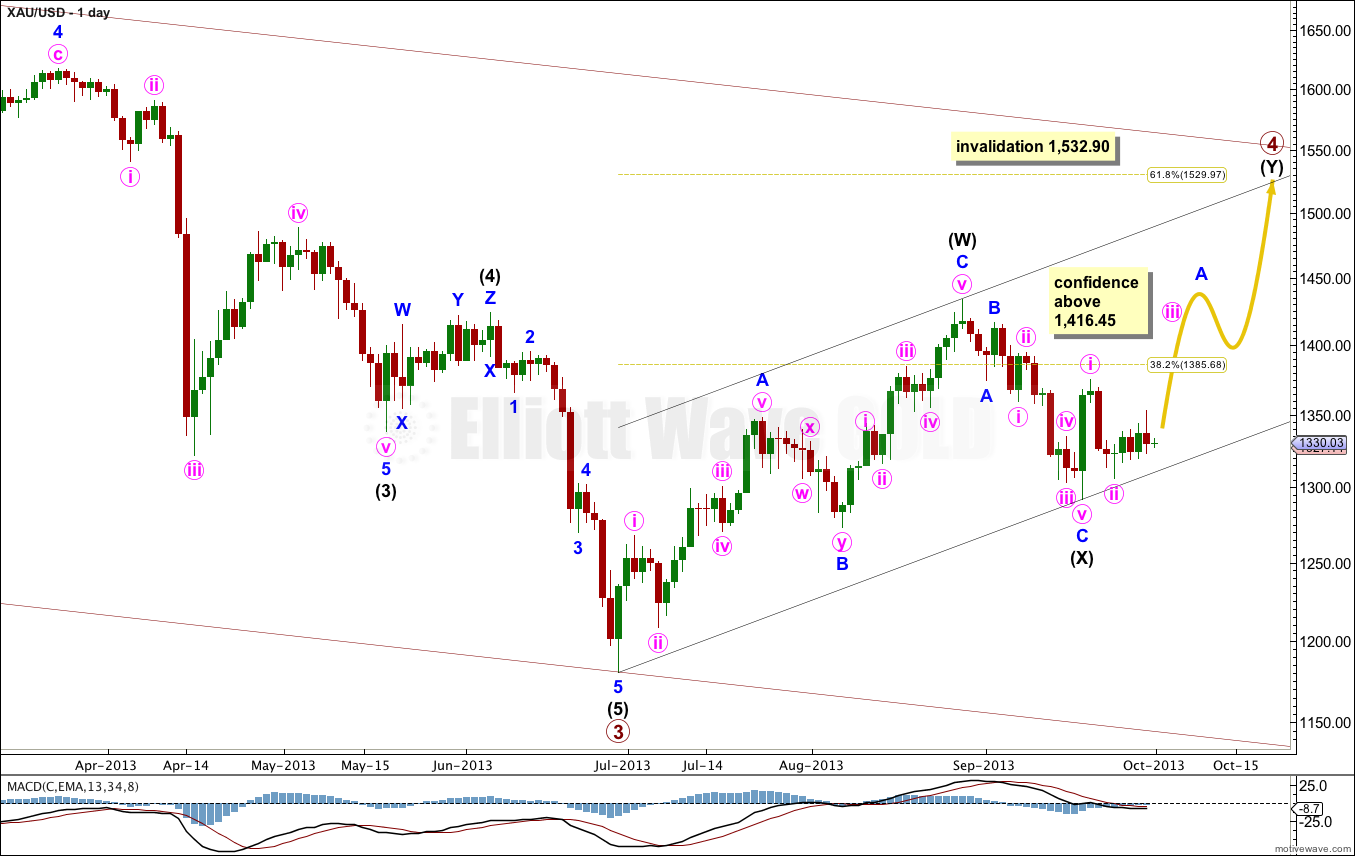
There are still several possible structures for primary wave 4. So far we have a three down from the high at 1,433.83. This three down is less than 90% the length of intermediate wave (W) so it cannot be a B wave within a flat over there. This structure may be a double zigzag or double combination. In a double combination the second structure labeled intermediate wave (Y) may be either a flat or triangle.
It is most likely at this stage that primary wave 4 is continuing as a double zigzag rather than a combination, because combinations commonly have X waves which are deeper than this one is. Intermediate wave (Y) is most likely to be a zigzag.
Primary wave 2 was a deep 68% regular flat correction lasting 54 weeks. Given the guideline of alternation we may expect primary wave 4 to continue for longer than it has so far, possibly for another eight weeks to last a Fibonacci 21 (give or take one week either side of this). If it completed as a double zigzag there would be nice alternation in structure with primary wave 2.
Primary wave 4 has already passed the 0.382 Fibonacci ratio, so it may end about the 0.618 Fibonacci ratio of primary wave 3 at 1,529.97. It should find resistance at the upper edge of the parallel channel drawn here using Elliott’s first technique.
When I know where minor waves A and B within primary wave Y have ended then I can use the ratio between minor waves A and C to calculate a target for upwards movement to end. I cannot do that yet.
Primary wave 4 may not move into primary wave 1 price territory. This wave count is invalidated with movement above 1,532.90.
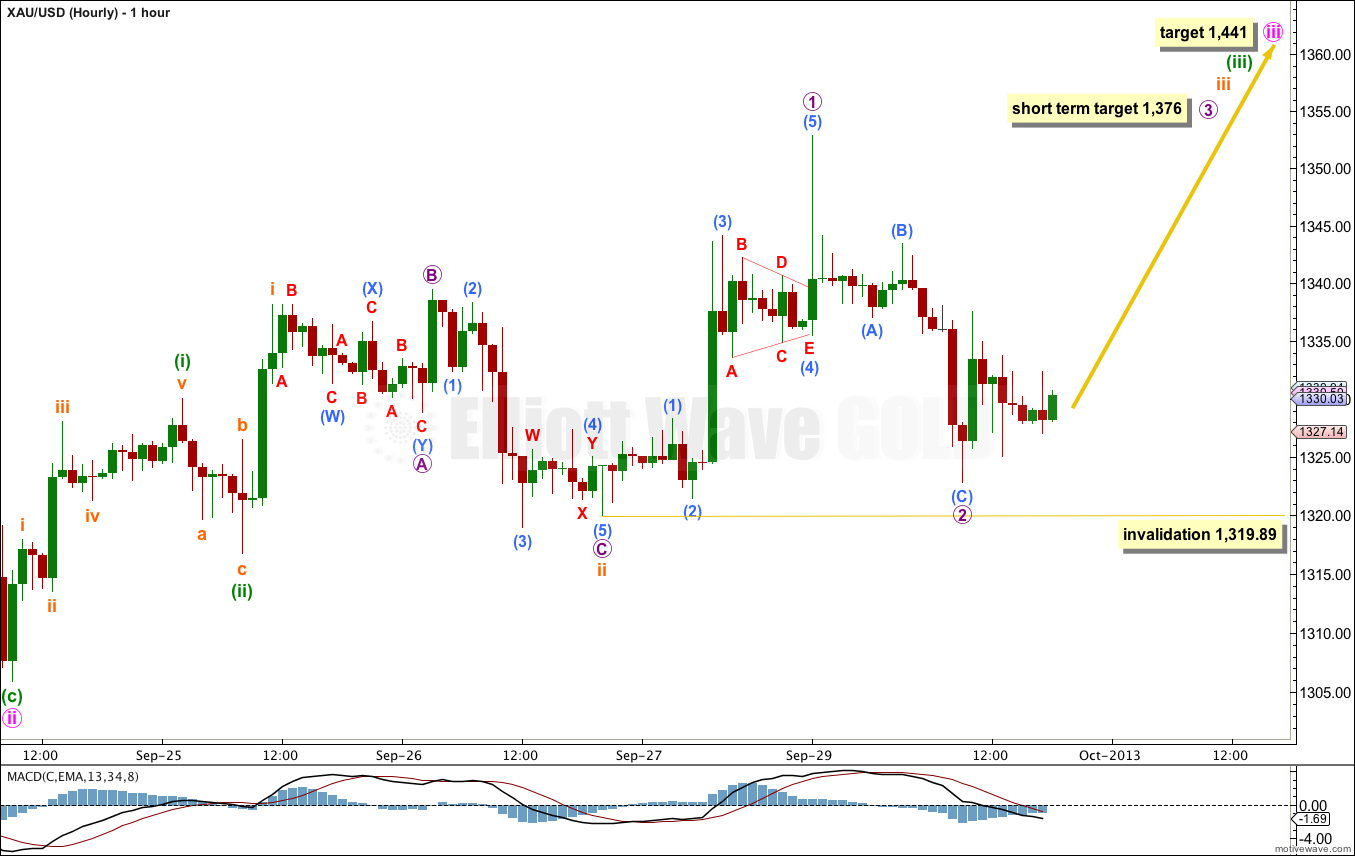
The fourth wave triangle completed exactly as expected, and the following fifth wave moved higher exactly as expected. The fifth wave was very brief though, and the following downturn is deeper than I would have expected. It is another deep second wave correction.
Ratios within micro wave 1 are: submicro wave (3) is 0.70 longer than 2.618 the length of submicro wave (1), and submicro wave (5) has no Fibonacci ratio to submicro waves (3) or (1).
Micro wave 1 is 1.71 short of 1.618 the length of subminuette wave i, one degree higher. I am noticing for Gold ratios not just between waves of the same degree, but between waves of different degrees also. I will play more with using this in target calculation to see if I can improve the accuracy rate.
This actually has a better fit now than last analysis which saw the middle of this third wave at minute wave degree as completed. That looked far too soon. What is much more likely is that we have seen a series of three overlapping first and second wave corrections. This is extremely common when third waves extend.
This wave count now expects a strong increase in upwards momentum this week.
At 1,376 micro wave 3 would reach 1.618 the length of micro wave 1. I would expect any surprises for this target to be to the upside.
At 1,441 minute wave iii would reach 1.618 the length of minute wave i. This mid term target is still probably about two weeks away.
At this stage if micro wave 2 moves lower it may not move beyond the start of micro wave 1. This wave count is invalidated with movement below 1,319.89.
Alternate Wave Count.
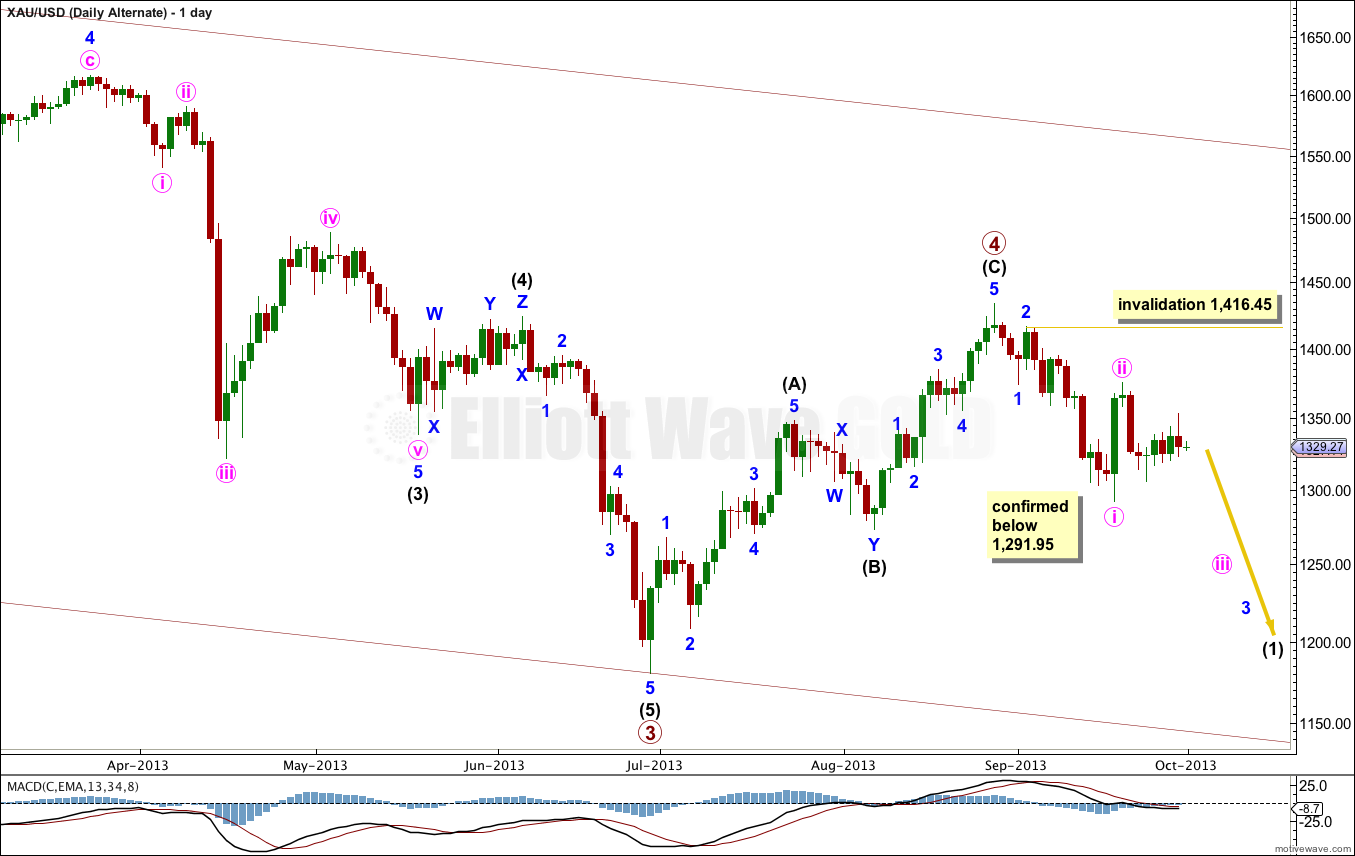
I have tried to see as many alternates as I can. This wave count is possible but it has problems of proportion which make it look odd. I will publish it as a slim outlying possibility. I would only use it if it is confirmed with movement below 1,291.95.
If the main wave count at the hourly chart level is invalidated with movement below 1,319.89 that is not enough to confirm this alternate. This alternate requires movement below 1,291.95. Between 1,319.89 and 1,291.95 the main daily wave count would be correct, but I would need to figure out what would be happening at the hourly chart level.
If primary wave 4 is over then it lasted only 9 weeks, compared to primary wave 2 which lasted 53 weeks. This gives the monthly chart the wrong look.
Within recent downwards movement minute wave ii may not move beyond the start of minute wave i. This wave count is invalidated with movement above 1,416.45. If price moves above this point next week I would have more confidence in the main wave count.
I have wave 2 lasting only 19 weeks not 53 weeks, the alternate count is on.
http://elliottwavegold.com/2013/09/gold-elliott-wave-technical-analysis-19th-september-2013/
for that idea you’d have to see primary wave 1 end at 1,527.09 and primary wave 2 begin there
so you have to resolve the problem then of what structure is primary wave 1? it can only be one of two structures; an impulse or a leading diagonal, and remember a leading diagonal may not have a truncated fifth wave
neither of those structures fit in that movement.
I am anxious to see Lara’s report tonight. I do not believe the alternate count is in effect. I think we are still trying to complete the “X” correction? Perhaps we will have 3 waves up(W), 3 waves down (X)and then a 5 wave C (Y)to complete?
zig zag
I’m trying to see a good alternate.
I have one which allows for intermediate wave (X) to continue lower, but it too has a low probability.
I am unable to see a high probability wave count… so far.
That’s the problem with probability. We must always expect a higher probability outcome, which means that when a low probability outcome occurs it is never what we have expected. But low probability outcomes do occur.
I have two wave counts for you so far, but both have problems which makes them low probability.
Lara,
That’s done. The market have chosen.
So it was the alternative scenario wich is the best…! Despite it Had some problem of proportion.
What a pity because the lower movement were 5 or 6% down…!
Just hoping, a second wave to go short et having a good timing with elliott wave
Antoine
I’m hoping that todays low is where the pink circle ii wave ends !
Hi Lara,
I would like to know your thoughts on how “other” technical analysis techniques might compliment your EW analysis. A good example may be the one posted on Safehaven on Sept 29 by Rambus Chartology. That analysis tends to be a little more bearish, favoring your alternate. One of the reasons is the way the Miners appear to be leading the way down. Any thoughts?
We use a lot of trend lines, and my husband also does a lot of comparing different markets to look for leaders / followers, and he does a lot of comparing different movements from different times in the same market.
We also use SMA at 8 and 34 day settings.
I am aware of more traditional technical analysis patterns, such as Head and Shoulders that Rambus is referring to, and I find Elliott wave to be more accurate. You can see H&S in an Elliott wave count of the end of a third wave (the first shoulder), the end of the following fifth wave (the head) and then a following first wave down and it’s second wave correction (the second shoulder). So the pattern is the same, both analysis techniques have their own descriptions for it. But Elliott wave has more black and white rules to analyse such a movement by. That makes such a difference.
Thanks Lara. Learning a lot about EW with your analysis.