
Yesterday’s analysis expected downwards movement from gold for a deep second wave correction which is exactly what happened.
The wave count remains the same.
Click on the charts below to enlarge.
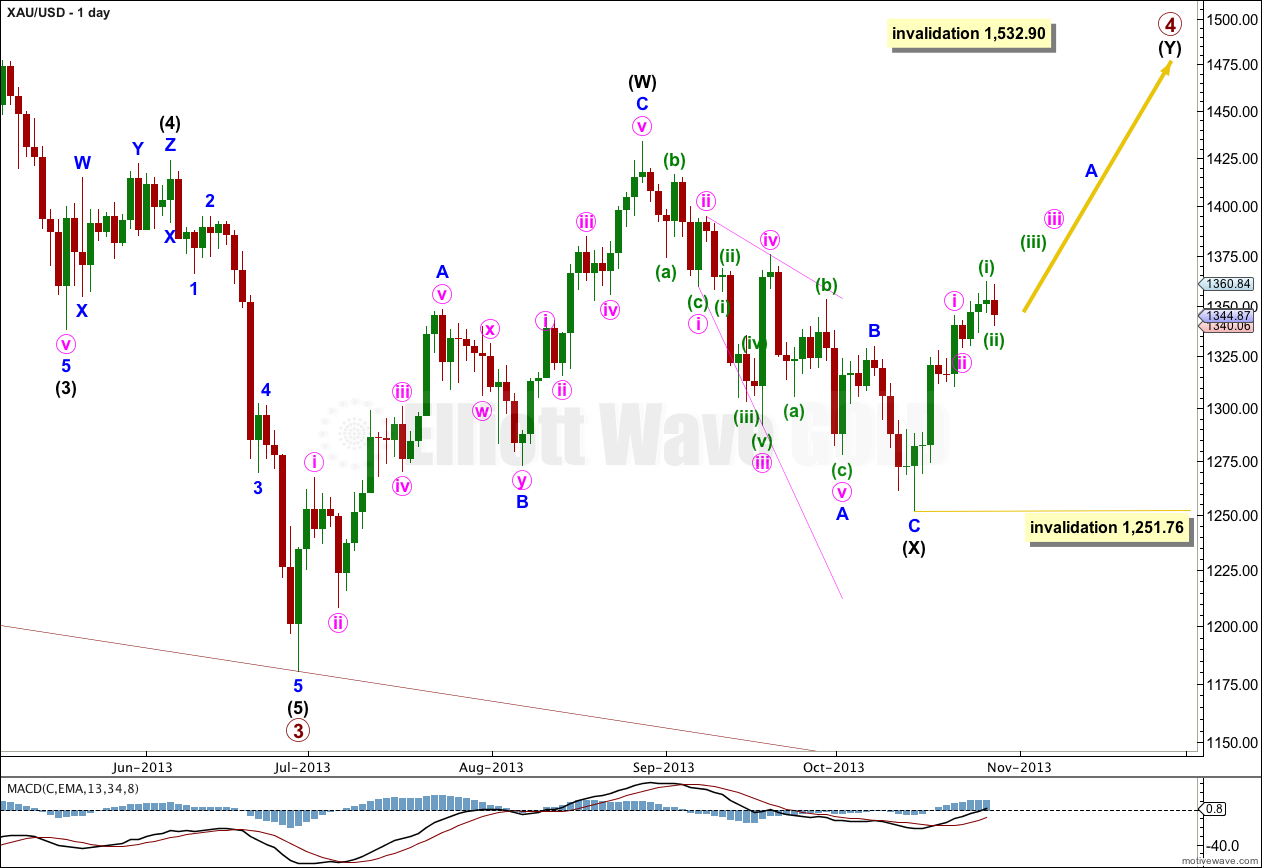
The structure for primary wave 4 cannot be a flat correction, because what would be the B wave is well less than 90% of what would be the A wave. That is why I have labeled it as a double.
Because intermediate wave (X) is quite shallow I would expect primary wave 4 is most likely a double zigzag rather than a double combination. Double combinations move price sideways and their X waves are usually deeper than this one is. Double zigzags trend against the main direction, and their purpose is to deepen a correction when the first zigzag did not take price deep enough. So I will be expecting intermediate wave (Y) to subdivide as a zigzag and to take price comfortably above 1,433.83. It should last about 35 to 45 days or sessions in total.
Within the zigzag of intermediate wave (Y) minor wave B may move beyond the start of minor wave A. This wave count is invalidated with movement below 1,251.76.
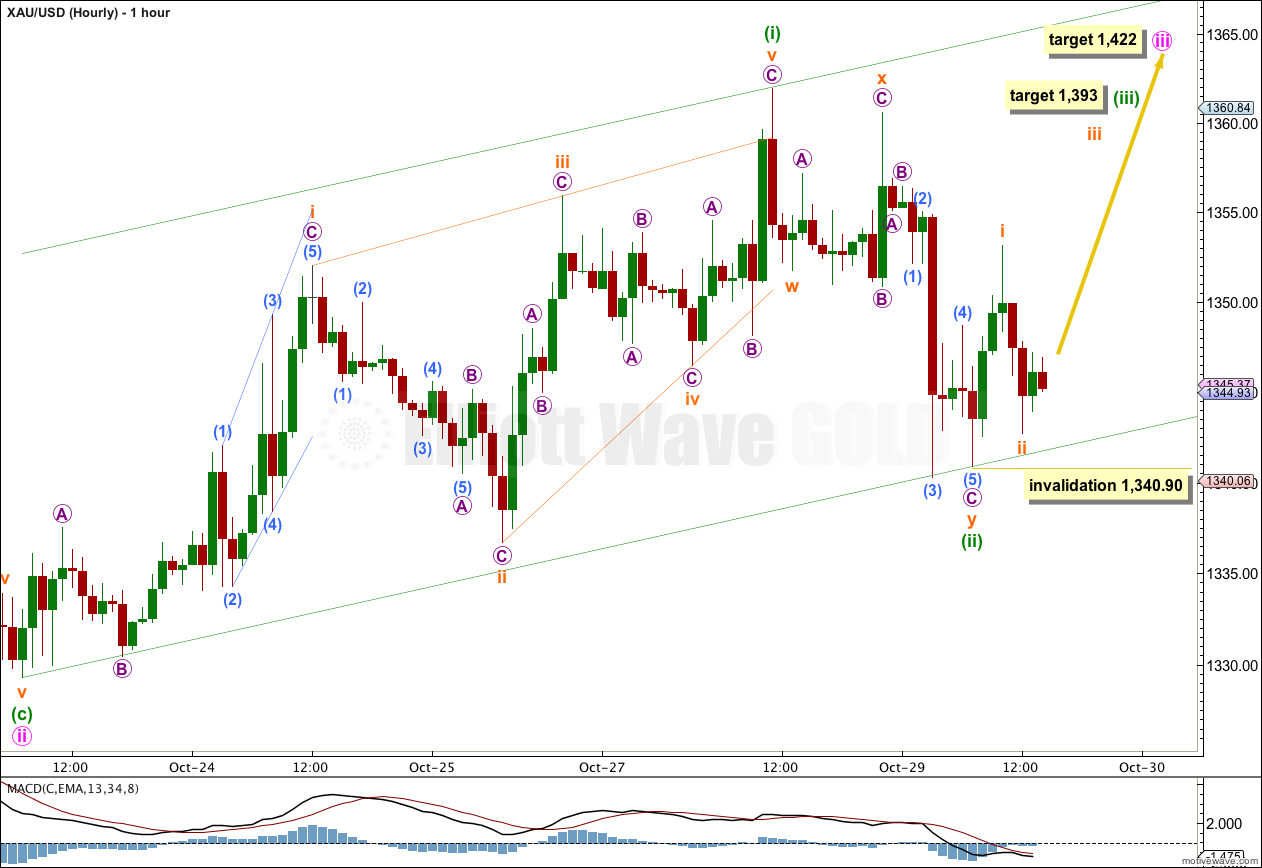
I have checked the structure of minuette wave (ii) carefully on the five minute chart. It does not subdivide into a single zigzag, but it does fit perfectly as a double zigzag.
Double zigzags are very common. Triples however are very rare. When a correction subdivides as a double zigzag the probability that it has ended is very high because the only way it could continue further would be as a vey rare triple. If my analysis of this correction is correct then minuette wave (ii) is over and minuette wave (iii) has just begun.
At 1,393 minuette wave (iii) would reach 1.618 the length of minuette wave (i). This target may be two to three days away.
I have drawn an acceleration channel about minuette wave (iii). If a third wave is underway then this channel should be breached by strong upwards movement.
At 1,422 minute wave iii would reach equality in length with minute wave i. This target may now be reached next week.
When third waves extend at minute wave degree they typically show their subdivisions on the daily chart. Minuette wave (ii) shows as a red candlestick on the daily chart, so this third wave is unfolding in typical fashion, so far.
Within minuette wave (iii) subminuette wave ii may not move beyond the start of subminuette wave i. This wave count is invalidated with movement below 1,340.90.
Hi Lara,
Gold has been following Yen (XJY) since 2011, it is about to resolve from a triangle to finish 5th. wave down. I find it hard to be bullish in gold at this stage. Any comment?
David