
Yesterday’s analysis expected an end to a second wave correction before a third wave down began. The second wave correction is moving sideways as a double and is incomplete. When it is done the third wave may begin.
Click on the charts below to enlarge.
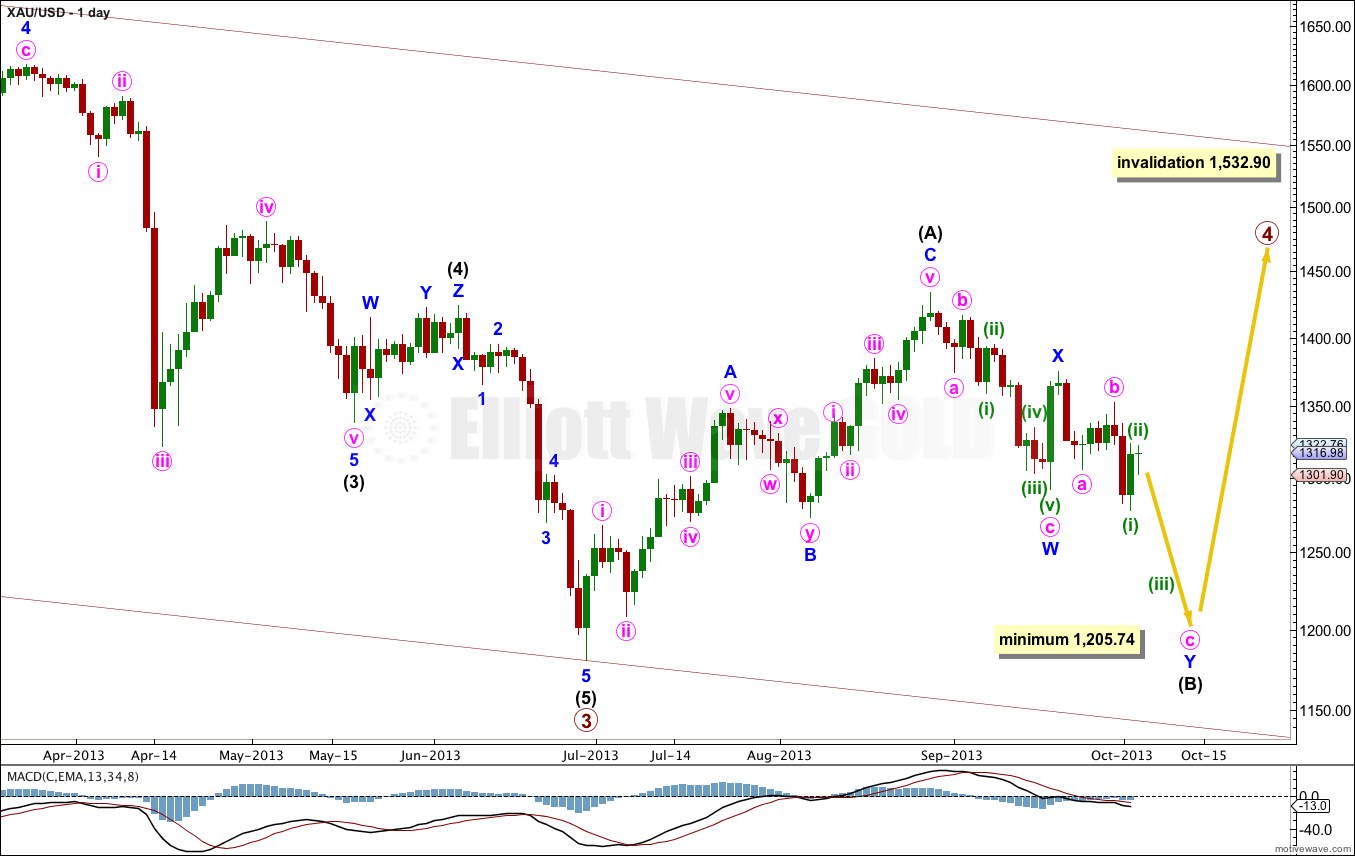
It is most likely that primary wave 4 is not over and is unfolding as a large flat correction.
Within the flat correction intermediate wave (B) must be at least 90% the length of intermediate wave (A). This wave count requires more downwards movement to this minimum at 1,205.74.
Within an expanded flat the B wave is 105% the length of the A wave, so this wave count allows for a new low as quite likely, because expanded flats are the most common type of flat.
Intermediate wave (B) would be about three or so weeks away from ending.
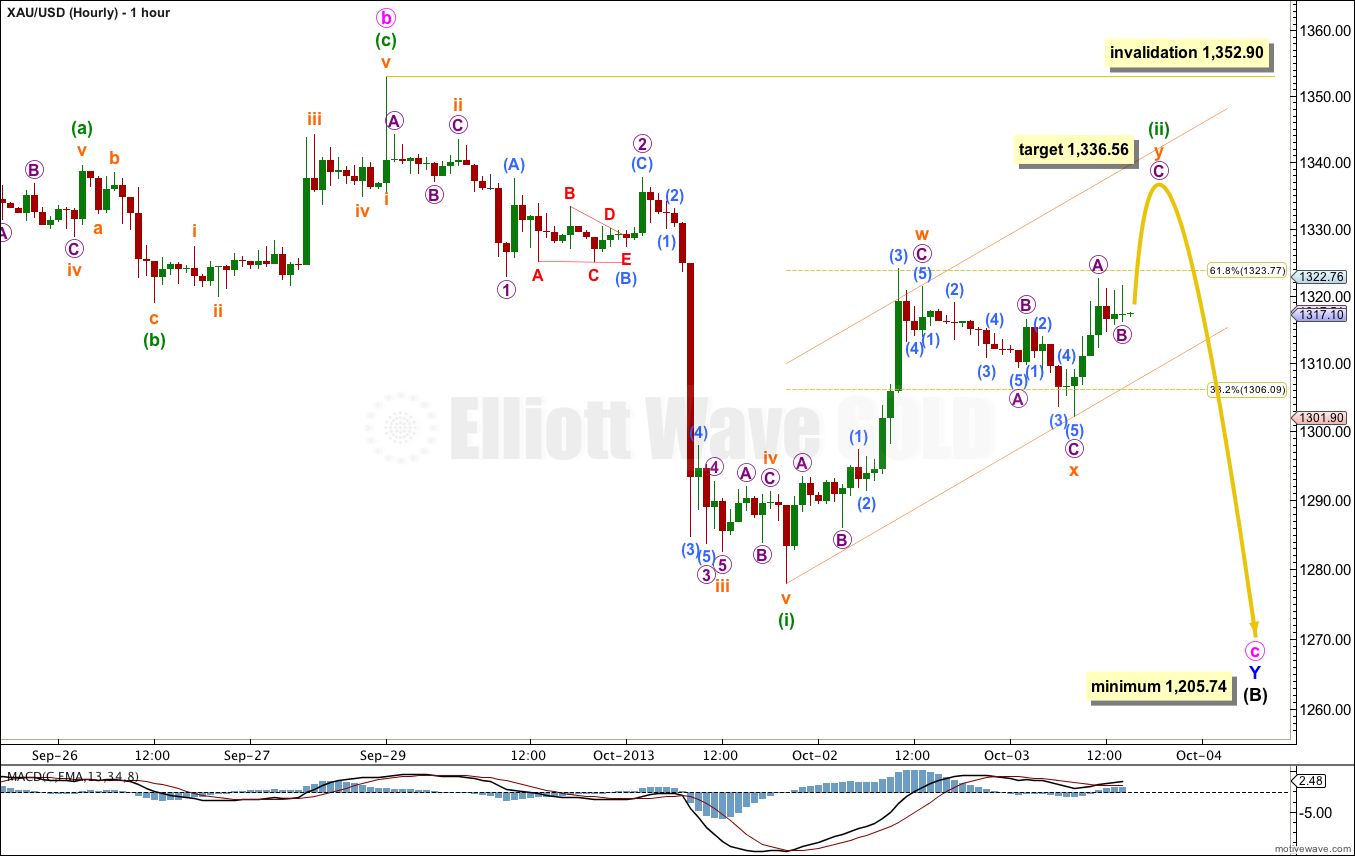
Price has not moved higher as expected. Price has moved sideways and breached the channel which was previously drawn about minuette wave (ii). This correction is incomplete though and the channel breach was clear, but the sideways movement subdivides into threes and is not the start of a third wave.
Minuette wave (ii) may be completing as a double zigzag. The purpose of double zigzags is to deepen a correction, and I would expect upwards movement before this is done. At 1,336.56 micro wave C within the second zigzag would reach equality with micro wave A. If micro wave B moves lower then the target must move correspondingly lower.
When we have a new high above 1,324 then I would expect a trend change to come shortly after.
We can draw a wider more conservative trend channel about minuette wave (ii) now. When this channel is clearly breached by downwards movement then minuette wave (iii) should be underway.
Minuette wave (ii) may not move beyond the start of minuette wave (i). This wave count is invalidated with movement above 1,352.90.
Alternate Daily Wave Count.
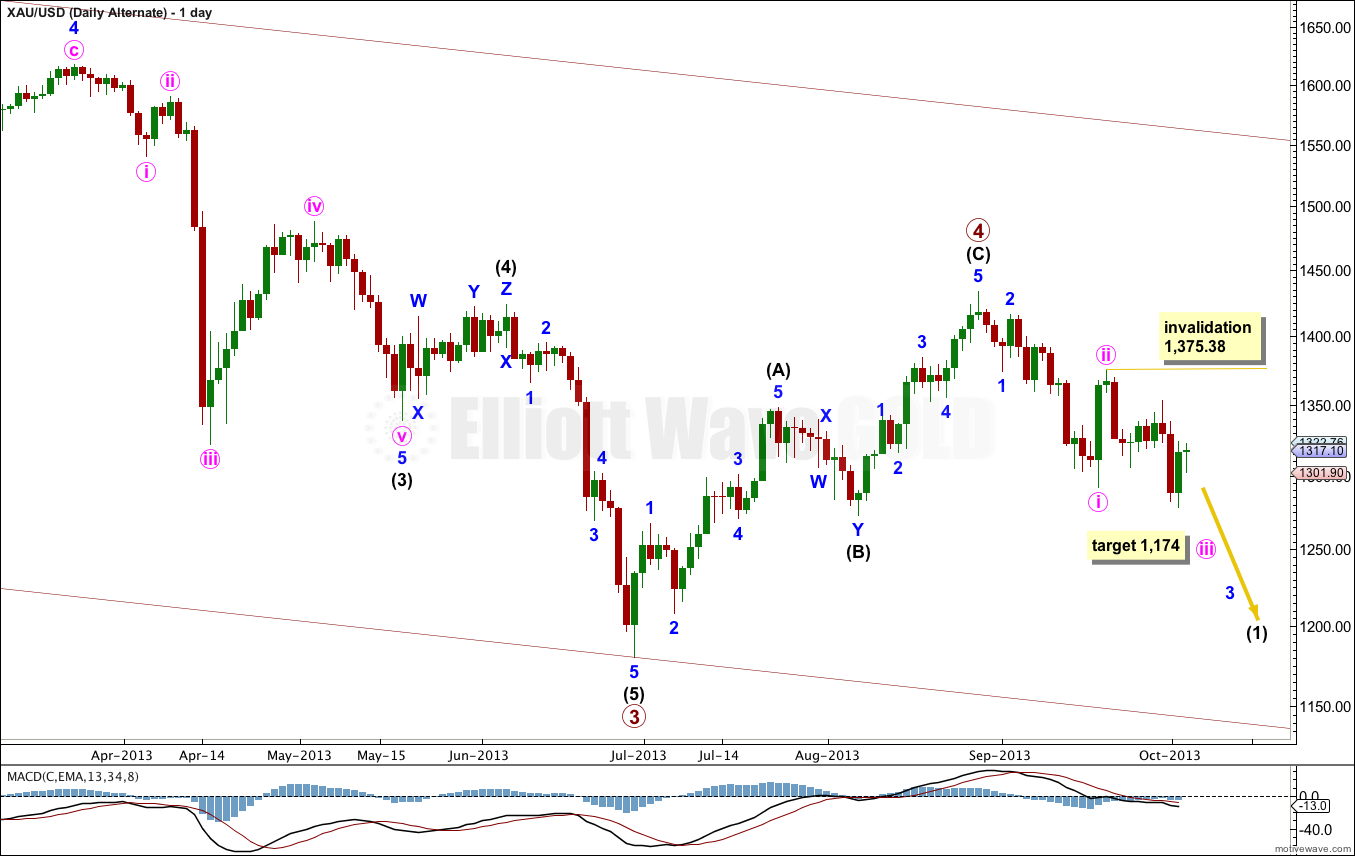
This wave count has problems of proportion which make it look odd. However, with movement below 1,291.95 it has increased in probability.
If primary wave 4 is over then it lasted only 9 weeks, compared to primary wave 2 which lasted 53 weeks. This gives the monthly chart the wrong look. However, primary wave 2 was a double combination and primary wave 4 a single zigzag. These corrective structures do have different durations; the purpose of combinations is to take up time and move price sideways. This wave count is technically possible, but it does not have a good probability.
At 1,174 minute wave iii would reach 1.618 the length of minute wave i.
Within minute wave iii no second wave correction may move beyond the start of its first wave. This wave count is invalidated with movement above 1,375.38.
“Bonjour Lara”,
What about the (x) wave (first zigzag)…?
The look is quite not comfortable in . It may be a simple 5 fives waves look;
As your (B) wave for a 4th wave,
and your (C) wave for 5th wave…
So the x wave, would be 5 waves, but I did’nt analyse the minuette waves (30 min).
The (C) wave is quite short with the (A) wave,
Is it an usual rule with the (x) wave ?
Regards
Antoine
I’ve emailed you a couple of charts, but should also reply here.
To determine if a movement is a three or a five you will need to analyse it on the 30 (or preferably) 5 minute time frame. For this movement there is no way it can be a five. It will not fit.
And the A and C waves are closer to equality than they are to 1:0.618. There’s no problem there.
Lara, thanks for your answer. Yes it’s better to analyse intraday waves(10 or 5 min)…Ok let’go for scénario. Waiting the end of the second (micro wave) before being SHort. Have a Gold week-end 😉 Antoine