
Last analysis expected a little more upwards movement to a short term target at 1,301. Price did not meet the target in a quiet sideways session.
The wave counts remain the same.
Click on the charts below to enlarge.
Main Wave Count.
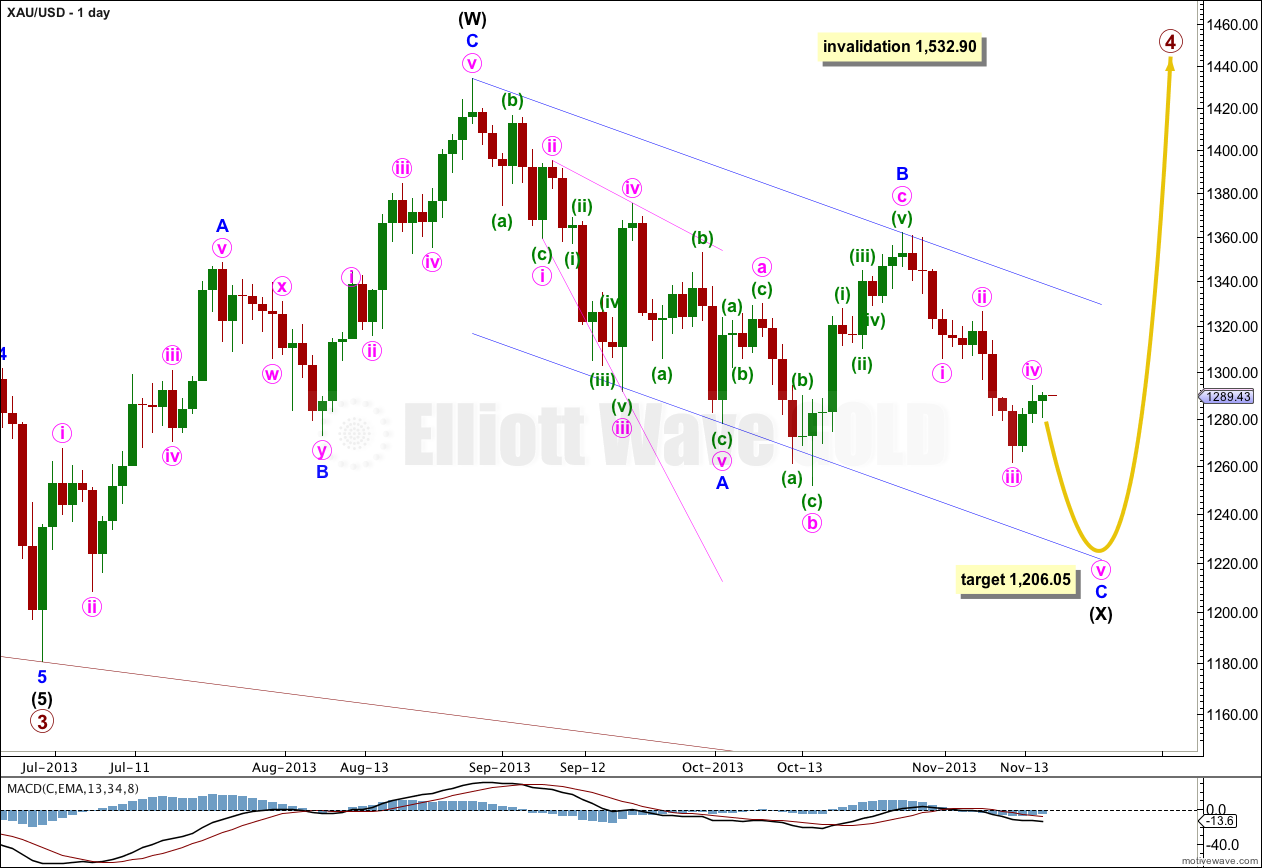
Gold is still within a large fourth wave correction at primary wave degree which is incomplete. It is now more likely to continue as a double combination because within it intermediate wave (X) should be deep.
The purpose of double combinations is to take up time and move price sideways, so I would now expect intermediate wave (Y) to end about the same level as intermediate wave (W) at 1,433.83. Double combinations in fourth wave positions are quite common.
If downwards movement reaches 1,205.74 or below then it would be 90% of the prior upwards movement labeled intermediate wave (W). At that stage I would relabel primary wave 4 as a flat correction, A-B-C rather than a combination W-X-Y.
Within the combination intermediate wave (X) is unfolding as a zigzag. Minor wave C downwards must complete as a five wave structure. At 1,206.05 minor wave C would reach equality in length with minor wave A.
There is no lower invalidation point for intermediate wave (X); X waves may make new price extremes beyond the start of W waves, and they may behave like B waves within flat corrections. For combinations X waves often end close to the start of W waves.
I have drawn a parallel channel about the zigzag of intermediate wave (X) using Elliott’s technique for a correction. Draw the first trend line from the start of minor wave A to the end of minor wave B. Place a parallel copy upon the end of minor wave A. I will expect minor wave C to find support at the lower end of this channel, and it may end there.
Primary wave 4 may not move into primary wave 1 price territory. This wave count is invalidated with movement above 1,532.90.
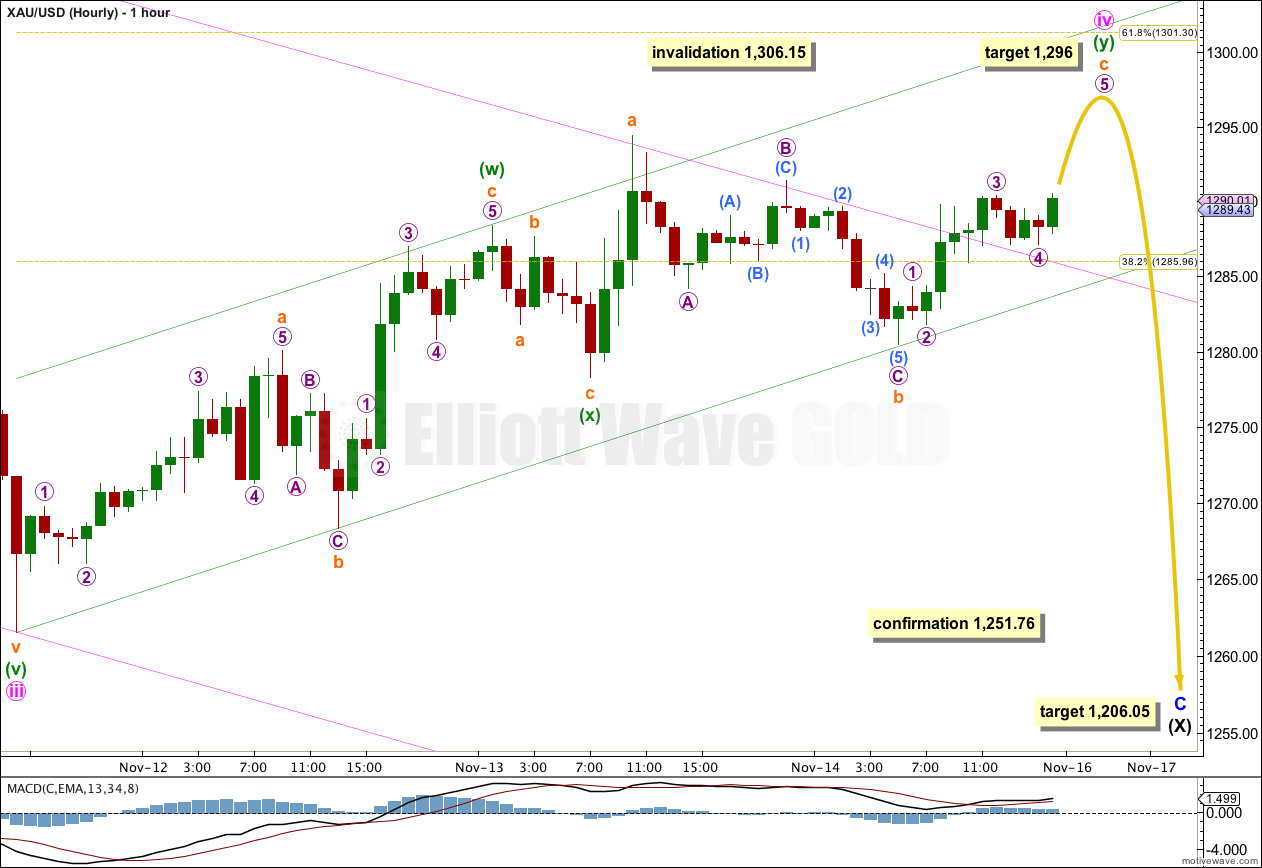
So far sideways movement looks like a continuation of minute wave iv. Minute wave iv is taking up more time, possibly to be in proportion to minute wave ii which lasted four days. If minute wave iv finishes on Monday then it too would have lasted four days.
Minute wave iv subdivides as a double zigzag. Sideways movement for Friday does not fit as a triangle, although if new highs above 1,294.43 do not eventuate then a triangle for minuette wave (y) may be possible. If that happens I would expect it too to end on Monday.
Minuette wave (y) is most likely unfolding as a zigzag, and minute wave iv is most likely a double zigzag. Within the second zigzag of the double, minuette wave (y), at 1,296 subminuette wave c would reach equality in length with subminuette wave a.
Draw a parallel channel about minor wave C. Draw the first trend line from the lows of minute waves i (as seen on the daily chart) to iii, then place a parallel copy upon the high of minute wave ii (seen on the daily chart). Minute wave iv has broken through resistance of the upper edge of the channel as expected, and now overshoots the channel. When minute wave iv is completed then I will redraw the channel using Elliott’s second technique: the first trend line from the highs of minute waves ii to iv, with a parallel copy upon the low of minute wave iii.
I have drawn a best fit channel about minute wave iv. The first trend line is drawn from the start of minute wave iv to the end of subminuette wave b within minuette wave (w). A parallel copy is placed upon the end of minuette wave (w). This best fit channel shows nicely where price is finding support on the way up. When this channel is very clearly breached with downwards movement then I would have some confidence that minute wave iv should finally be over and minute wave v downwards should be underway.
When minute wave iv is complete I will add to the target calculation for minor wave C downwards to end at minute wave degree, so the target is calculated at two wave degrees. The target at 1,206.05 may change or widen to a small zone.
Alternate Wave Count.
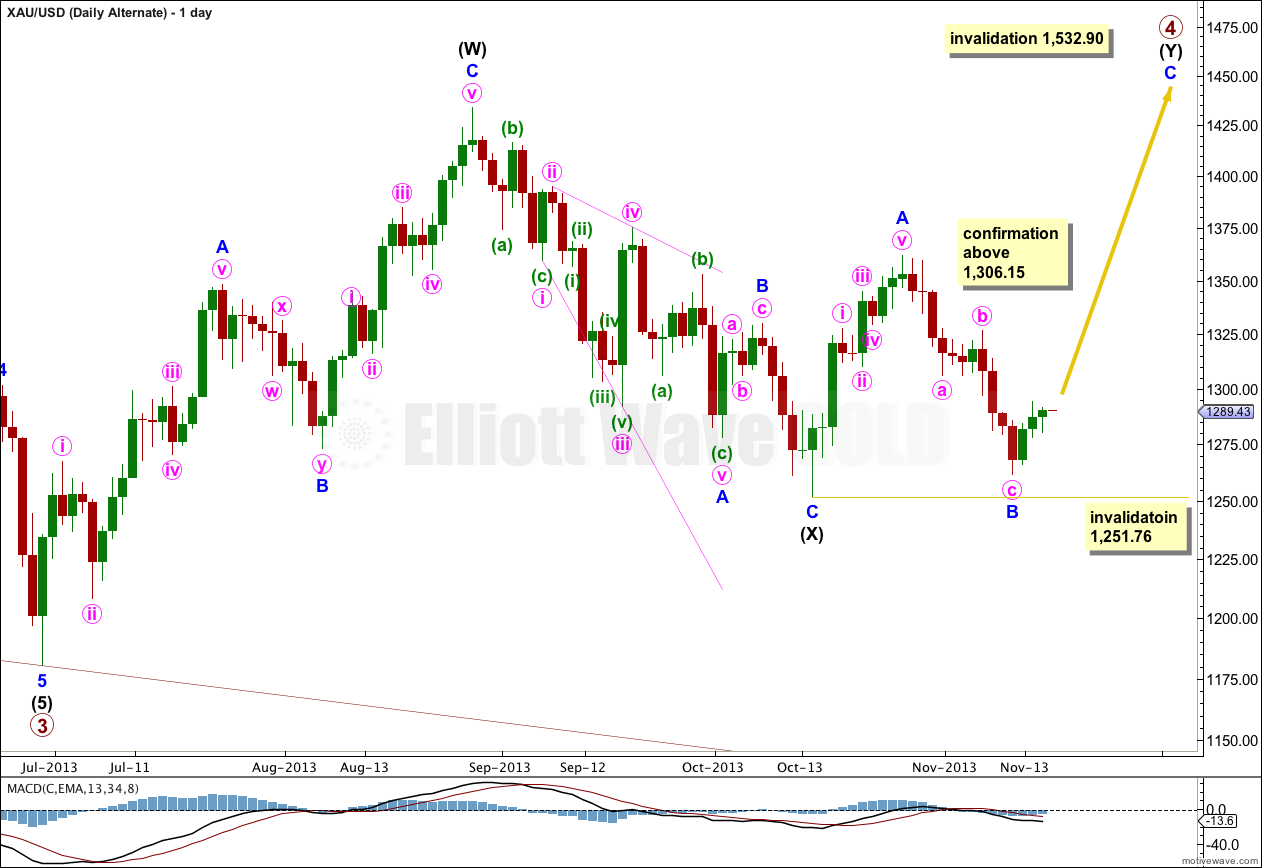
Up until a few days ago this was been the main wave count. Its counterpart for Silver was invalidated and so I would expect Gold to follow with an invalidation of this wave count within another two or three days.
This alternate looks at the possibility that primary wave 4 is a double zigzag, and that the second zigzag is underway.
Minor wave B may not move beyond the start of minor wave A. This wave count is invalidated with movement below 1,251.76.
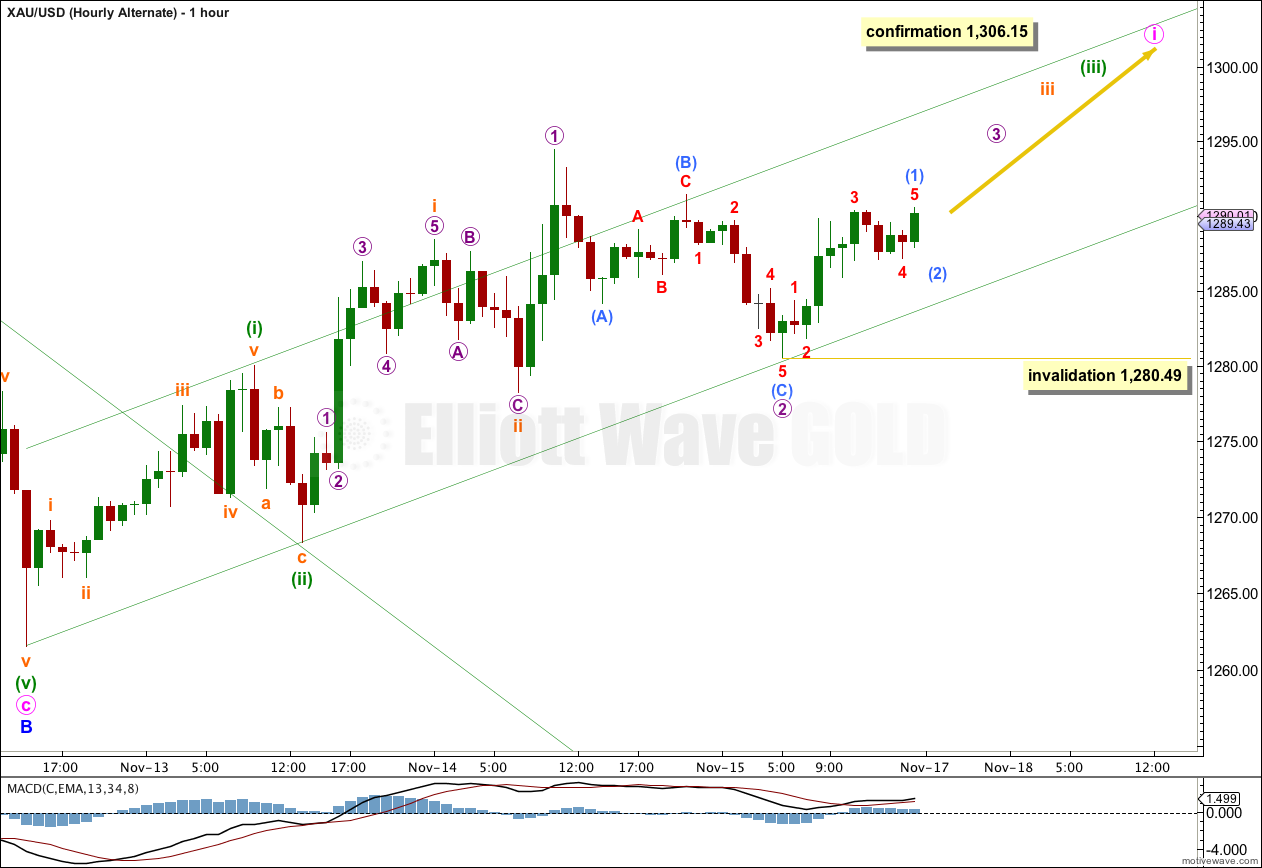
A decrease in upwards momentum during Friday further reduces the probability of this alternate wave count. If this wave count is correct we should be seeing and increase in upwards momentum as price moves into the middle of a third wave.
Lara, Why do you show your projected turn up at about 1224 when you keep saying Target at 1206?????? CONFUSING. Please tell me do you expect a bottom at !224??THANKS.
Like I said before, the target is the number calculated and given, not where I have placed the labels.
If I were to place the labels at the exact point every time the existing chart would be squished up. It should be expanded to show as much of the analysis as possible.
The targets are clearly given. Your confusion is in looking at the placement of the labels. Just use the targets I give.
“There is no lower invalidation point for intermediate wave (X); X waves may make new price extremes beyond the start of W waves”
So X could move lower–below 1200 to 1150 or 1100 or even lower? How / what would anticipate or indicate an X may move below 1200?
Yes, this X wave could move below 1,180.40 to make a new low below the start of W.
The only thing that would anticipate that happening is the structure of X. When this C wave is a completed five wave structure I will expect a turn. If this fifth wave within it extends (which is common for commodities) then it could reach quite low. I will use price points along the way to indicate a trend change; I use the “four cannot move into one” rule to do this, if upwards movement moves back into a first wave price territory then it cannot be just a fourth wave correction within the impulse and so at that stage the impulse must be completed and we should have seen a trend change.
I HAVE AN ANOTHER RESEARCH THEY SAY GOLD BOTTEMED NEAR 1000$ IN NEXT 30-45 DAYS
without a link to this research nor an explanation of why, your comment does not provide readers with any value at all.
please provide a link or a reason for this prediction.