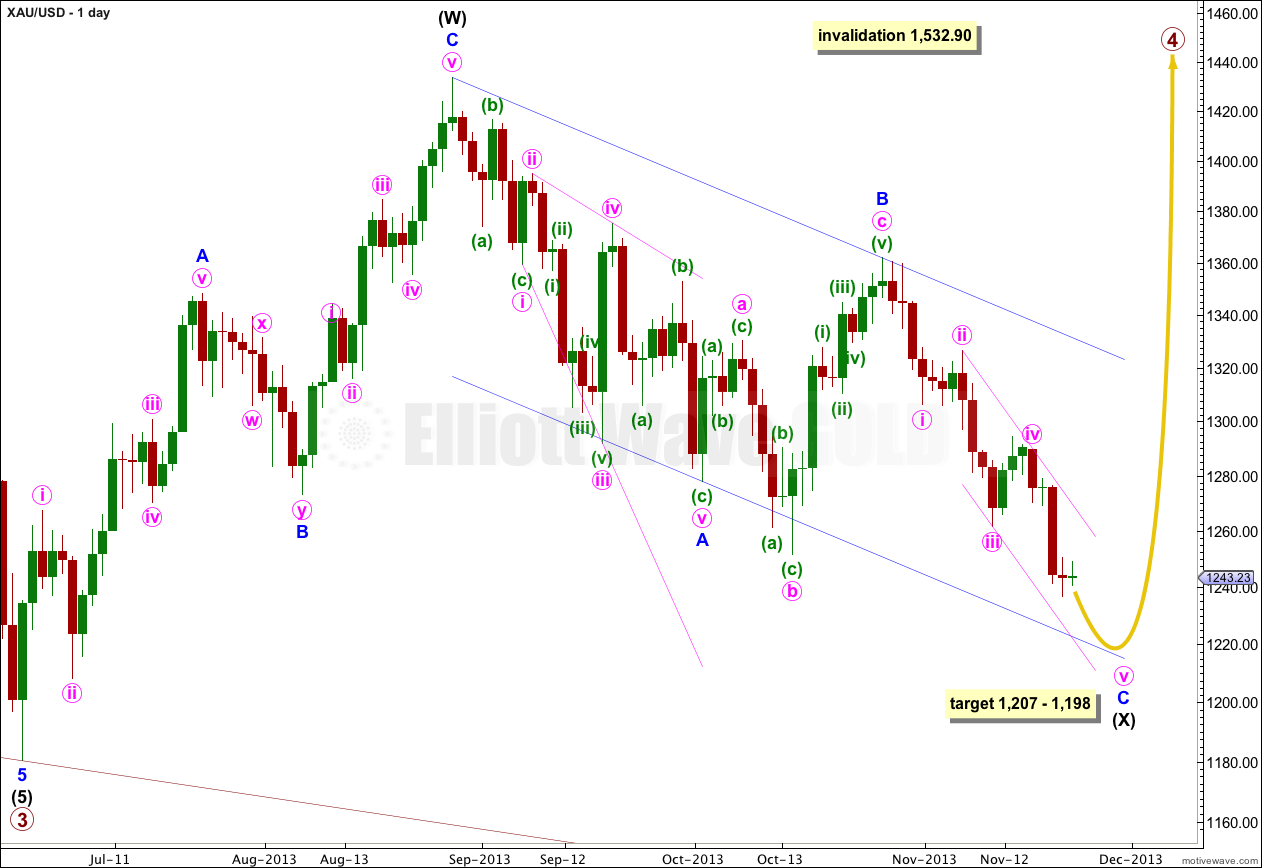
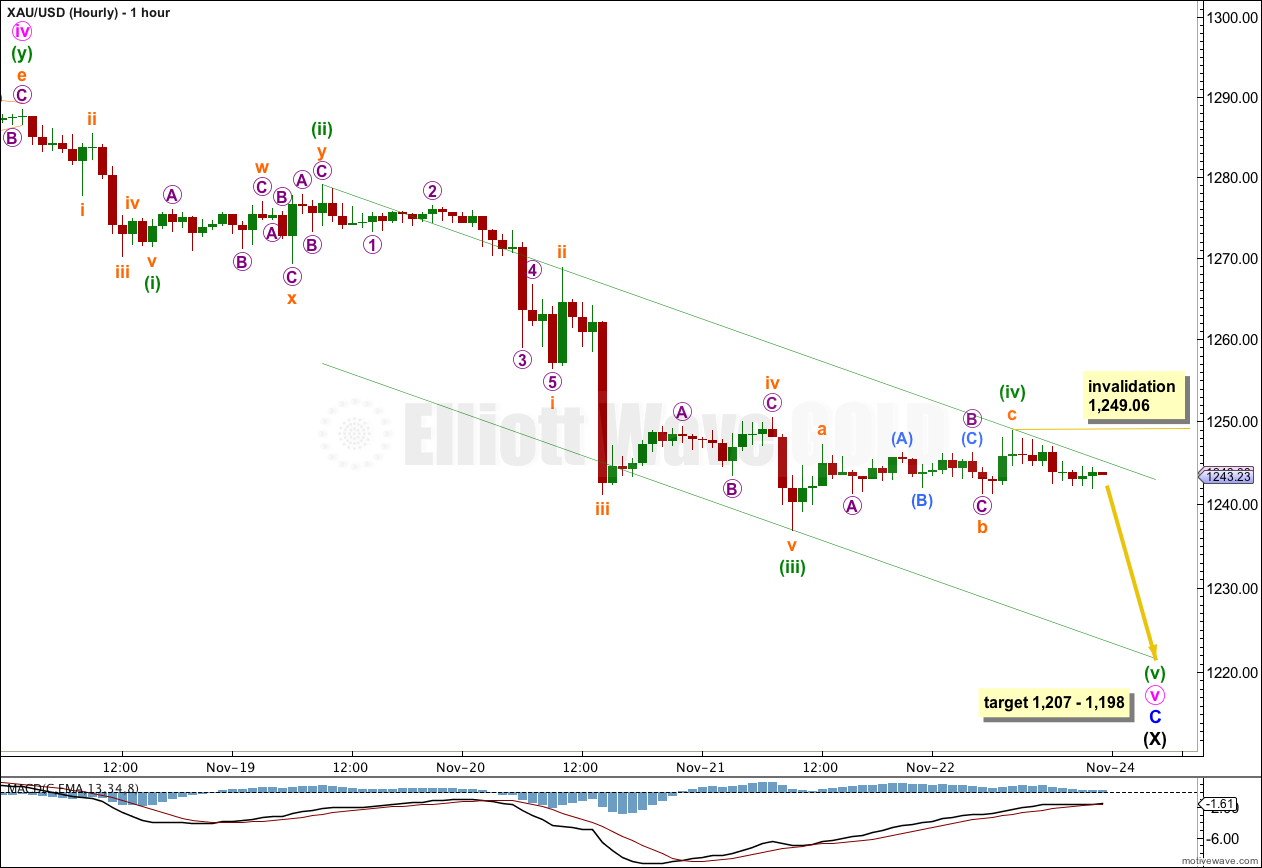
Last analysis expected a small fourth wave correction to end about 1,246.71 before we saw more downwards movement. The fourth wave correction is most likely now to be complete at 1,249.06. The next wave should unfold early next week.
The wave count remains the same.
Click on the charts below to enlarge.
Gold is still within a large fourth wave correction at primary wave degree which is incomplete. It is likely to continue as a double combination because within it intermediate wave (X) should be deep.
The purpose of double combinations is to take up time and move price sideways, so I would expect intermediate wave (Y) to end about the same level as intermediate wave (W) at 1,433.83. Double combinations in fourth wave positions are quite common.
If downwards movement reaches 1,205.74 or below then it would be 90% of the prior upwards movement labeled intermediate wave (W). At that stage I would relabel primary wave 4 as a flat correction, A-B-C rather than a combination W-X-Y.
Within the combination intermediate wave (X) is unfolding as a zigzag. Minor wave C downwards must complete as a five wave structure. At 1,206 minor wave C would reach equality in length with minor wave A. Within minor wave C at 1,198 minute wave v would reach 1.618 the length of minute wave i. Within minute wave v minuette wave (v) would be equal in length with minuette wave (iii) at 1,207. This gives a $9 target zone for downwards movement to end. I favour the upper end of the zone because it is calculated at the lowest wave degree.
There is no lower invalidation point for intermediate wave (X); X waves may make new price extremes beyond the start of W waves, and they may behave like B waves within flat corrections. For combinations X waves often end close to the start of W waves.
I have drawn a parallel channel about the zigzag of intermediate wave (X) using Elliott’s technique for a correction. Draw the first trend line from the start of minor wave A to the end of minor wave B. Place a parallel copy upon the end of minor wave A. I will expect minor wave C to find support at the lower end of this channel, and it may end there.
I have also drawn a parallel channel about minor wave C downwards using Elliott’s second technique. Draw the first trend line from the highs labeled minute waves ii and iv, place a parallel copy upon the low labeled minute wave iii. Downwards movement may find support at the lower end of this channel.
Primary wave 4 may not move into primary wave 1 price territory. This wave count is invalidated with movement above 1,532.90.
Minuette wave (iv) is now complete as a sideways shallow zigzag correction, showing alternation with minuette wave (ii). Minute wave (ii) lasted 17 hours, and minuette wave (iv) has now lasted 22 hours. They are reasonably in proportion which gives the wave count the right look.
Minuette wave (iv) broke through resistance at the upper end of the channel as it was drawn in last analysis. When fourth waves overshoot these channels then they should be redrawn using Elliott’s second technique. Draw the first trend line from the highs labeled minuette waves (ii) to (iv), then place a parallel copy upon the low labeled minuette wave (iii). I will expect minuette wave (v) to most likely end about the lower edge of this channel, and it should find resistance there.
I would expect minuette wave (v) to take one to two days to complete.
At this stage I expect it is extremely likely that minuette wave (iv) is over and that minuette wave (v) began at the end of Friday. However, if price moves above the invalidation point on the hourly chart (before making a new low) then it is just possible that minuette wave (iv) is continuing further sideways as a bigger flat correction. That would see minuette waves (ii) and (iv) quite out of proportion though, and although this is possible it has a low probability. If the invalidation point at 1,249.06 is breached on Monday then it must move back up to 1,270.14 because minuette wave (iv) may not move into minuette wave (i) price territory.
What is most likely is that minuette wave (v) has begun. Within it no second wave correction may move beyond the start of its first wave. This wave count is invalidated with movement above 1,249.06.


she is showing spike i think of 1206 to 1198. 88% will be completed on 1218
Lara,why do you show the price wave turning up at about 1218 when your stated target is 1206 to 1198?
The point I place the labels on is the place where they sit most easily when I prepare the charts. If I were to place them at the price point I expect a turn I would have to squish the chart up and show less of the structure of primary wave 4.
Please look at the price points given as targets, don’t look at where I place the labels. Also, use the channels.