
Price has moved lower. I had expected it a little, but I had not expected it to be this slow.
The situation at this stage is unclear. I have looked for alternates for you, including a bullish alternate which sees a trend change at 1,211.83 five days ago.
I have several charts for you today with differing probabilities.
Click on the charts below to enlarge.
Main Wave Count.
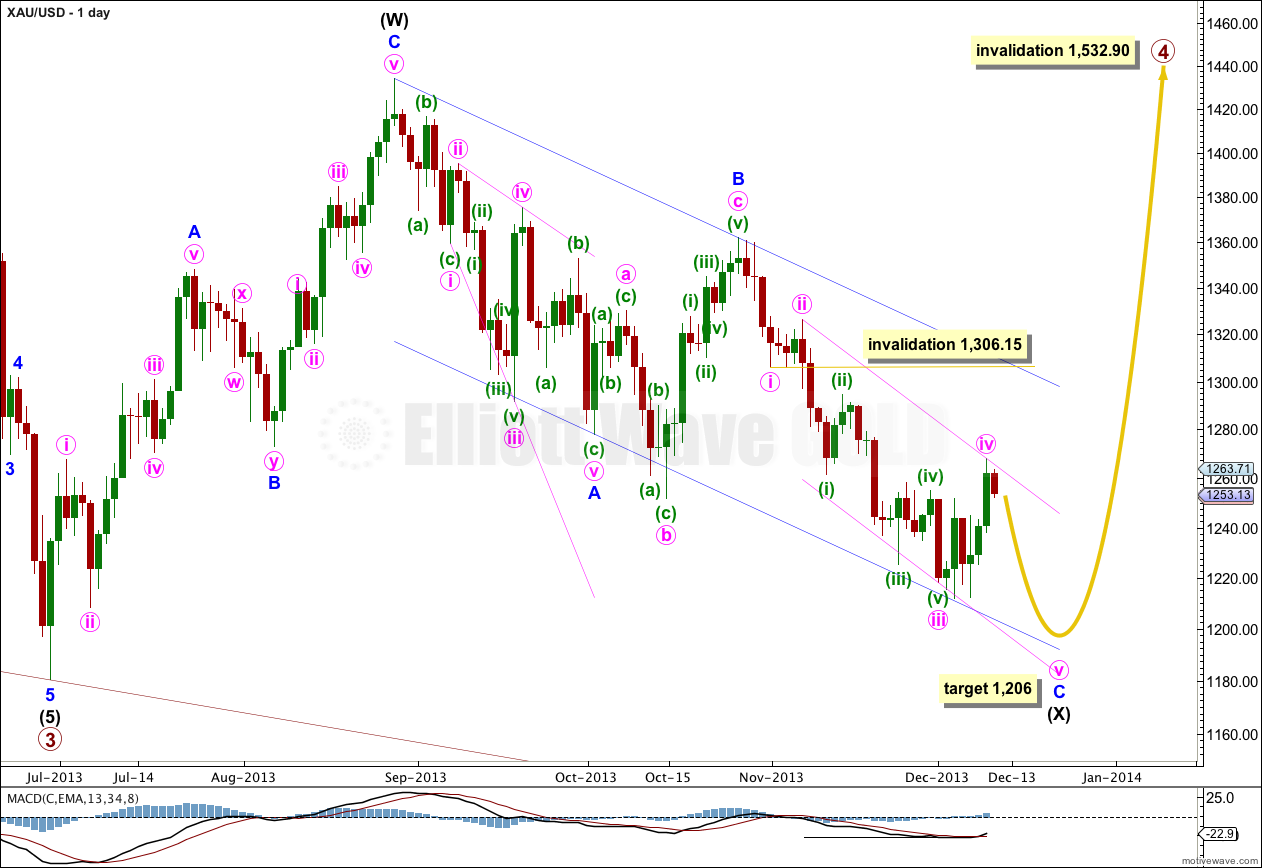
Gold is still within a large fourth wave correction at primary wave degree which is incomplete. To see a full explanation of my reasoning for expecting that primary wave 4 is not over and is continuing see this.
Primary wave 2 was a rare running flat correction, and was a deep 68% correction of primary wave 1. In order to show alternation in structure primary wave 4 may be a zigzag, double zigzag, combination, triangle or even an expanded or regular flat. We can rule out a zigzag because the first wave subdivides as a three. This still leaves several structural possibilities.
If primary wave 4 is a combination, expanded flat or running triangle then we may see a new low below 1,180.40 within it. This is why there is no lower invalidation point for intermediate wave (X).
If price reaches 1,205.74 then downwards movement labeled intermediate wave (X) would be 90% of upwards movement labeled intermediate wave (W). I would relabel primary wave 4 as an A-B-C flat correction. If price does not reach 1,205.74 then primary wave 4 is most likely a double combination.
Within intermediate wave (X) zigzag downwards minor wave C has an extended third wave which is now complete. So far a count of minor wave C gives a count of eight, and one more downwards wave is required to complete an impulsive wave, with a count of nine.
Redraw the parallel channel about minor wave C downwards with the first trend line from the highs labeled minute waves ii to iv, then place a parallel copy upon the low labeled minute wave iii. As minute wave iv moves a little higher redraw the channel. The lower edge may be where minute wave v ends.
I would expect downwards movement to also find support at the lower edge of the parallel channel drawn here about intermediate wave (X).
Draw a parallel channel about the zigzag of intermediate wave (X): draw the first trend line from the start of minor wave A to the end of minor wave B, then place a parallel copy upon the end of minor wave A. When this channel is finally breached by upwards movement then I would consider that final confirmation that intermediate wave (Y) is underway.
Primary wave 4 may not move into primary wave 1 price territory. This wave count is invalidated with movement above 1,532.90.
First Hourly Chart For Main Wave Count.
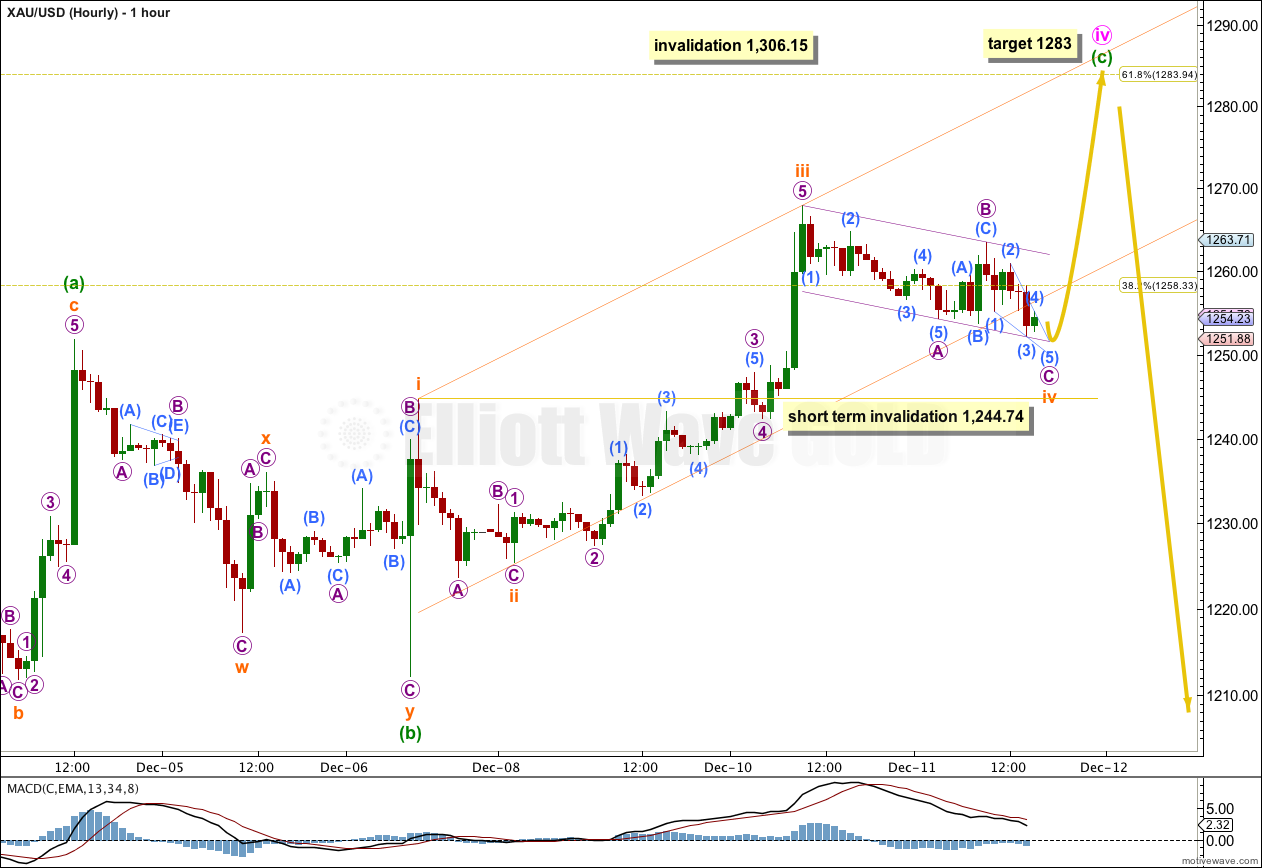
Minute wave ii was a shallow 36.5% regular flat correction. Given the guideline of alternation it would be reasonable to see minute wave iv a deep 61.8% correction (or thereabouts). If this one is an expanded flat ending about 1,283 then it would achieve alternation in structure and depth.
Minute wave iv does not look like a combination because those move price sideways. This one is trending upwards.
Within minute wave iv minuette wave (b) is a 117% correction of minuette wave (a). Minuette wave (c) passed 1.618 the length of minuette wave (a) at 1,267. Minuette wave (c) may not exhibit a Fibonacci ratio to minuette wave (a).
At this stage the best way to see where upwards movement may end should be the parallel channel about minuette wave (c), and the target at the 0.618 Fibonacci ratio.
This parallel channel is drawn using Elliott’s first technique about minuette wave (c). Draw the first trend line from the highs of subminuette waves i to iii, place a parallel copy upon the low of subminuette wave ii. Subminuette wave iv has now just broken through support at the lower edge of the channel. When it is complete the channel may be redrawn using Elliott’s second technique: draw the first trend line from the lows of subminuette waves ii to iv, then place a parallel copy upon the high of subminuette wave iii.
I would expect subminuette wave v to find resistance at the upper edge of the channel.
Minute wave iv may not move into minute wave i price territory. This wave count is invalidated with movement above 1,306.15.
Second Hourly Chart For Main Wave Count.
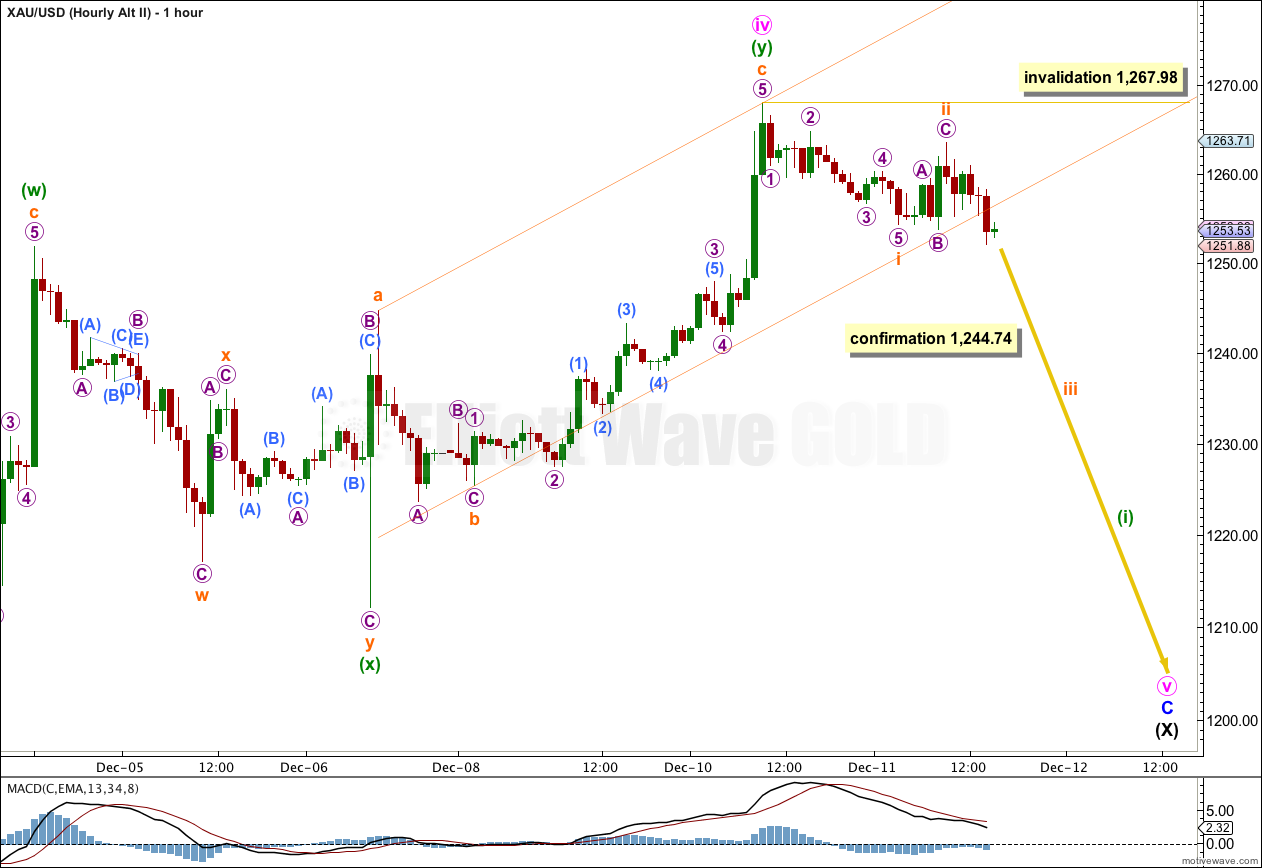
There is something a bit “off” about this structure for gold so far, and so I am considering less likely possibilities. The correction for minute wave iv has already lasted seven days, which is longer than the maximum four days for other corrections within minor wave C. I have looked at the possibility that it could have been over in six days.
If minute wave iv is over at 1,267.98 then it can only subdivide as a double combination. But this structure is atypical. The purpose of combinations is to take up time and move price sideways, so the first and second structures labeled waves W and Y usually end about the same level. This is not the case here as this structure moves sharply in a corrective direction with minuette wave (y) 16.14 above the end of minuette wave (w).
I would judge this wave count to have a low probability. But is is possible.
Movement below 1,244.74 would invalidate the main hourly wave count and confirm this alternate. At that stage I would have some confidence that minute wave iv is over and minute wave v to new lows is underway.
Within minute wave v no second wave correction may move beyond the start of the first wave. This alternate is invalidated with movement above 1,267.98.
Alternate Daily Wave Count – Bullish.
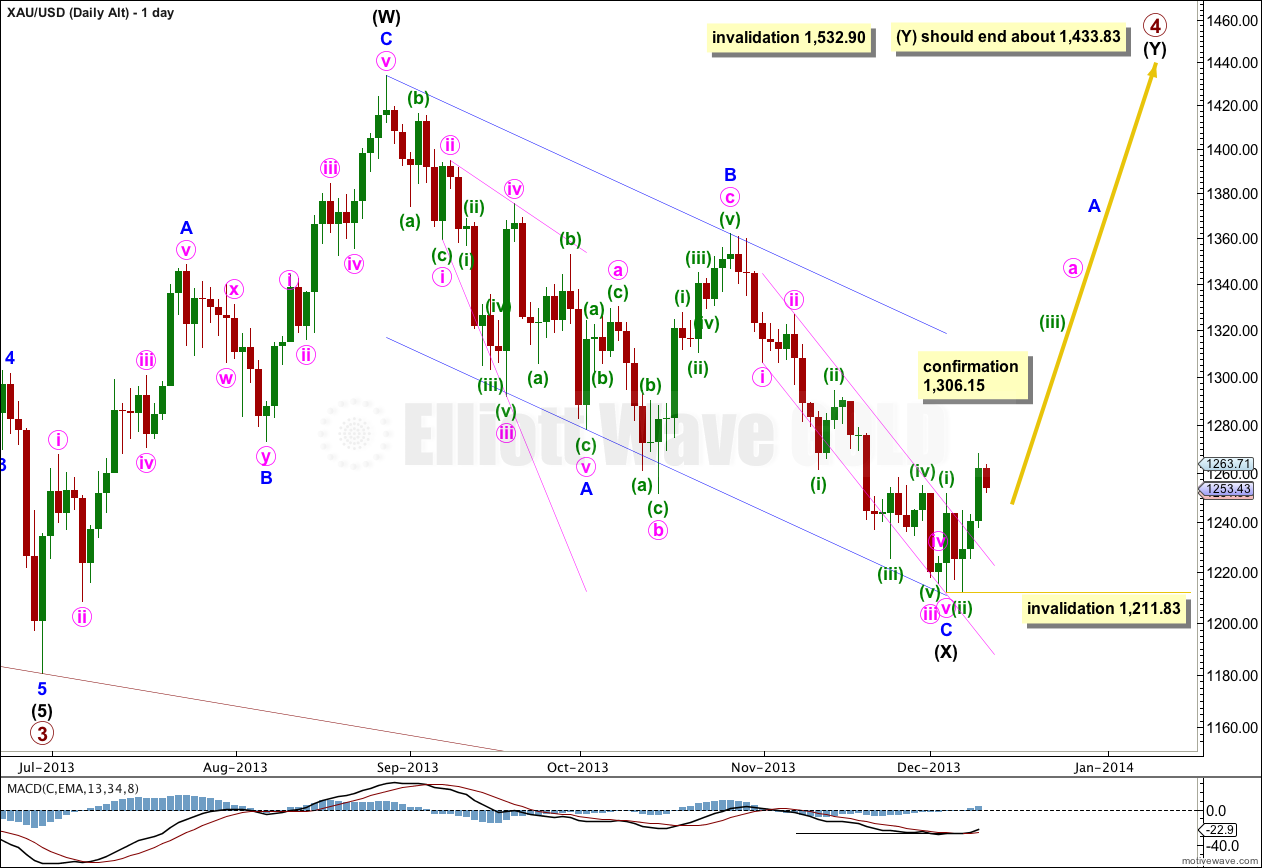
It has been suggested that Gold could have turned back up already at 1,211.83 five days ago. If that is the case then minor wave C downwards must be a completed five wave impulse. The only other structural possibility for minor wave C is an ending diagonal, which is clearly is not.
The problem with this wave count is the structure of minor wave C. It has a best fit count of eight so far, and does not fit well as a completed impulse. This would see minute wave iv as lasting only one day and minute wave v extremely short.
Within minor wave C there is no Fibonacci ratio between minute waves iii and i, and minute wave v is 1.31 short of 0.146 the length of minute wave iii.
However, downwards movement found support at the lower edge of the blue channel and bounced up from there. This could be an indication that this wave count is correct as C waves often end at the edge of these channels.
A channel drawn about minor wave C using Elliott’s first technique is clearly breached by upwards movement. This may also be an indication that this wave count is correct. (Although fourth waves do not always end in these channels which is why Elliott developed a second technique to use when they breach the channel).
Minor wave C would be only 5.78 short of equality with minor wave A.
Overall my biggest problem with this wave count is trying to see minute wave iv as over so quickly. But excellent ratios and turns at trend lines suggest this may be the case.
If intermediate wave (X) is over then primary wave 4 cannot be a flat correction, and so is most likely to be a combination. This would expect intermediate wave (Y) to most likely be a flat, but it also may be a triangle. It would most likely end about the same level as intermediate wave (W) at 1,433.83.
Intermediate wave (Y) should last several weeks. A triangle would be longer lasting than a flat.
Primary wave 4 may not move into primary wave 1 price territory. This wave count is invalidated with movement above 1,532.90.
Within the first wave up of intermediate wave (Y) no second wave correction may move beyond the start of its first wave. This wave count is invalidated with movement below 1,211.83.
Alternate Daily Wave Count – Triangle.
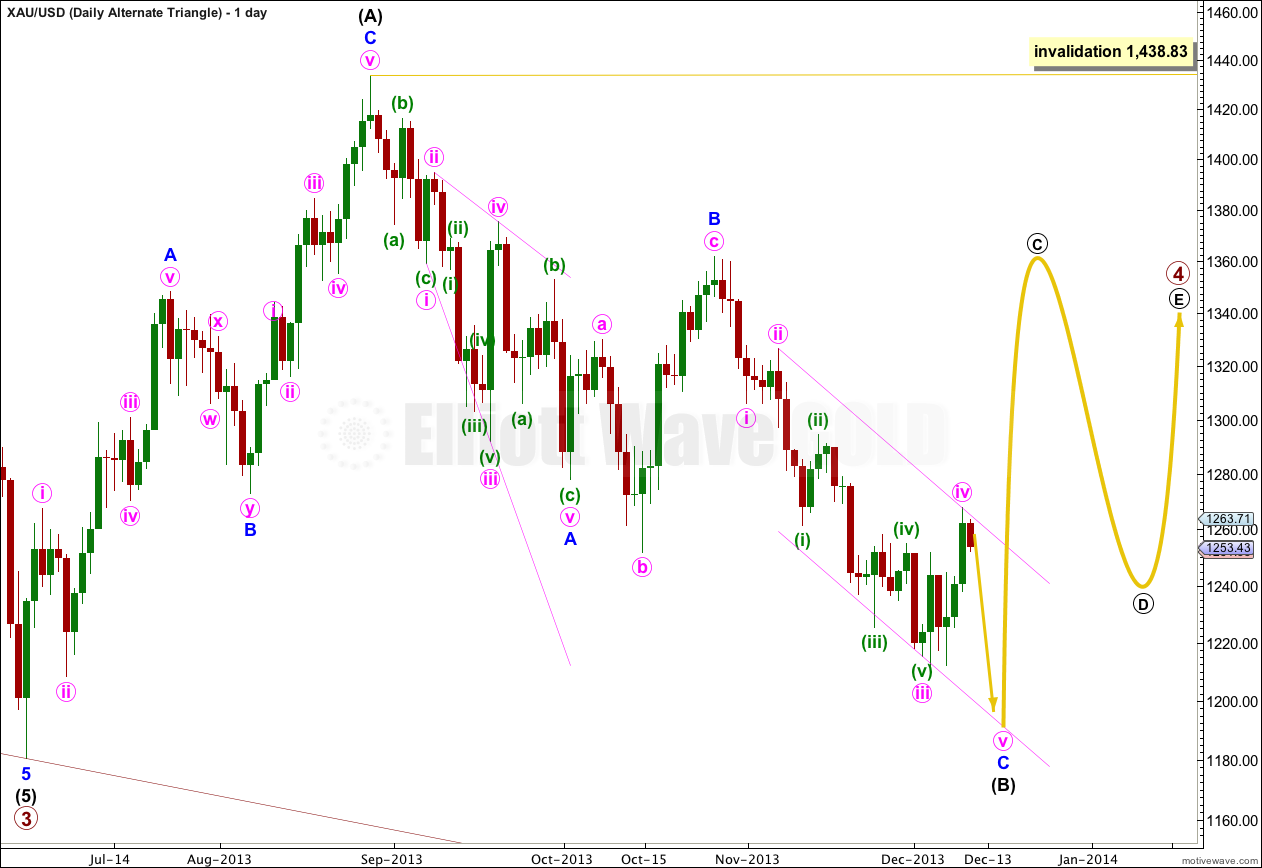
It is also possible that primary wave 4 may continue as a regular contracting (or barrier) triangle.
The expected direction and structure of this next upwards wave is the same, but for this alternate intermediate wave (C) of the triangle may not move beyond the end of intermediate wave (A). The triangle is invalidated with movement above 1,438.83.
The final intermediate wave (E) upwards may not move above the end of intermediate wave (C) for both a contracting and barrier triangle. E waves most commonly end short of the A-C trend line.
All five subwaves of a triangle must divide into corrective structures. If this next upwards movement subdivides as a zigzag which does not make a new high above 1,438.83 then this alternate would be correct.
Triangles take up time and move price sideways. If primary wave 4 unfolds as a triangle then I would expect it to last months rather than weeks.