
I had expected a little more downwards movement to complete a small second wave correction. Price did move lower to complete the correction, but it moved higher first. Downwards movement is finding strong support at the lower edge of the parallel channel as expected.
Summary: Upwards momentum should increase. The short term target at 1,297 may be met within about four days.
Click on the charts below to enlarge.
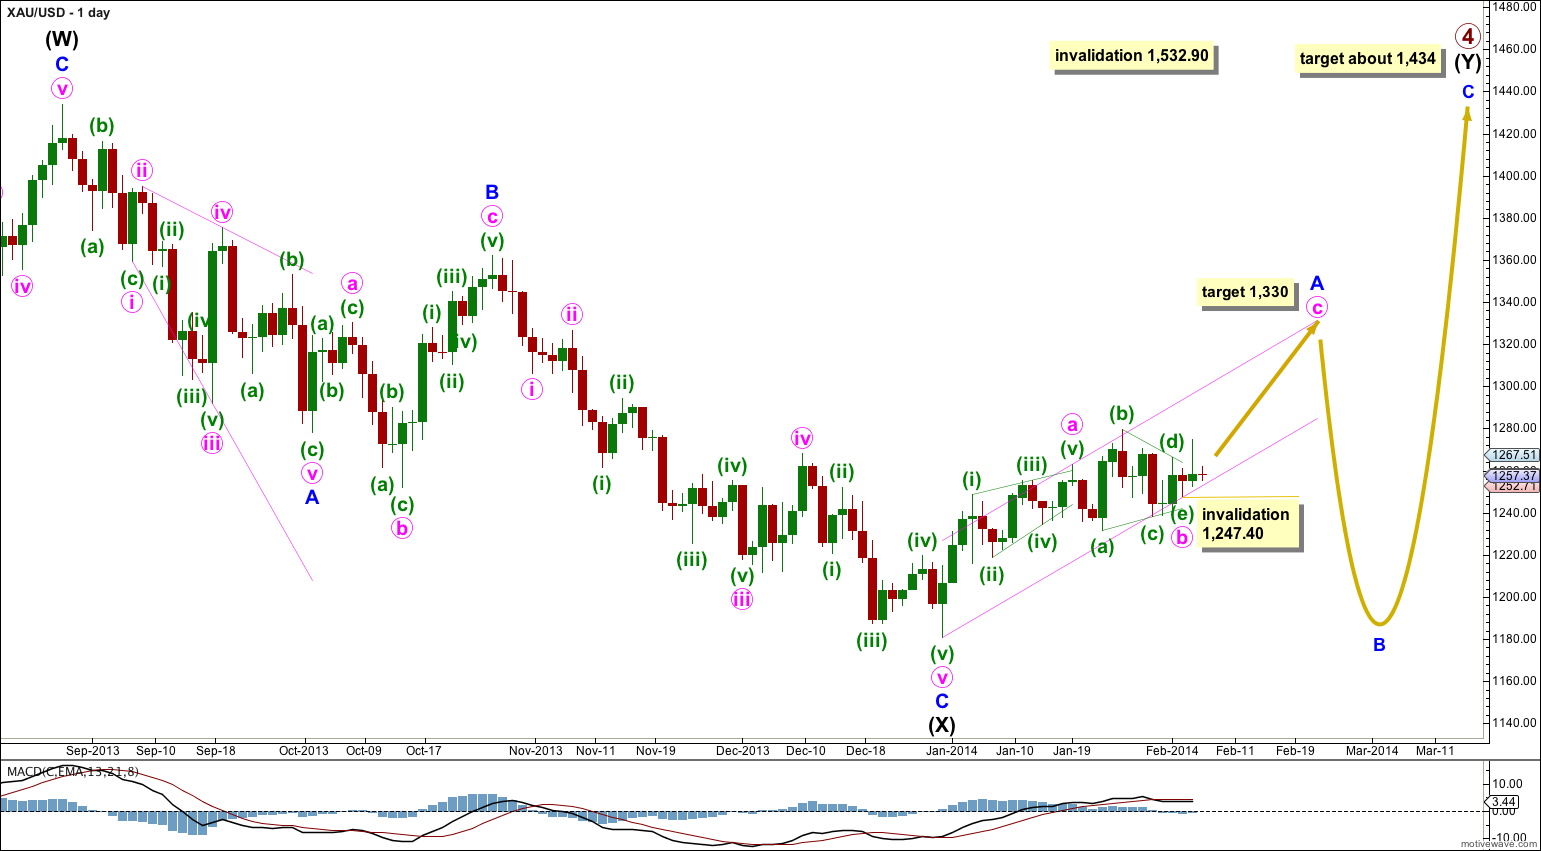
Gold is still within a large fourth wave correction at primary wave degree which is incomplete. To see a full explanation of my reasoning for expecting that primary wave 4 is not over and is continuing see this.
Movement above 1,277.97 has provided confirmation that primary wave 4 is not over. This upwards movement cannot be a fourth wave correction within primary wave 5 as it has now moved into what would be its counterpart first wave price territory. The wave down from the high labeled intermediate wave (W) to the low labeled intermediate wave (X) is now confirmed as a three wave structure. Primary wave 5 cannot subdivide as a three, it can only subdivide as a five.
Primary wave 2 was a rare running flat correction, and was a deep 68% correction of primary wave 1. In order to show alternation in structure primary wave 4 may be a zigzag, double zigzag, combination, triangle or even an expanded flat. We can rule out a zigzag because the first wave subdivides as a three. This still leaves several structural possibilities.
Primary wave 4 is most likely to be a combination or triangle in order to show structural alternation with the running flat of primary wave 2.
The downwards wave labeled intermediate wave (X) is 99% the length of the upwards wave labeled intermediate wave (W). Primary wave 4 is unlikely to be a flat correction because if it were it would be a regular flat. These have similar behaviour and a similar look to running flats, and so there would be little structural alternation between primary waves 2 and 4.
Primary wave 4 is most likely to be a combination rather than a double zigzag because of the depth of intermediate wave (X). Double combinations take up time and move price sideways, and their X waves can be very deep. Double zigzags are different because their purpose is to deepen a correction when the first zigzag does not move price deep enough, so their X waves are not normally very deep. Thus intermediate wave (Y) is most likely to be a flat correction, less likely a triangle and least likely a zigzag. It is most likely to end about the same level as intermediate wave (W) at 1,434 so that the whole structure moves sideways. It may last about 43 to 89 days, depending upon what structure it takes.
If intermediate wave (Y) is a flat correction then within it minor wave B must retrace a minimum of 90% the length of minor wave A, and it may make a new low below 1,180.84.
If intermediate wave (Y) is a flat correction then within it minor wave A must subdivide as a three wave structure. At this stage minor wave A is unfolding as a zigzag because minute wave a within it completed as a leading diagonal which is a five wave structure. At 1,330 minute wave c would reach equality in length with minute wave a.
Primary wave 4 may not move into primary wave 1 price territory. This wave count is invalidated with movement above 1,532.90.
Draw a channel about the zigzag of minor wave A: draw the first trend line from the start of minute wave a to the end of minute wave b, then place a parallel copy upon the end of minute wave a.
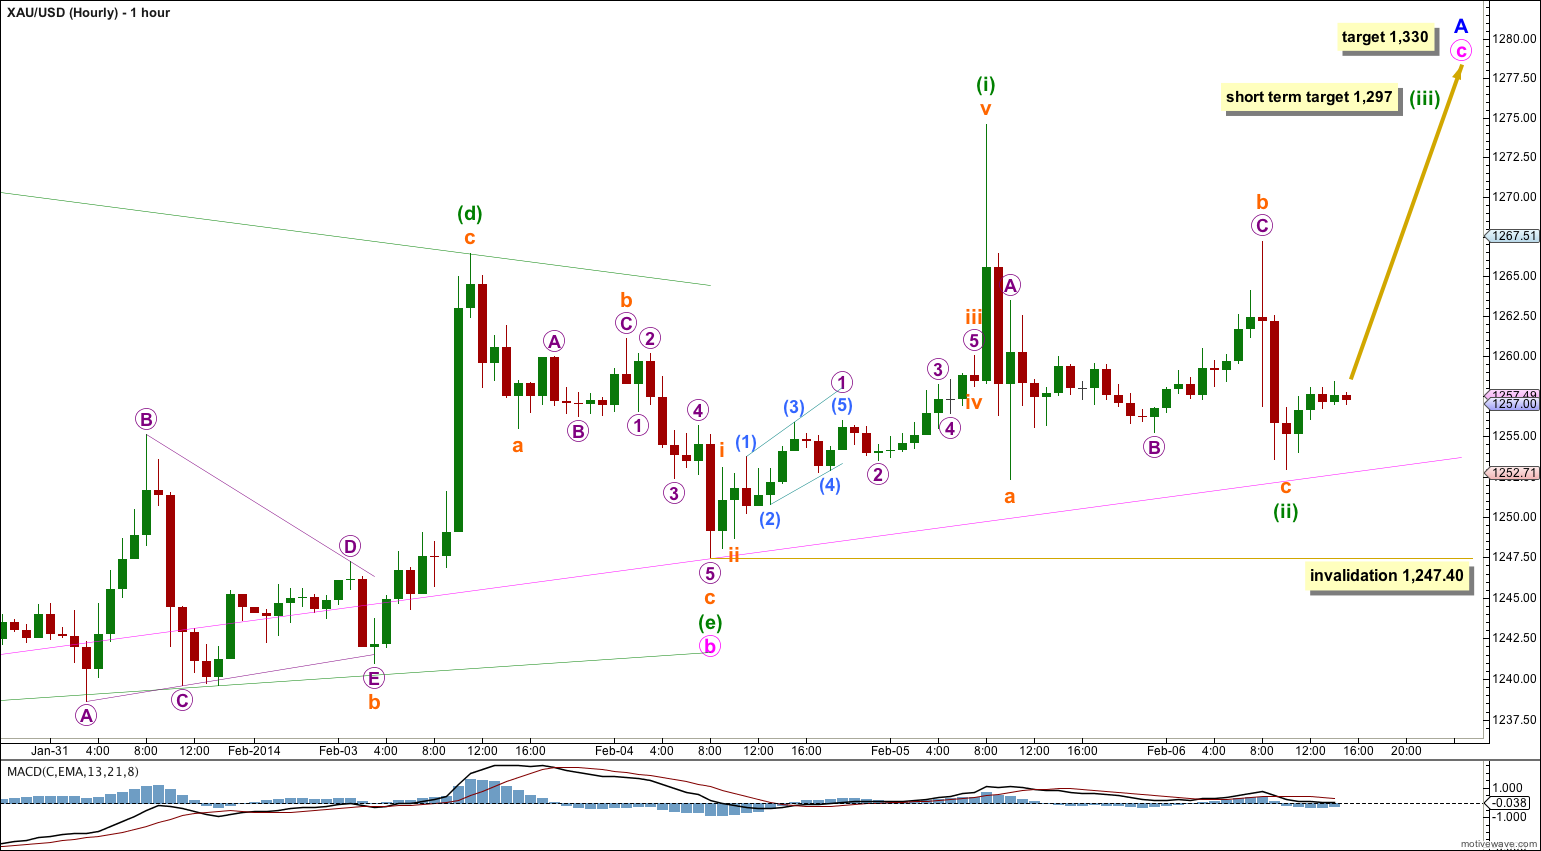
I have moved the degree of labeling within this new upwards movement up one degree today. I have done this because within minute wave c I would expect minuette waves (ii) and (iv) to show on the daily chart, but not corrections one degree lower. Thursday’s session is a red doji on the daily chart and so it shows clearly there, so it is most likely minuette wave degree. This makes no difference at this stage to the expected direction, next structure, invalidation point or target.
The zigzag for minuette wave (ii) has a slightly truncated subminuette wave c. Downwards movement is finding strong support at the lower edge of the parallel channel and this may have forced a truncation. Subminuette wave c is 0.55 longer than 0.618 the length of subminuette wave a.
At 1,297 minuette wave (iii) would reach 1.618 the length of minuette wave (i). If minuette wave (iii) is extended then within it the corrections for subminuette waves ii and iv should show clearly on the hourly chart, and may also show on the daily chart. This would make minuette wave (iii) more time consuming. It may last about four days or so.
Minuette wave (ii) may not move beyond the start of minuette wave (i). This wave count is invalidated with movement below 1,247.40.
Alternate Daily Wave Count – Triangle.
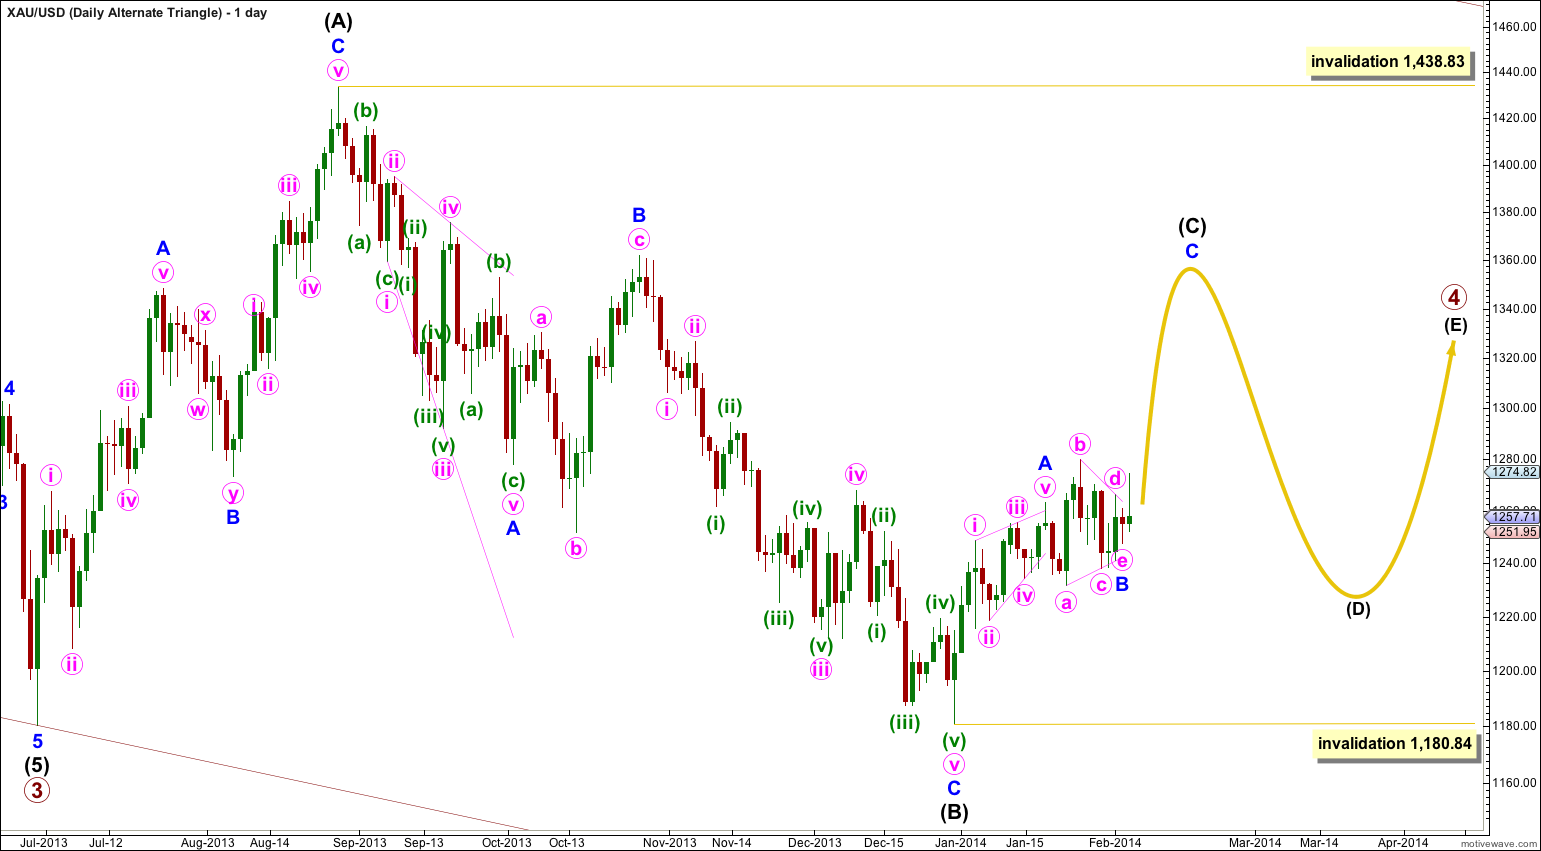
It is also possible that primary wave 4 may continue as a regular contracting (or barrier) triangle.
The expected direction of this next upwards wave is the same, but for this alternate intermediate wave (C) of the triangle may not move beyond the end of intermediate wave (A). The triangle is invalidated with movement above 1,438.83.
Intermediate wave (C) must unfold as either a single or double zigzag. Within it no second wave correction, nor wave B of the zigzag, may move beyond the start of the first wave or A wave. This wave count is invalidated with movement below 1,180.84.
The final intermediate wave (E) upwards may not move above the end of intermediate wave (C) for both a contracting and barrier triangle. E waves most commonly end short of the A-C trend line.
All five subwaves of a triangle must divide into corrective structures. If this next upwards movement subdivides as a zigzag which does not make a new high above 1,438.83 then this alternate would be correct.
Triangles take up time and move price sideways. If primary wave 4 unfolds as a triangle then I would expect it to last months rather than weeks.