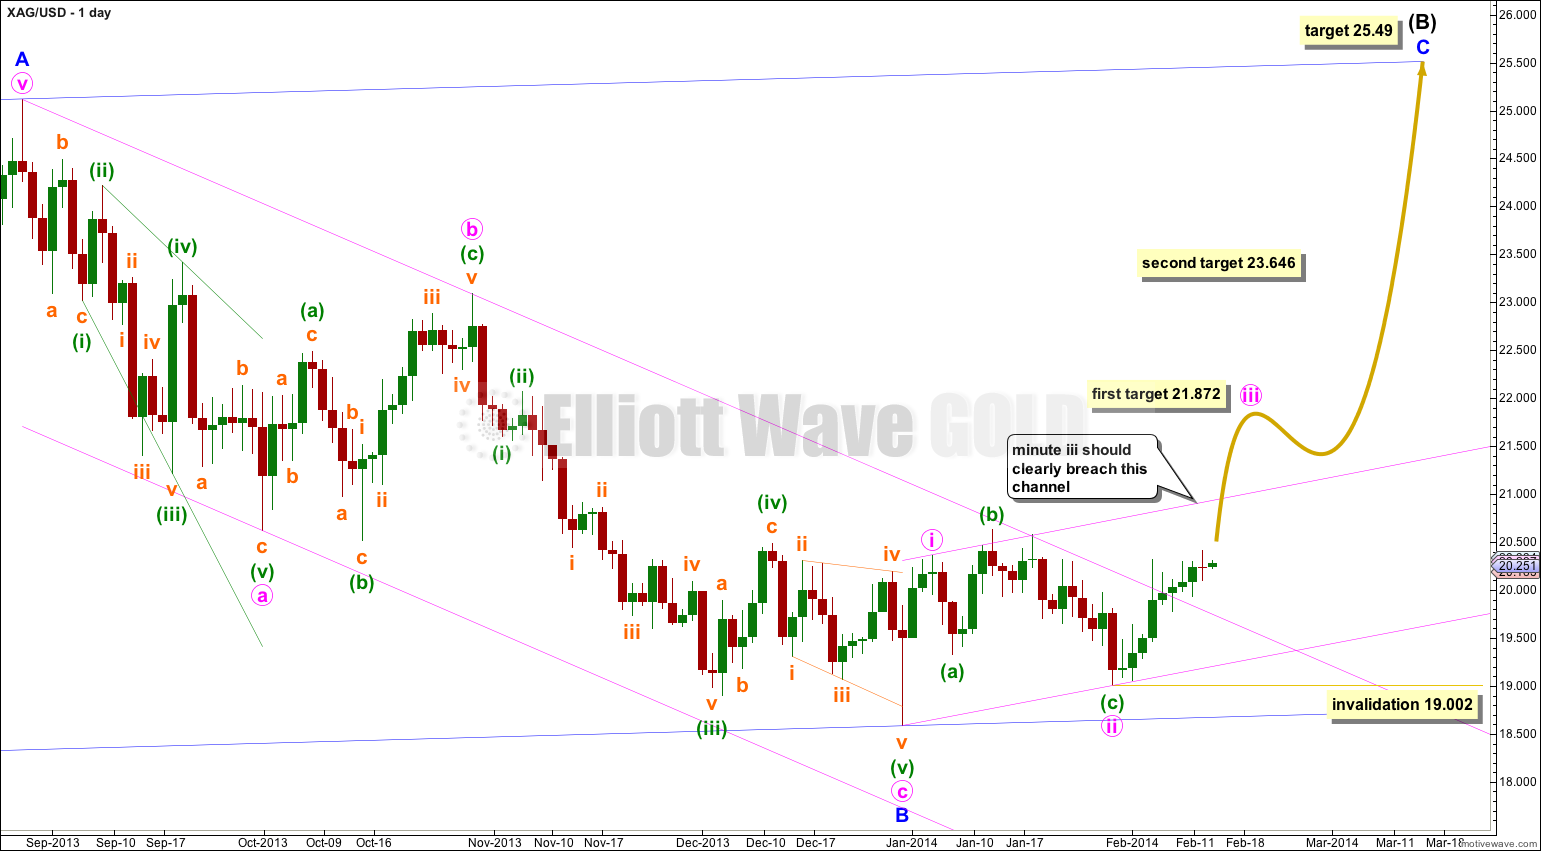
Last analysis expected Silver to continue upwards which is what has happened. The channel on the daily chart was clearly breached on 9th February providing final trend channel confirmation that Silver has turned upwards.
Click on the charts below to enlarge.
I expect that Silver is in an upwards trend which should last several weeks to a couple of months or so. The final target for this trend to end remains the same. At 25.49 minor wave C would reach equality in length with minor wave A.
Minor wave C may end about the upper edge of the parallel channel containing the zigzag of intermediate wave (B).
At this stage within minor wave C minute waves i and ii may be complete. Minute wave iii upwards must subdivide as a simple impulse. Minute wave iii should clearly breach the upwards sloping acceleration channel containing minute waves i and ii.
At 21,872 minute wave iii would reach 1.618 the length of minute wave i. If upwards movement keeps going through this first target, or if when it gets there the structure of minute wave iii is incomplete then I would use the second target. At 23.646 minute wave iii would reach 2.618 the length of minute wave i.
When minute wave iii is complete then I would expect downwards movement for minute wave iv to last about three weeks.
Minute wave iii has so far lasted ten days. If it exhibits a Fibonacci time relationship it may end in another three days totaling a Fibonacci thirteen. But that looks unlikely.
The next Fibonacci time relationship would see minute wave iii end in another eleven days, totaling a Fibonacci 21. This looks more likely at this stage.
Within minute wave iii no second wave correction may move beyond the start of its first wave. This wave count is invalidated with movement below 19.002.
At this stage although I keep a wave count at the hourly chart (and five minute) levels I am not confident of my wave counts there and so I will not publish my hourly chart. There is a lot of overlapping in recent upwards movement. My conclusion based upon experience is that this third wave should exhibit a clear and strong increase in upwards momentum, the overlapping should cease for a time, before a series of fourth and fifth waves finally move price towards the targets.
When I am confident of my analysis at the hourly chart level then I will publish it.


I guess the equivalent in EW of the traditional technical descending triangle, would be a diagonal.
No. I do not think Silver or Gold are forming diagonals.
It is possible for Gold that it is forming a huge sideways contracting triangle, in which case Silver would be forming a slightly upwards sloping diagonal.
Hi lara.Is there any possibility that silver and gold are forming a descending triangle?IMO this could very easily be wave c with target being 22.48 approx in the case of silver.Thanks in advance and keep up the good work.
To be honest I don’t trust the data. I’ve noticed some odd things over the years. The data for the Silver and Gold cash markets should be the same no matter which source you use, but it is not. Which I think is rather dodgy.
However, over the years using this data feed I have not seen a movement on either of these markets which does not conform to an Elliott wave structure. The data is good enough for me to use Elliott wave to predict direction and sometimes get targets right.
I really have no idea if a Comex Future chart would be better, but I suspect not. If the volume there is less than the data I’m using then I’d go with the highest volume.
hi Lara,
As always, Congratulations for the fantastic work!
I just have one doubt… SIlver (Spot) chart vary on different trading softwares. I assume this is because of their data collection source. How do you trust one particular chart then? Also isn’t it better to look at Comex Future chart instead?