
Again, downwards movement was expected. The first target has not yet been reached.
Summary: Momentum has still not shown an increase, but the third wave has still not yet reached its middle. I expect strong downwards momentum for the next day or so. The short term target for the next correction is recalculated at 1,262. The trend is down.
This analysis is published about 04:10 p.m. EST. Click on charts to enlarge.
Main Wave Count.
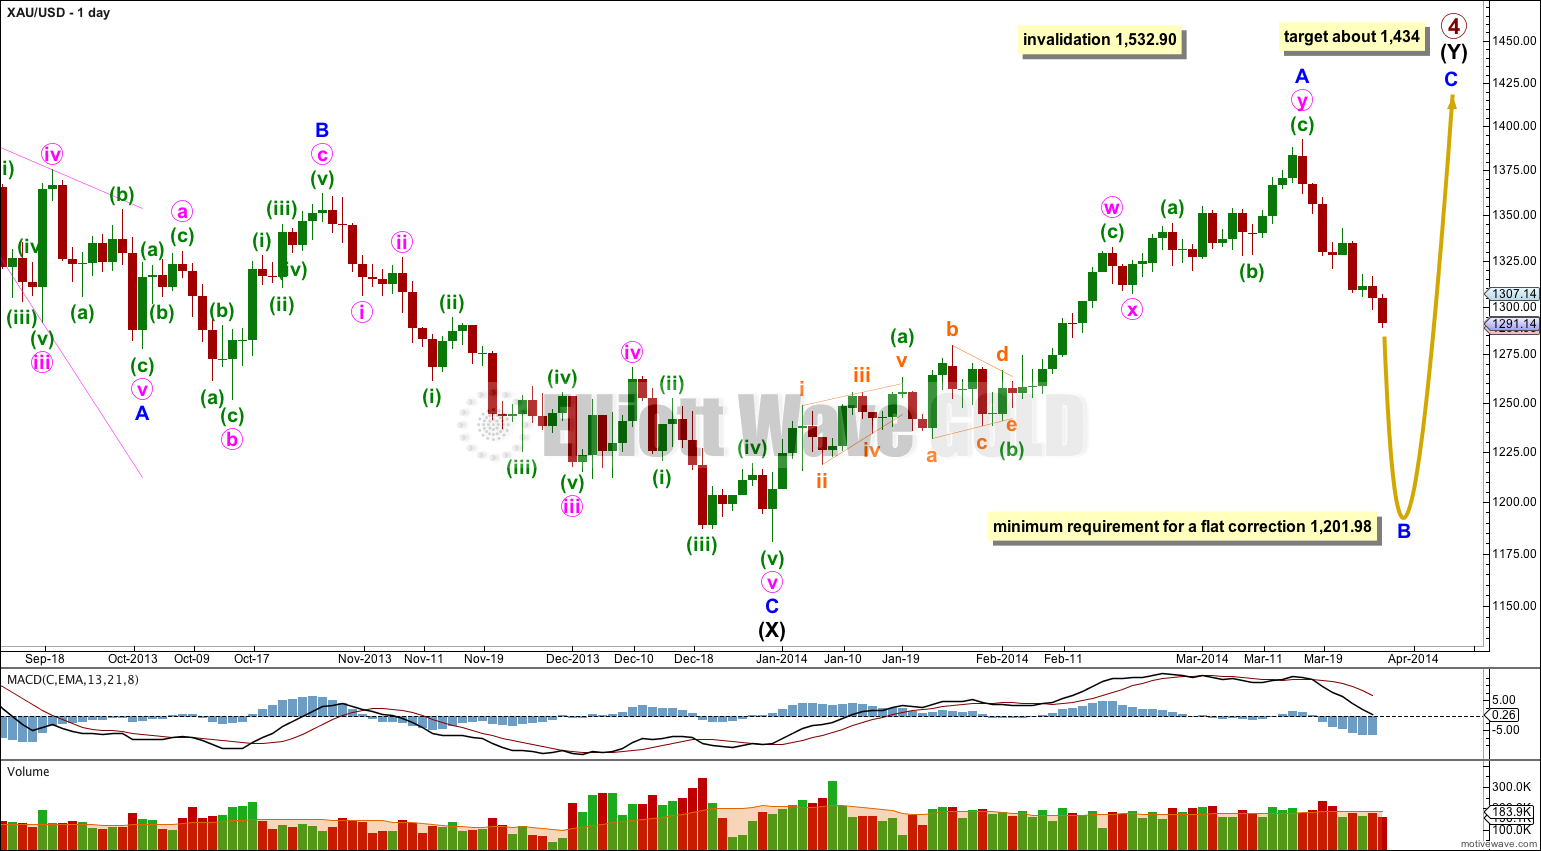
Gold is still within a large fourth wave correction at primary wave degree which is incomplete.
Primary wave 2 was a rare running flat. Primary wave 4 is unlikely to be a flat correction because it is likely to show structural alternation with primary wave 2.
The first upwards wave within primary wave 4 labeled intermediate wave (W) subdivides as a three wave zigzag. Primary wave 4 cannot be an unfolding zigzag because the first wave within a zigzag, wave A, must subdivide as a five.
Primary wave 4 is unlikely to be completing as a double zigzag because intermediate wave (X) is a deep 99% correction of intermediate wave (W). Double zigzags commonly have shallow X waves because their purpose it to deepen a correction when the first zigzag does not move price deep enough.
Primary wave 4 is most likely to be completing as a double combination: zigzag – X – second structure. The second structure labeled intermediate wave (Y) may be either a flat or a triangle. For both these structures minor wave A must be a three.
Primary wave 4 may not move into primary wave 1 price territory. This wave count is invalidated with movement above 1,532.90.
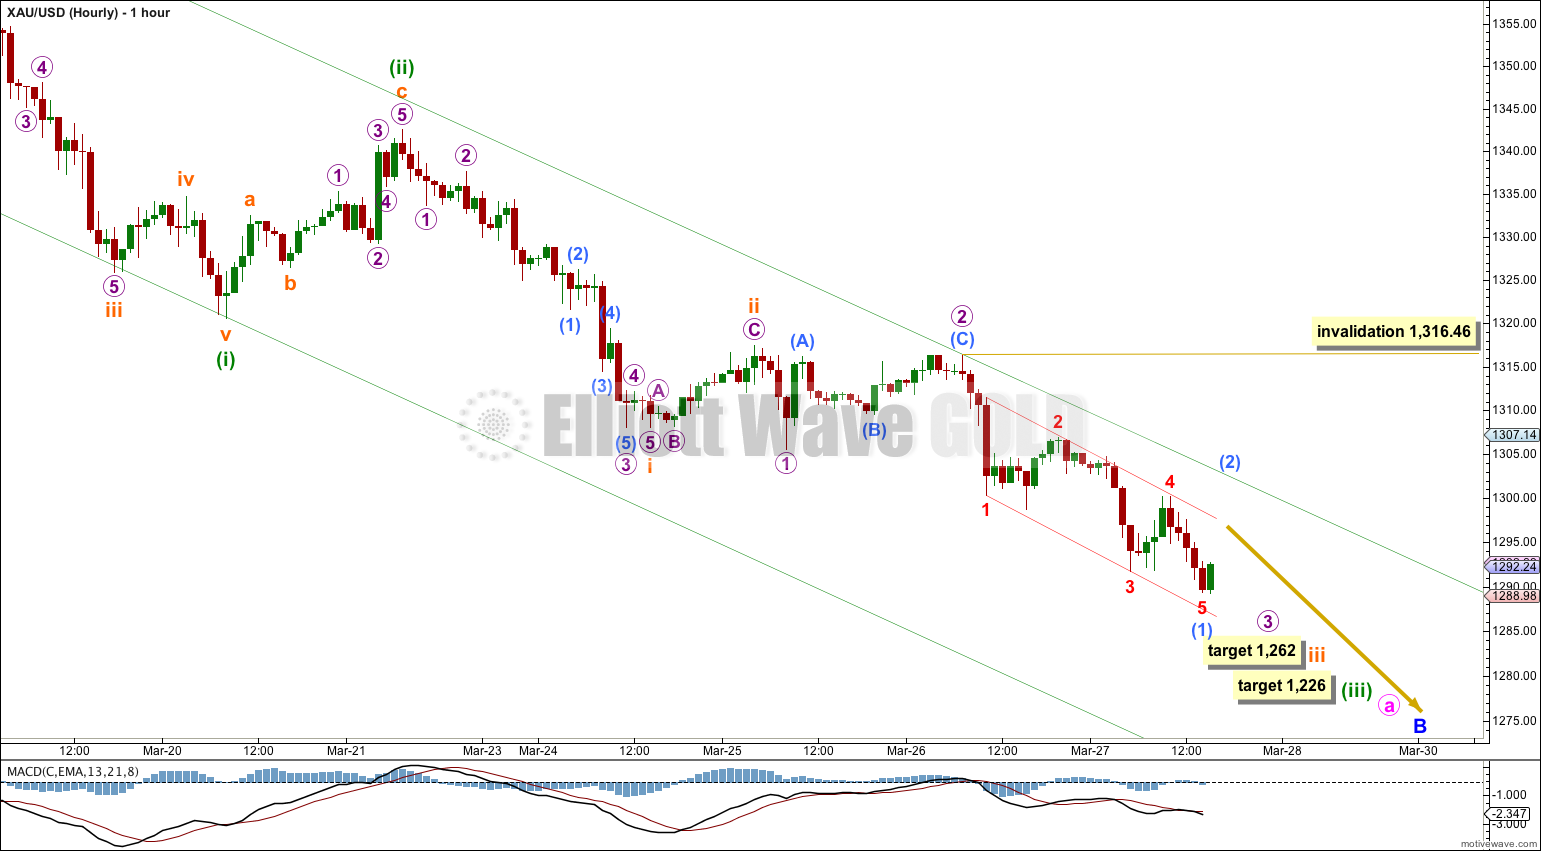
There are more than thirteen possible corrective structures that minor wave B may take. It is most likely to be a zigzag. Within a zigzag minute wave a must subdivide as a five wave motive structure, either a leading diagonal or an impulse. This downwards movement so far is clearly not a diagonal and it may be an impulse.
This main hourly wave count follows the most likely structure of a zigzag for minor wave B.
Minuette wave (iii) is extending and its second wave for subminuette wave ii shows on the daily chart as a green candlestick. This is typical for Gold and this wave count has the “right look” for Gold.
I have adjusted the labeling within minuette wave (iii) which affects targets. The targets previously calculated were too high, and the first one is almost met but the structure is incomplete.
Subminuette wave iii is also extending. I expect it ended earlier at 1,317.47 which corresponds to the end of the green candlestick on the daily chart for it. This resolves the problem of proportion between subminuette wave ii and minuette wave (ii) which the prior wave count had. However, there is now a problem of proportion with micro wave 2 and subminuette wave ii. It is not a big enough difference to give me cause for concern though as the wave count overall still has the “right look”.
At 1,262 subminuette wave iii would reach 1.618 the length of subminuette wave i. When subminuette wave iii moves towards its middle we should see downwards momentum increase strongly.
Subminuette wave iv should show up on the daily chart as a green candlestick, or maybe a small green doji.
At 1,226 minuette wave (iii) would reach 1.618 the length of minuette wave (i). Minuette wave (iv) should show on the daily chart as at least one green candlestick.
The green trend channel is redrawn as a best fit.
The small red channel is drawn about submicro wave (1). This channel should be breached by the next small upwards correction for submicro wave (2) which should then find resistance at the upper edge of the green channel.
Submicro wave (2) may not move beyond the start of submicro wave (1). This wave count is invalidated with movement above 1,316.46.
Alternate Hourly Wave Count.
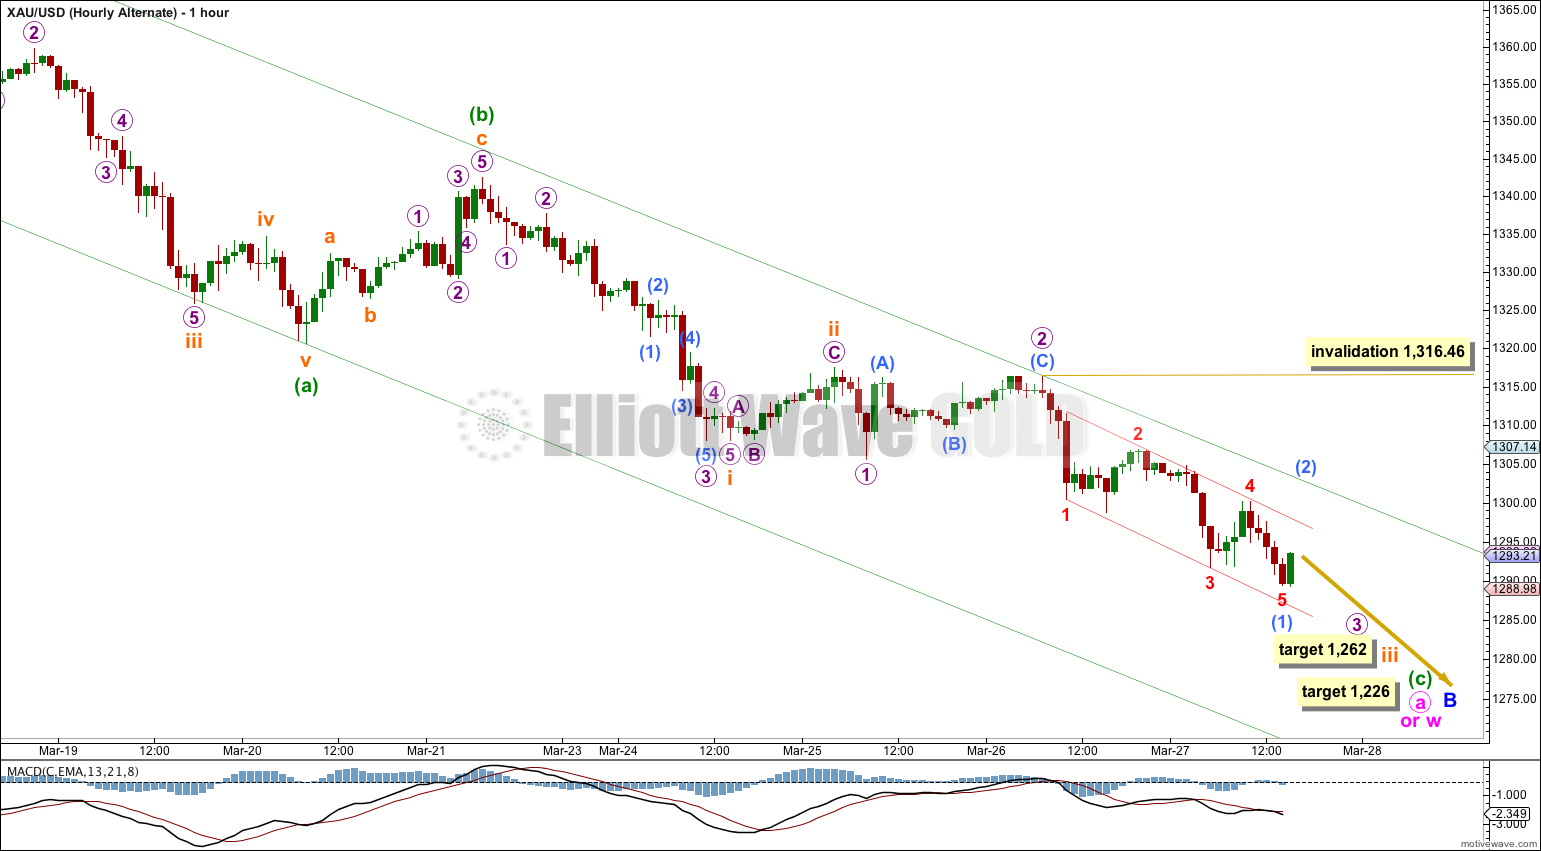
If minor wave B is a flat (or a combination with a flat as the first structure) then minute wave a (or w) within it must subdivide as a three. Minute wave a (or w) for this alternate is seen as an incomplete zigzag.
This alternate wave count again does not diverge from the main wave count above, because 1-2-3 and A-B-C have exactly the same subdivisions when the correction is a zigzag.
When the currently unfolding impulse downwards labeled here as minuette wave (c) may again be considered complete then this alternate will again diverge from the main wave count.
Alternate Daily Wave Count – Triangle.
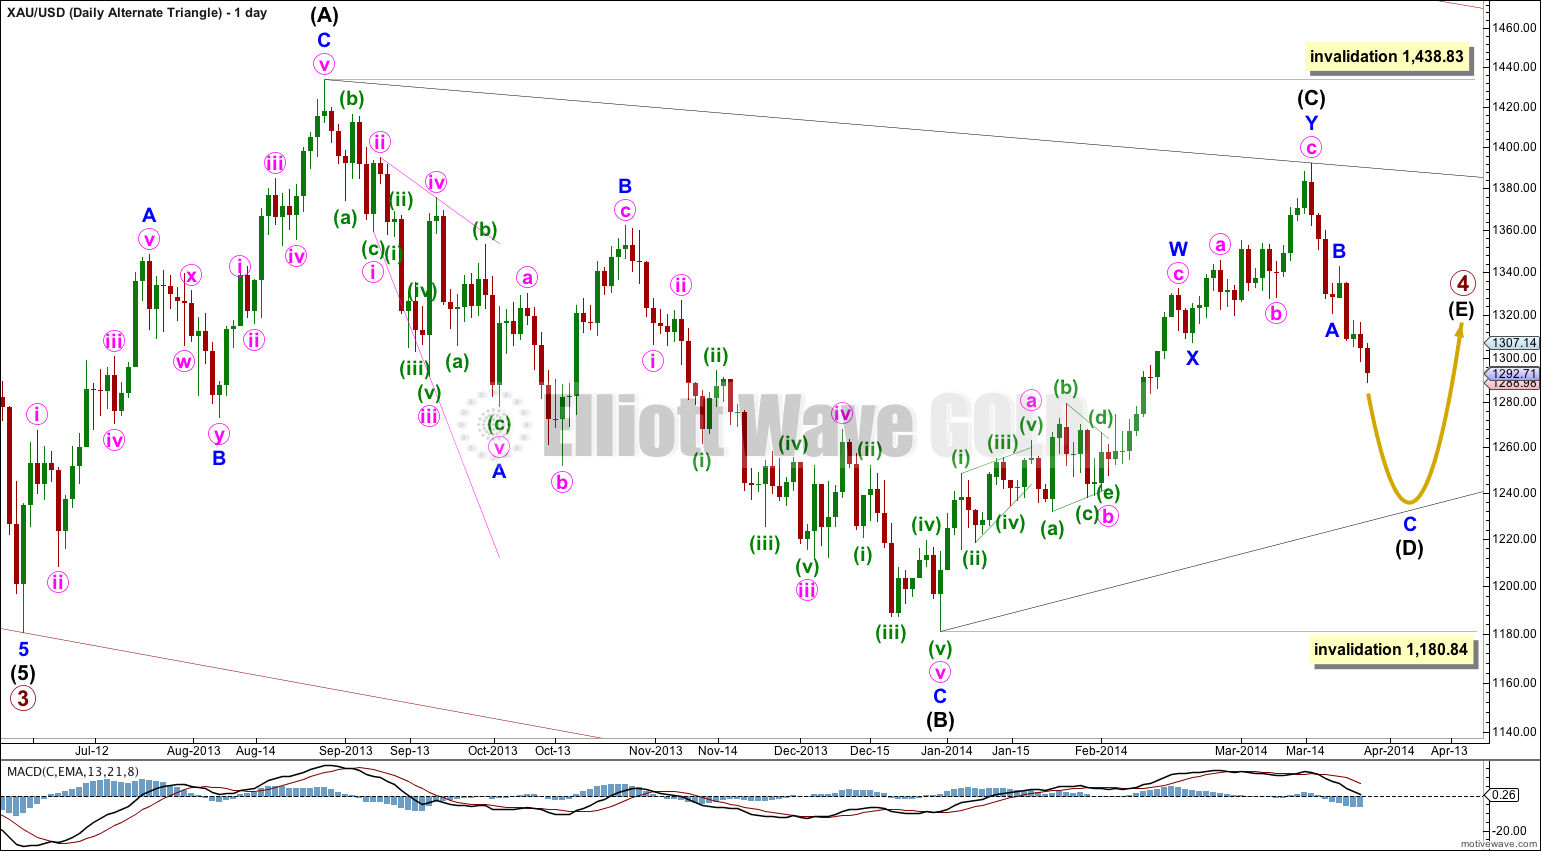
It is also possible that primary wave 4 may continue as a regular contracting (or barrier) triangle. With MACD moving reasonably close to the zero line on the daily chart this triangle looks typical. At this stage the subdivisions within primary wave 4 do not indicate whether it is a triangle or combination, both are possible. A triangle is less likely only because it is not as common a structure as a double combination.
This wave count has a good probability. It does not diverge from the main wave count and it will not diverge for several weeks yet.
Triangles take up time and move price sideways. If primary wave 4 unfolds as a triangle then I would expect it to last months rather than weeks.
Gold stocks have broken trend channel to the upside, anyone watching? comments?