Last analysis on 26th February expected more upwards movement towards a target at 105.80 to 107.63. Price moved up to 105.21 where it turned.
In the short term I am looking for a second wave correction to show soon, and its arrival will be confirmed with a breach of the channel on the hourly chart. In the mid to long term I am expecting a continuation of downwards movement towards 72.53. This target may be met in about 55 days.
Click on charts to enlarge.
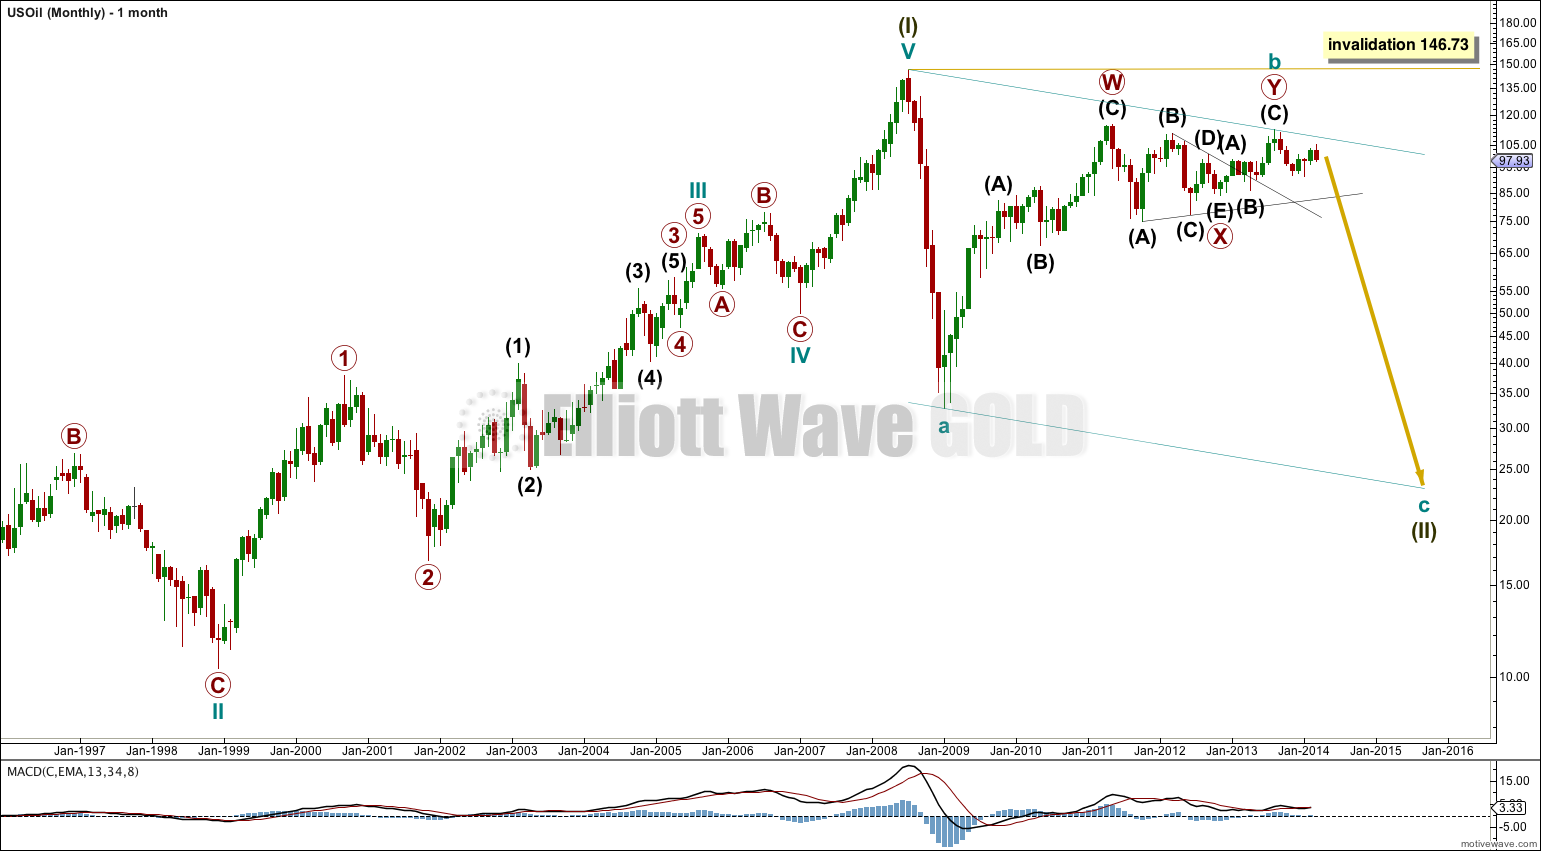
The bigger picture sees US Oil in a downwards correction which is incomplete. The correction is subdividing as a zigzag. Within the zigzag cycle waves a and b are complete. I would expect cycle wave c to find support, and end, at the lower edge of the parallel channel.
If the wave count is invalidated at the daily chart level then cycle wave b may be continuing higher. It may not move beyond the start of cycle wave a at 146.73.
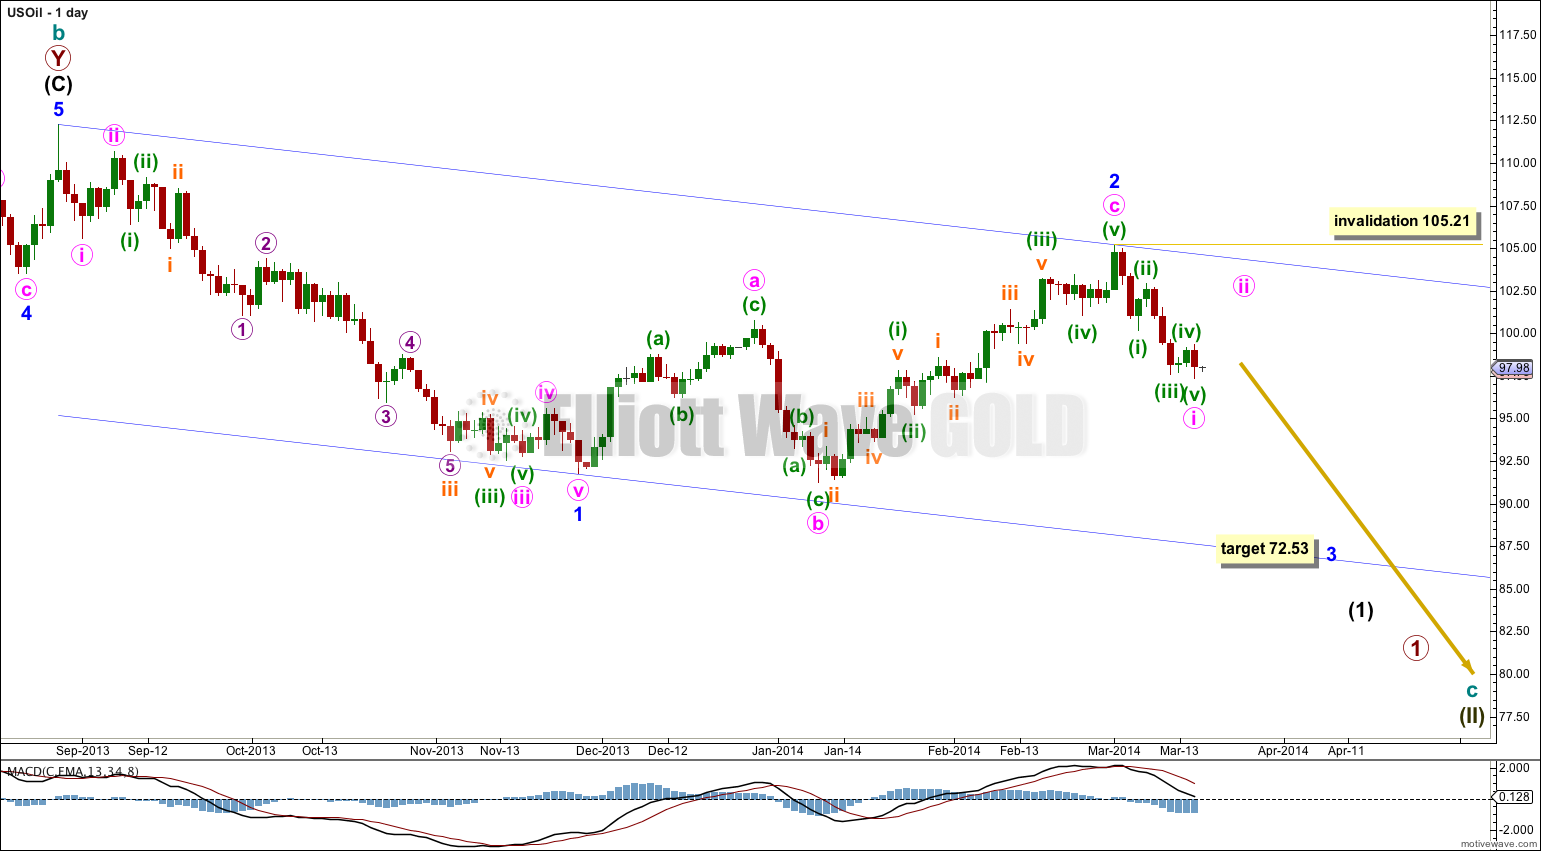
The daily chart shows all of the start of cycle wave c downwards.
Minor wave 1 subdivides perfectly as an impulse. Minor wave 2 is now complete as an expanded flat correction which is a 66% correction of minor wave 1.
Within minor wave 2 minute wave b is 106% the length of minute wave a, and minute wave c is 0.59 short of 1.618 the length of minute wave a.
At 72.53 minor wave 3 would reach 1.618 the length of minor wave 1.
Minor wave 1 lasted 65 days and minor wave 2 lasted 67 days. If minor wave 3 is of about the same duration it may end in another 55 days or thereabouts.
The channel drawn about minor waves 1 and 2 is a base channel. Minor wave 3 downwards should clearly and strongly breach the lower edge of the channel. Along the way down upwards corrections should find resistance about the upper edge of the channel.
Within minor wave 3 minute wave ii may not move beyond the start of minute wave i. This wave count is invalidated with movement above 105.21.
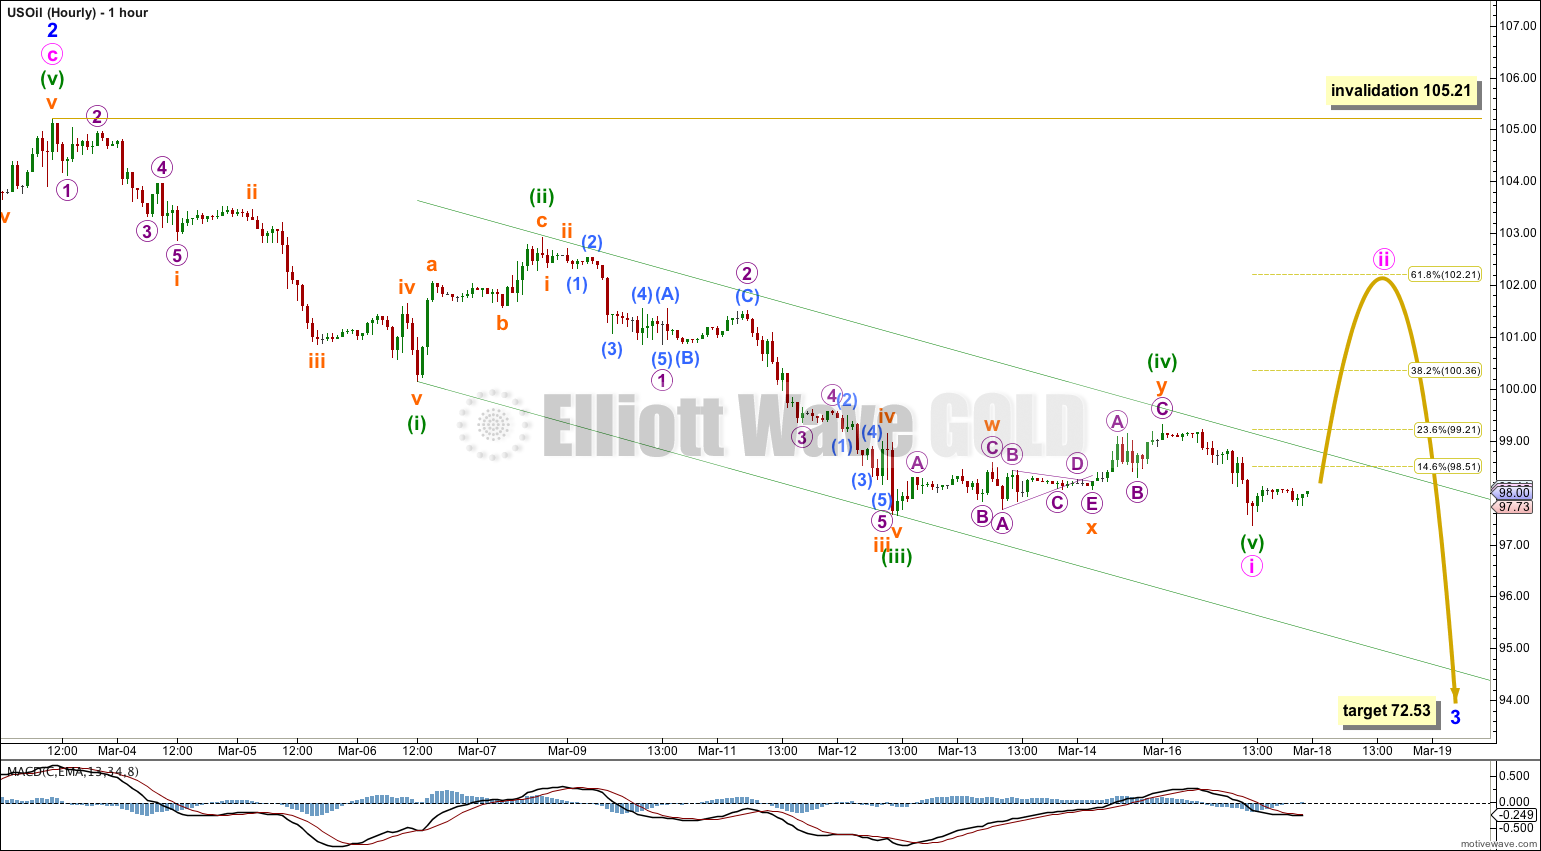
The hourly chart shows all of the beginning of minor wave 3. So far it is possible that minute wave i is complete, but this needs to be confirmed with a breach of the channel containing it. Draw the channel from the lows labeled minuette waves (i) to (iii), then place a parallel copy upon the high labeled minuette wave (ii).
If minute wave i is complete then within it Fibonacci ratios are: minuette wave (iii) is 0.29 longer than equality with minuette wave (i), and minuette wave (v) is just 0.02 longer than 0.382 the length of minuette wave (i).
If the channel is breached by upwards movement then I would expect minute wave ii to reach up to about 102.21. It may not move beyond the start of minute wave i at 105.21.


Both may be correct. Of course I would expect that mine is correct, but I could be wrong.
That wave count does not show how he sees the prior downwards movement from the all time high of 146.73 (July 2008) to the low at the beginning of his weekly chart. This is crucial. My wave count sees that as a five wave impulse. Which makes it either a first or an A wave. Which means price cannot move above 146.73 to a new all time high.
Also he is seeing the upwards wave labeled black A as a five wave structure (it must be if his B wave is that shallow). I strongly disagree with that, I think that rise subdivides as a three.
I can see another movement in that wave count which is labeled as a five and which has a strong three wave look. Overall… I do not think he is paying enough attention to the overall look of the charts. US Oil should have the “right look” at the daily and weekly chart level.
Thank you, Lara. I understand your point. I wish you a nice weekend!
Heiko
Hi Lara,
interesting count. This guy here is having a different one: http://theelliottwavesufer.blogspot.de/2014/03/elliott-wave-analysis-of-crude-oil-wave.html
Which one is correct?
Cheers,
Heiko
Lara, what stock or etf or index do you use for oil analysis?
I’m using an FXCM data feed. Their US Oil data is WTI Crude.
So, from where the entry should be taken with SL please???
Your question is answered in the FAQ. I am not a registered investment advisor and I cannot offer trading advice. I offer Elliott wave analysis only.