Price did not move quite as high as expected at the start of Monday’s session. This changes the wave count.
Summary: I expect to see choppy overlapping movement for another one to three days before the downwards trend resumes.
This analysis is published about 5:15 p.m. EST. Click on charts to enlarge.
Main Wave Count.
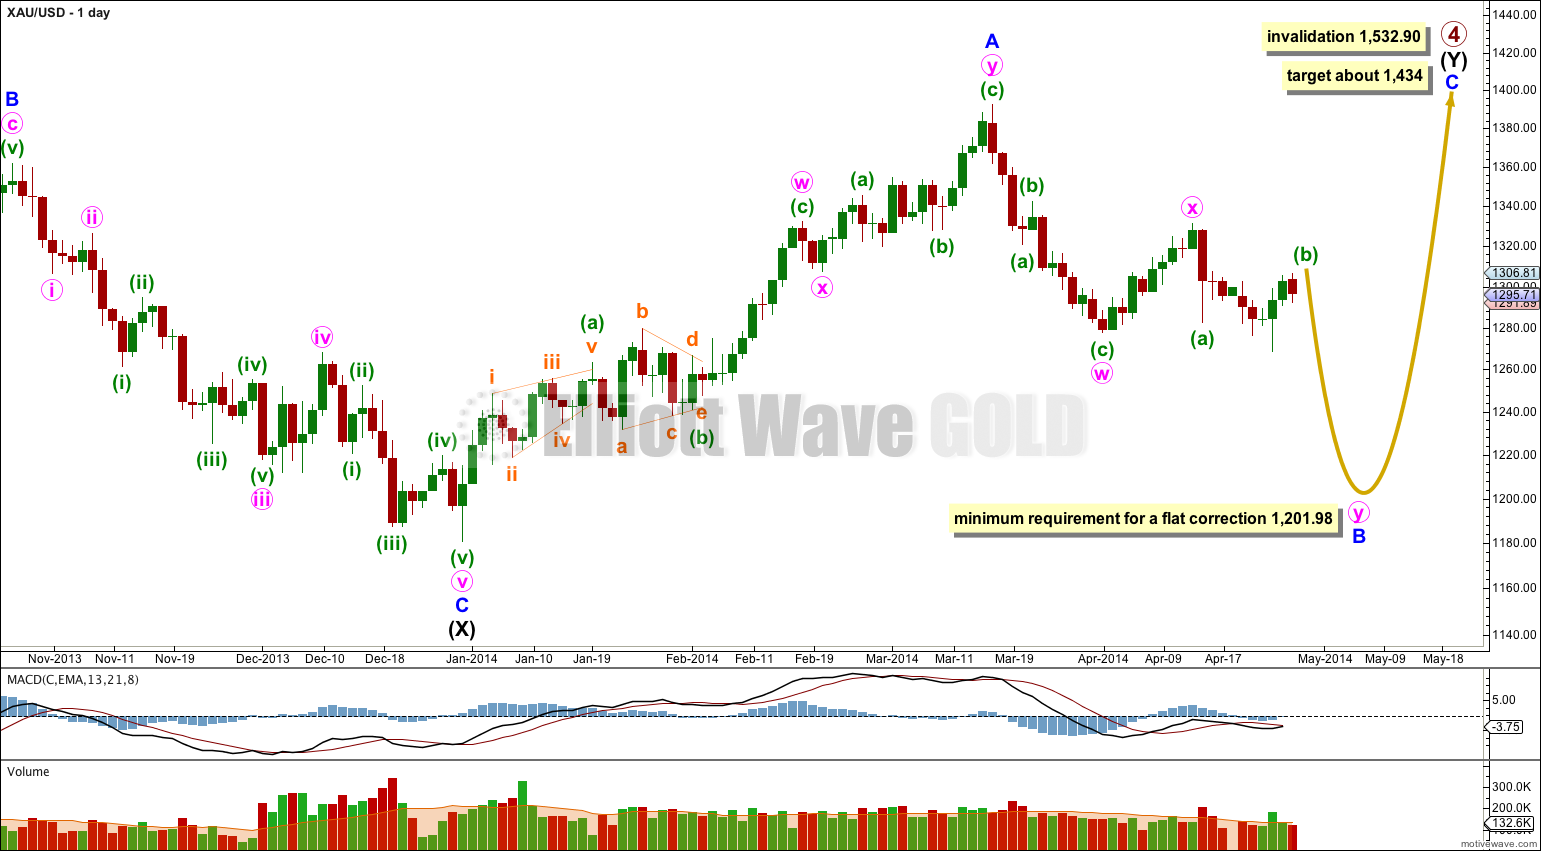
Gold is still within a large fourth wave correction at primary wave degree which is incomplete.
Primary wave 2 was a rare running flat. Primary wave 4 is unlikely to be a flat correction because it is likely to show structural alternation with primary wave 2.
Primary wave 4 is most likely to be completing as a double combination: zigzag – X – second structure. The second structure labeled intermediate wave (Y) is most likely to be a flat correction. Within the flat correction minor wave B must reach a minimum 90% the length of minor wave A at 1,201.98.
Overall the structure for primary wave 4 should take up time and move price sideways, and the second structure should end about the same level as the first at 1,434. Primary wave 4 may not move into primary wave 1 price territory. This wave count is invalidated with movement above 1,532.90.
Within intermediate wave (Y) minor wave B downwards is an incomplete corrective structure, and at this stage the structure fits best as an incomplete double zigzag. Minor wave B should continue for a few more weeks and may make a new low below 1,180, and is reasonably likely to do so in coming weeks.
Within the double zigzag of minor wave B we may be seeing alternation between minute waves w and y. Within minute wave w its A and C waves are somewhat close to equality (but not close enough to say they have an acceptable ratio of equality). Within minute wave y we may be seeing a ratio of 1.618 or 2.618 between its A and C waves, with its A wave being the shorter of the two.
Within minor wave B minute wave w lasted 11 days and minute wave x lasted 9 days. So far minute wave y has lasted 10 days and it still has a long way down to go. It looks like it will be longer lasting than minute wave w. It may last a total Fibonacci 21 or 34 days.
Minute wave x is still most likely complete as a single zigzag. Minute wave y has most likely begun. Minute wave y must subdivide as a zigzag to take price down to 1,201.98 or below.
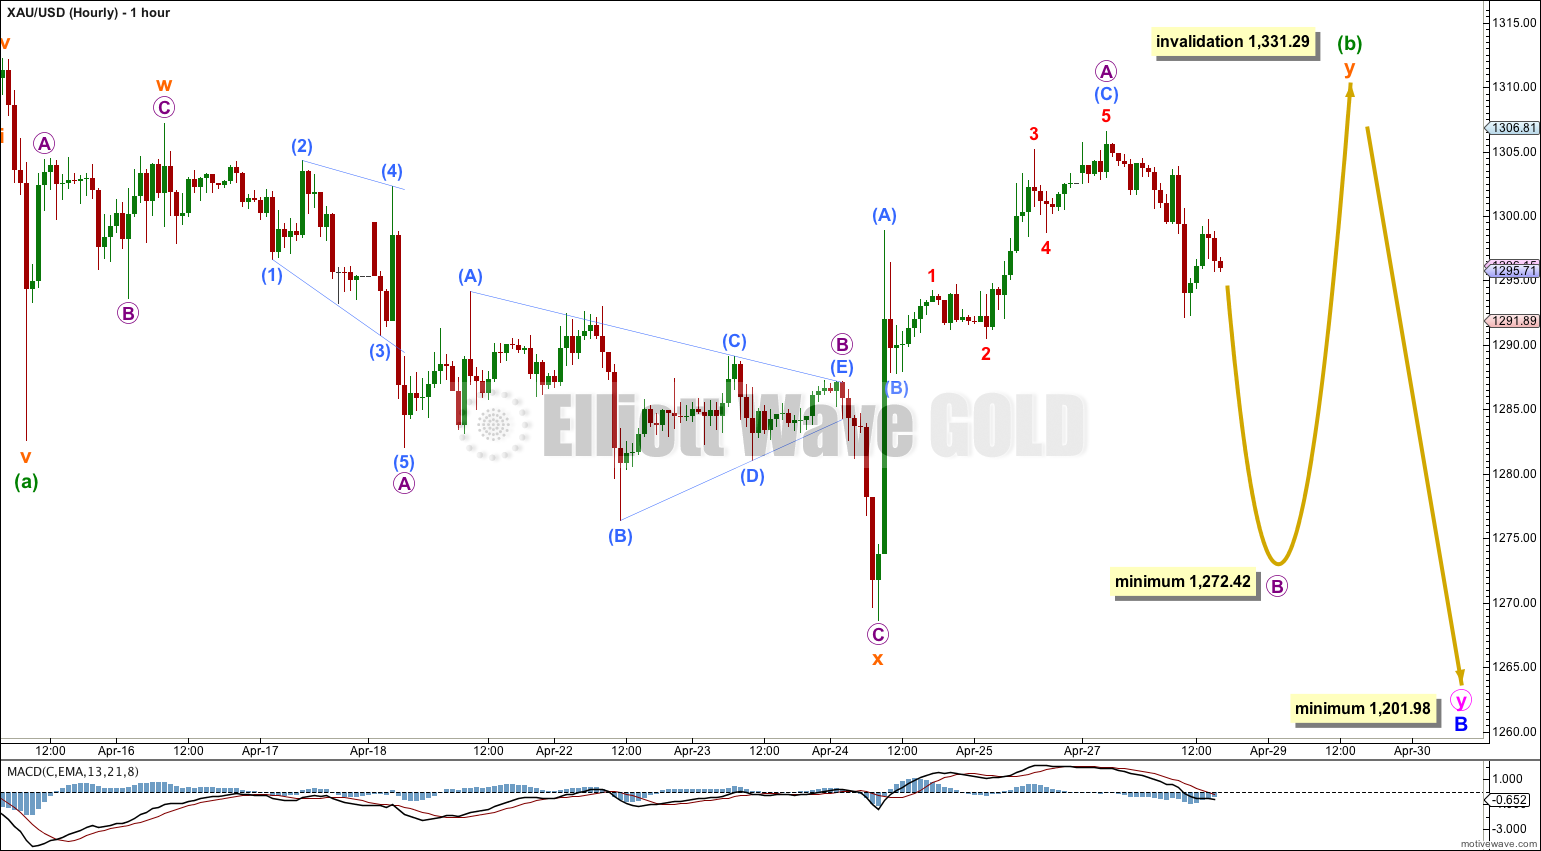
Within the zigzag of minute wave y minuette wave (b) is still most likely incomplete and I will still expect to see a new high above 1,307.19 before it is over.
There are more than thirteen possible corrective structures a B wave may take, and they are the most difficult of all waves to analyse because there is so much variation between them. At this stage minuette wave (b) may be an incomplete double combination (as labeled) or it may also still be an incomplete expanded flat (as labeled in last analysis) where the final C wave is an incomplete ending diagonal (and would be as labeled on the alternate below for that piece of movement).
If minuette wave (b) is a double combination then the first structure in the double, labeled subminuette wave w, was a zigzag. The double is joined by a three, a zigzag, in the opposite direction labeled subminuette wave x. The second structure in the double would most likely be a flat correction labeled subminuette wave y.
Within the flat correction micro wave B must reach a minimum 90% the length of micro wave A at 1,272.42. Thereafter, micro wave C should move at least a little above the end of micro wave A at 1,306.58.
This idea would see choppy overlapping movement for another one to three days to complete minuette wave (b).
Minuette wave (b) may not move beyond the start of minuette wave (a) at 1,331.29.
Alternate Wave Count.
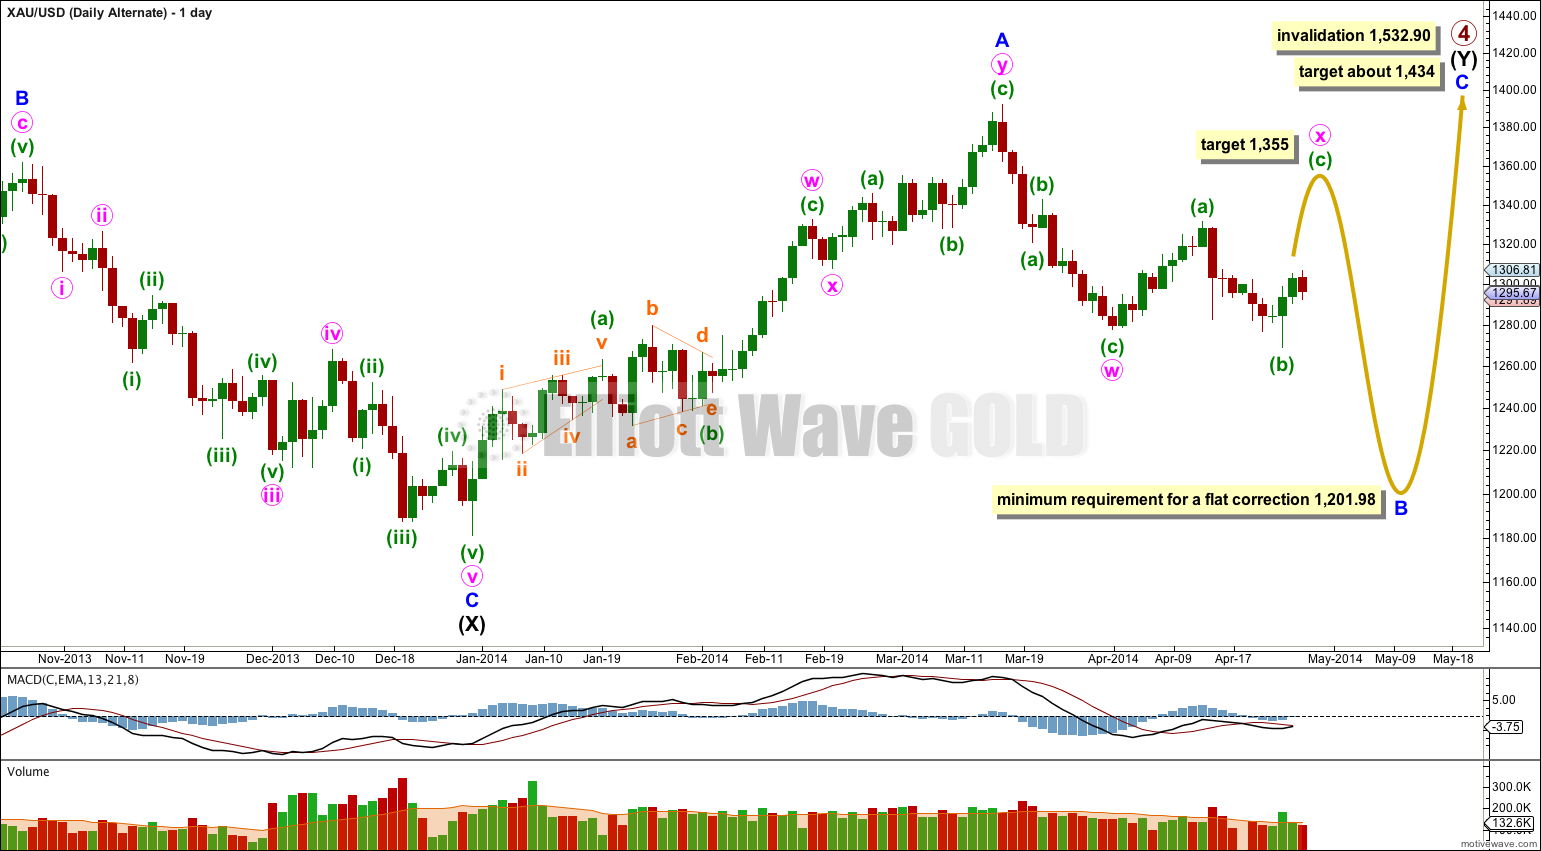
I have moved the degree of labeling within minute wave x down one degree: the first zigzag upwards may not be minute wave x in its entirety and that may only be minuette wave (a) within minute wave x. Minute wave x may be continuing sideways as a flat correction.
Minor wave B downwards is still seen here as a double zigzag: zigzag – X – zigzag. The purpose of double zigzags is to deepen a correction when the first zigzag does not move price deep enough, so this structure would be able to take price down to 1,201.98 or below.
This alternate still has a lower probability than the main wave count because if minute wave x continues higher for a few days it would be substantially longer in duration than minute wave w. This would be unusual for an X wave within a double zigzag, and reduces the probability of this wave count.
There is no upper invalidation point because there is no minimum or maximum requirement for an X wave. However, X waves within double zigzags are normally shallow as this one would be. The only requirement is that an X wave be a corrective structure.
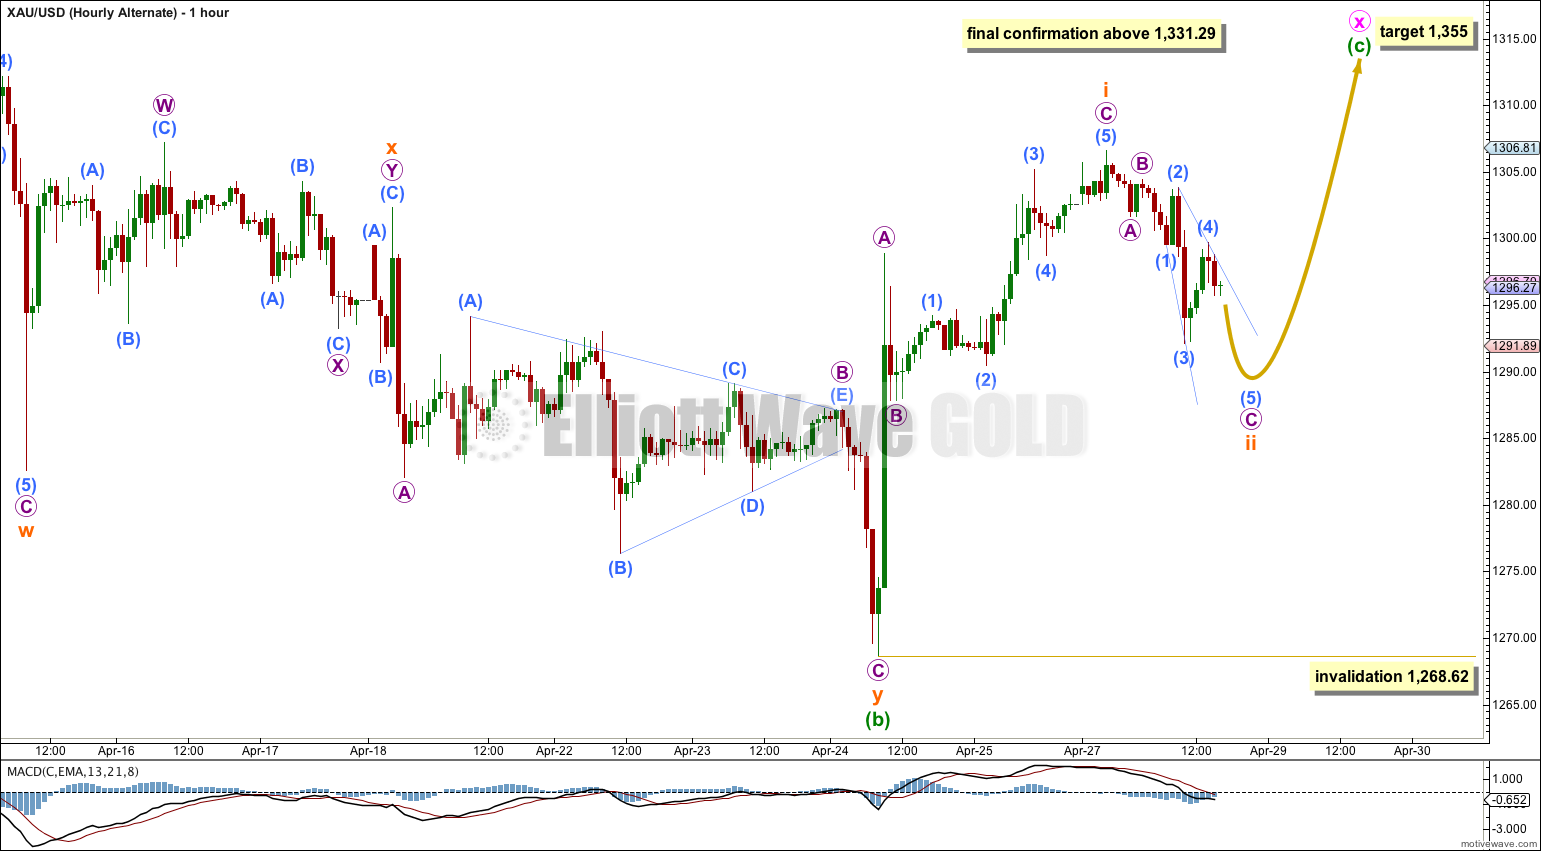
Within the possible flat correction minuette wave (b) is now a 117% correction of minuette wave (a), which indicates an expanded flat. At 1,355 minuette wave (c) would reach 1.618 the length of minuette wave (a).
If price reached up to 1,380.82 or above then I would relabel minor wave B in its entirety as a flat correction.
Minuette wave (c) must subdivide as a five wave structure, either an impulse or an ending diagonal. The first wave up within it now is a completed three, so minuette wave (c) may be an ending diagonal because they require all their subwaves to be single zigzags.
Within an ending diagonal subminuette wave ii may not move beyond the start of subminuette wave i at 1,268.62.


If price goes up tonight and does not exceed 1307.09 (sub – minuette wave W in your main hourly chart), could you please advise on the probability/likelihood that a barrier triangle may be unfolding for minuette B (blue). Chart of the idea relevant to the Gold composite attached. Thank You.
Thanks for the chart!
Yes, that idea is entirely possible. But it’s not technically correctly a barrier triangle, it would be a contracting triangle.
Barrier triangles have B-D trend lines which are essentially flat, the ends of B and D are very close. In this instance it is A and C which are close, but because C is slightly lower than A the rules for a contracting triangle are not violated.
However, that would be a very unusual contracting triangle; C is too close to A, it should be lower so that the A-C trend line slopes downwards, B is very deep in relation to A and D is very shallow in relation to C. It looks strange.
Nice idea though.
Hi Lara-
If the ED is playing out, the common target for subminuette ii should be $1275-$1280 or .66-.81 of subminuette i. This would give subminuette ii an odd look on the hourly chart IMO. However if it only drops to $1285, it would have a better look but would fall short of a typical ED retracement just like the $SPX. I think the ED in the $SPX is playing out despite the atypical look, but I don’t think it’s playing out in gold. It’s interesting because I can’t find the typical retracements of an ED anywhere on the web. Is it in the original EW principle book?
Thanks for the great analysis!
see page 88 of “Elliott Wave Principle” 10th edition, the first guideline for diagonals: “waves 2 and 4 each usually retrace .66 to .81 of the preceding wave”.
I agree, this possible ending diagonal has an atypical look for gold, the second wave is only .53 of the first.
I’ve looked at several possibilities today. I have a new alternate, looking at the possibility that (b) is over. It is extremely unlikely.
Whatever it turns out to be I would expect it to continue for another day or two, and typical for a B wave to be choppy and overlapping.