A little downwards movement was expected, but I had not expected it to be this deep or last this long for the main wave count. However, on the hourly chart the structure looks typical and the wave count has the right look. Both hourly wave counts remain valid. The point of differentiation is now 1,294.60.
Summary: The short term trend still remains up overall. Both wave counts expect to see new highs above 1,306.83 this week. Price may move clearly up (main wave count) or mostly sideways in very choppy overlapping movement (alternate).
This analysis is published about 04:30 p.m. EST. Click on charts to enlarge.
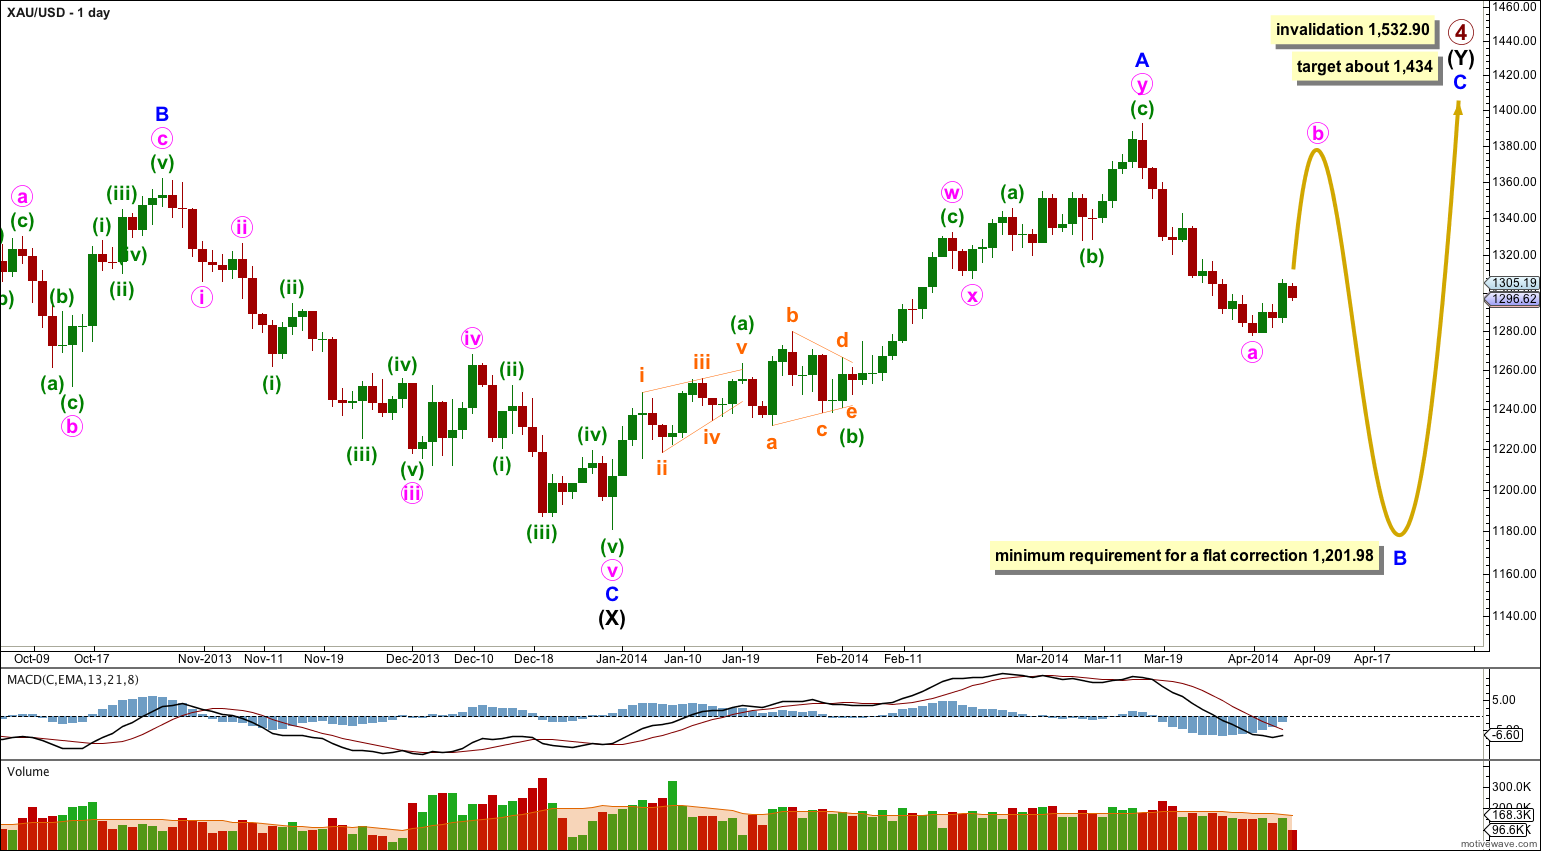
Gold is still within a large fourth wave correction at primary wave degree which is incomplete.
Primary wave 2 was a rare running flat. Primary wave 4 is unlikely to be a flat correction because it is likely to show structural alternation with primary wave 2.
Primary wave 4 is most likely to be completing as a double combination: zigzag – X – second structure. The second structure labeled intermediate wave (Y) is most likely to be a flat correction. Within the flat correction minor wave B must reach a minimum 90% the length of minor wave A at 1,201.98.
Overall the structure for primary wave 4 should take up time and move price sideways, and the second structure should end about the same level as the first at 1,434. Primary wave 4 may not move into primary wave 1 price territory. This wave count is invalidated with movement above 1,532.90.
Primary wave 4 may also be a large contracting triangle, but at this stage this idea does not have the “right look” and so I will not publish a chart for it. I will continue to follow this idea and will publish a chart in coming weeks for it if it shows itself to be correct. At this stage there is no divergence between wave counts for a triangle or a double combination.
This main wave count follows the idea that minor wave B may be unfolding as a flat correction. Within the flat correction minute wave a subdivides as a single zigzag. Minute wave b within the flat must reach a minimum of 90% the length of minute wave a at 1,380.82.
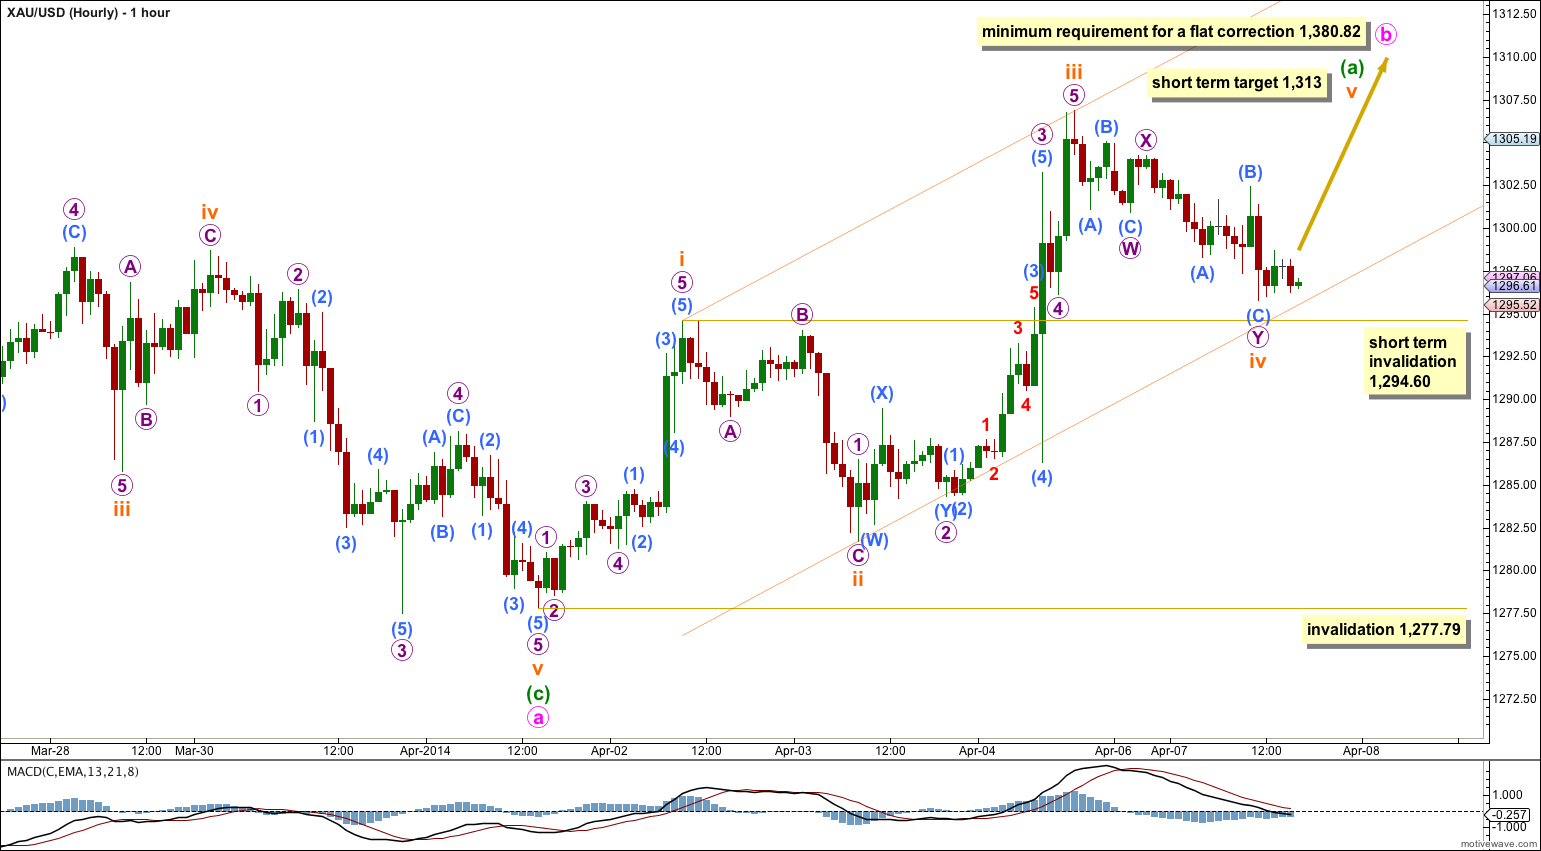
Minute wave b is most likely to subdivide as a single or double zigzag in order to reach 1,380.82. The first wave up should subdivide as a five and it is incomplete.
Subminuette wave iii is 2.07 short of 1.618 the length of subminuette wave i. At 1,313 subminuette wave v would reach equality in length with subminuette wave i. If subminuette wave iv moves any lower it may not move into subminuette wave i price territory below 1,294.60.
Subminuette wave iii shows a clear increase in upwards momentum which fits this wave count perfectly. Subminuette wave iv may have lasted 23 hours, while subminuette wave ii lasted 22 hours. They are nicely in proportion. Subminuette wave iv has come close to the lower edge of the parallel channel. This gives the wave count a typical look.
When minuette wave (a) is a completed five wave structure then the following downwards movement for minuette wave (b) should last one or two days and may not move below the start of minuette wave (a) at 1,277.79.
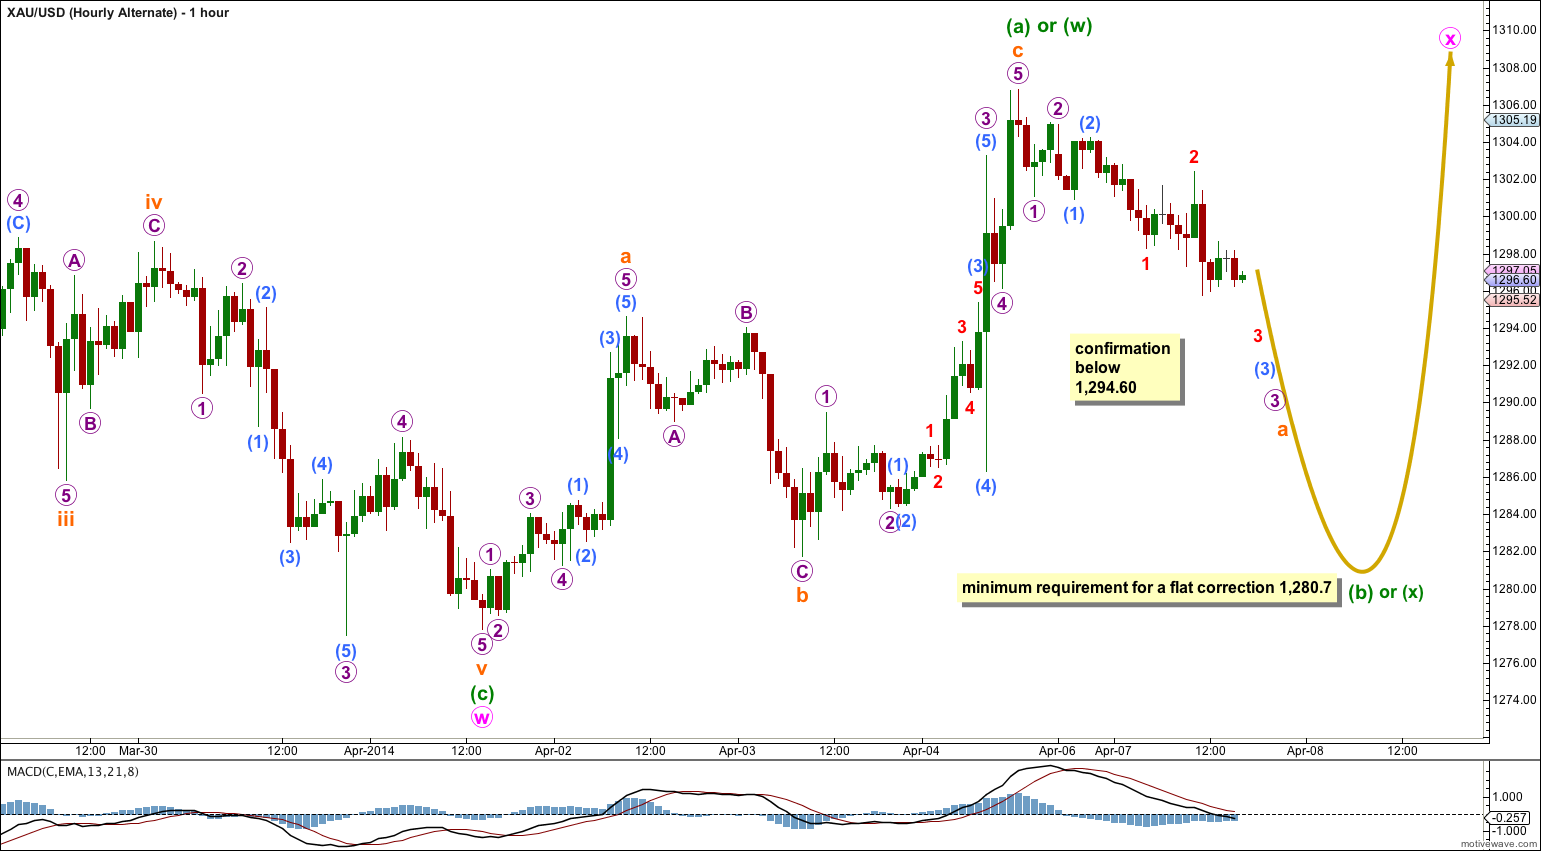
Alternate Hourly Wave Count.
This alternate wave count follows the idea that minor wave B may be unfolding as a double zigzag. The first zigzag downwards is labeled minute wave w. The double should be joined by a “three” in the opposite direction which may subdivide as any corrective structure labeled minute wave x.
Because 1-2-3 and A-B-C subdivide in exactly the same way I am adjusting this alternate to see a three up complete. This may be minuette wave (a) of a flat correction of minuette wave (w) of a double zigzag or double combination.
If minute wave x is unfolding as a flat correction then within it minuette wave (b) must move lower to reach a minimum 90% the length of minuette wave (a) at 1,280.70.
If minute wave x is unfolding as a double then there is no minimum downwards requirement for minuette wave (x) within it.
Note: Within multiples (doubles and triples) subwaves W, Y and Z may only subdivide as simple A-B-C corrections. However, X waves may be any corrective structure, including multiples. Any wave count which you see that labels the subwaves of W, Y and Z as W-X-Y(-Z) is invalid and so would have absolutely zero predictive quality. However, it is one of the most common mistakes I see from others who are beginning with Elliott wave.


The guideline is simply that you should expect waves of the same degree to be proportional.
Third waves are often extended, and so would take longer.
I’m halfway through writing an Elliot Wave book which will include a section on this. I hope to have it done… by the end of this year.
Lara,
Thank you very much. Actually, things like “Minute wave a (or w) lasted 11 days. Minute wave b may last about the same or a Fibonacci 13 days” is the guidelines I am looking for. In another words, If time of wave 1 is known, how to predict wave 2? Or if wave 1 and 2 time length are known, how to predict wave 3 time length? I think it is really helpful to have a guideline of price in “Elliott wave structures guide”. Furthermore, where can I find the guideline of time for questions above?
No.
Look for Fibonacci ratios in price, and look for Fibonacci numbers in time. But Fibonacci time relationships are not as reliable as Fibonacci price ratios. Sometimes we see them, but often we do not. Look out for them but don’t expect them.
Minute wave a (or w) lasted 11 days. Minute wave b may last about the same or a Fibonacci 13 days.
No sorry, my bad. Now I see what you mean.
Overall I expect for both wave counts we should see a new high above 1,306 probably this week.
Anyway, the situation is somewhat changed after today’s analysis. The upwards structure is a zigzag, and both wave counts are the same.
We should see a new high above 1,306 maybe this week, or failing that early next week.
regarding the time length questions, shall i expect that minute wave b wave will last 61% to 100% the time of minute wave a?
I am sorry, maybe I make a mistake regarding the second question. Cause I saw in headlines “Summary: The short term trend still remains up overall. Both wave counts expect to see new highs above 1,306.83 this week. ” Here I thought the alternate wave count will also go up to 1306.83.
There are very rough guidelines as to duration for the different wave degrees. Look on the right hand sidebar of the website under “free resources” to download a copy of the wave notation file.
These are VERY rough guidelines only, particularly at lower wave degrees. Flexibility is essential.
I am using Motive Wave software, with an FXCM data feed for Gold cash data.
The second part of your question makes no sense to me. The downwards trend for the alternate in this analysis expected movement to 1,280.7, not 1,380. Neither expected upwards movement to 1,306 specifically.
Sorry, one more questions, is there any guide lines about the time length among waves 1,2,3,4,5 and a,b,c (or w,x,y)?
Hi Lara,
I have two simple questions: 1 what software are you using? I want to buy licence for it, including the gold hourly data.
2 alternate seems have down trend till 1380, why do you say both count have up trend at least to 1306?
thanks