Data is daily only.
Click chart to enlarge.
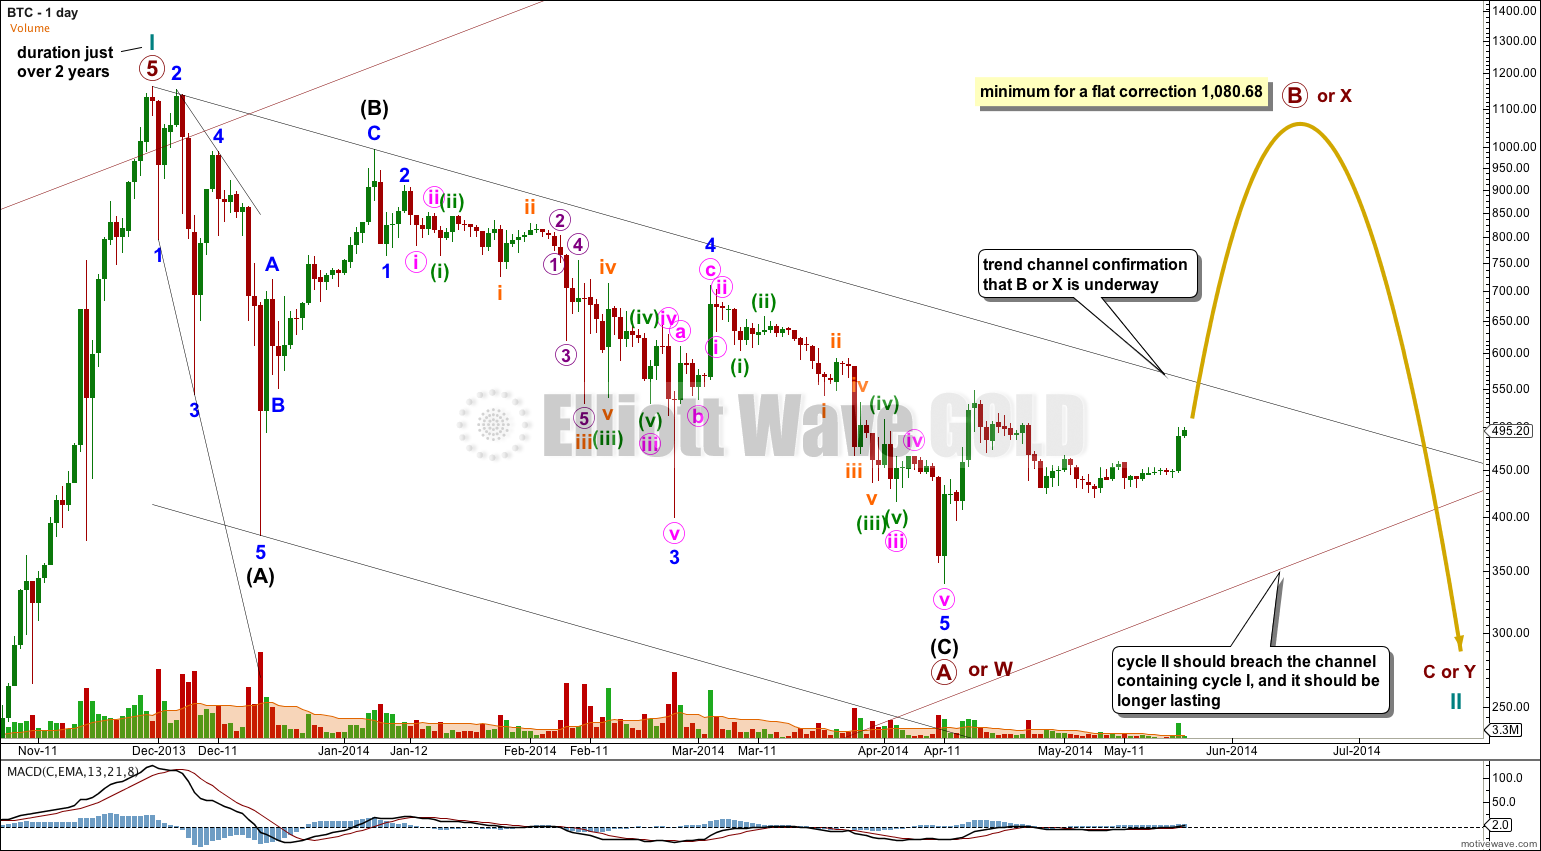
My last analysis of Bitcoin expected to see more downwards movement to complete an ending diagonal for a C wave. However, the last two days have seen some strong upwards movement so I have looked at other possibilities because the ending diagonal just doesn’t look right due to the trend lines no longer converging.
So what if the downwards correction could be over already? If the C wave does not fit as an ending diagonal, could it be an impulse?
Yes it can. The subdivisions actually have a really nice fit.
Most likely we now have a completed three down structure. When I zoom out to look at all Bitcoin data, however, it does not look like the correction is over because the channel containing the prior impulse of cycle wave I has not been breached. Also, if cycle wave II was over it would have been a remarkably brief cycle degree wave.
I expect now that this correction is only primary wave A of cycle wave II.
Cycle wave II is likely to be either a flat, double zigzag or double combination. If the next wave up is a three and reaches 1,080.68 or above then I would expect cycle wave II is a flat. If the next wave up fails to reach 1,080.68 before it ends then cycle wave II may be a double zigzag or double combination.
In the first instance I would expect to see some more upwards movement to clearly breach the parallel channel containing primary wave A (or W). When this channel is breached I will then begin to label subdivisions of primary wave B (or X) and draw a channel about it.
When the channel about primary wave B (or X) is breached then I will expect it is over. The length of it will indicate what structure is unfolding for cycle wave II.
At this stage there are multiple possibilities for the next wave up. The B wave (or X wave) could be a sharp clear upwards movement as a zigzag, or it could be a combination or triangle. It could be a flat correction. It could make a new all time high.
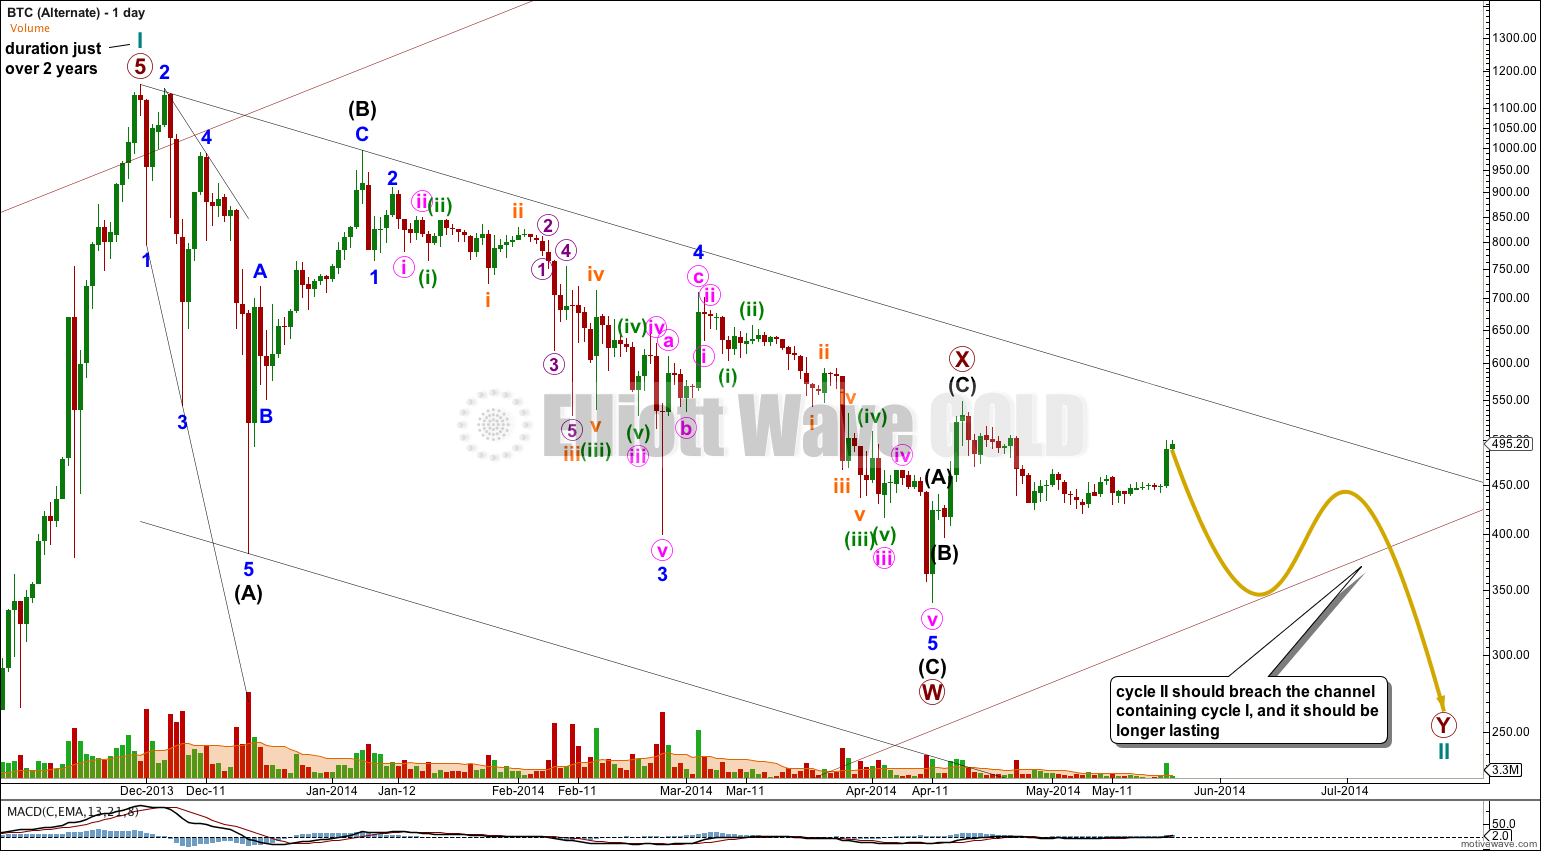
Alternate
I am considering all possibilities. If cycle wave II is a double zigzag then we could see overall downwards movement from here as the second zigzag in the double unfolds.
This alternate has a remarkably brief and shallow primary wave X. This reduces the probability of this wave count, but does not invalidate it. X waves within double zigzags are often brief and shallow, albeit not as brief and shallow as this one.
In conclusion, the only thing I am confident of with this analysis is cycle wave II is not over. It should breach the channel containing cycle wave I, and it should last longer. I expect, overall in the next year most likely, for Bitcoin to make new lows.


Do you think cycle II has just ended or would you expect more downside??
Thanks
Might we get an updated analysis for Bitcoin?
Possibly. I’ll add it to the list.