
More sluggish sideways movement to complete another small doji candlestick was not what was expected. I have a new alternate wave count for you today.
Summary: By the end of this week I expect Gold to break below 1,273.43. The downwards trend should resume.
This analysis is published about 09:02 p.m. EST. Click on charts to enlarge.
Main Wave Count.
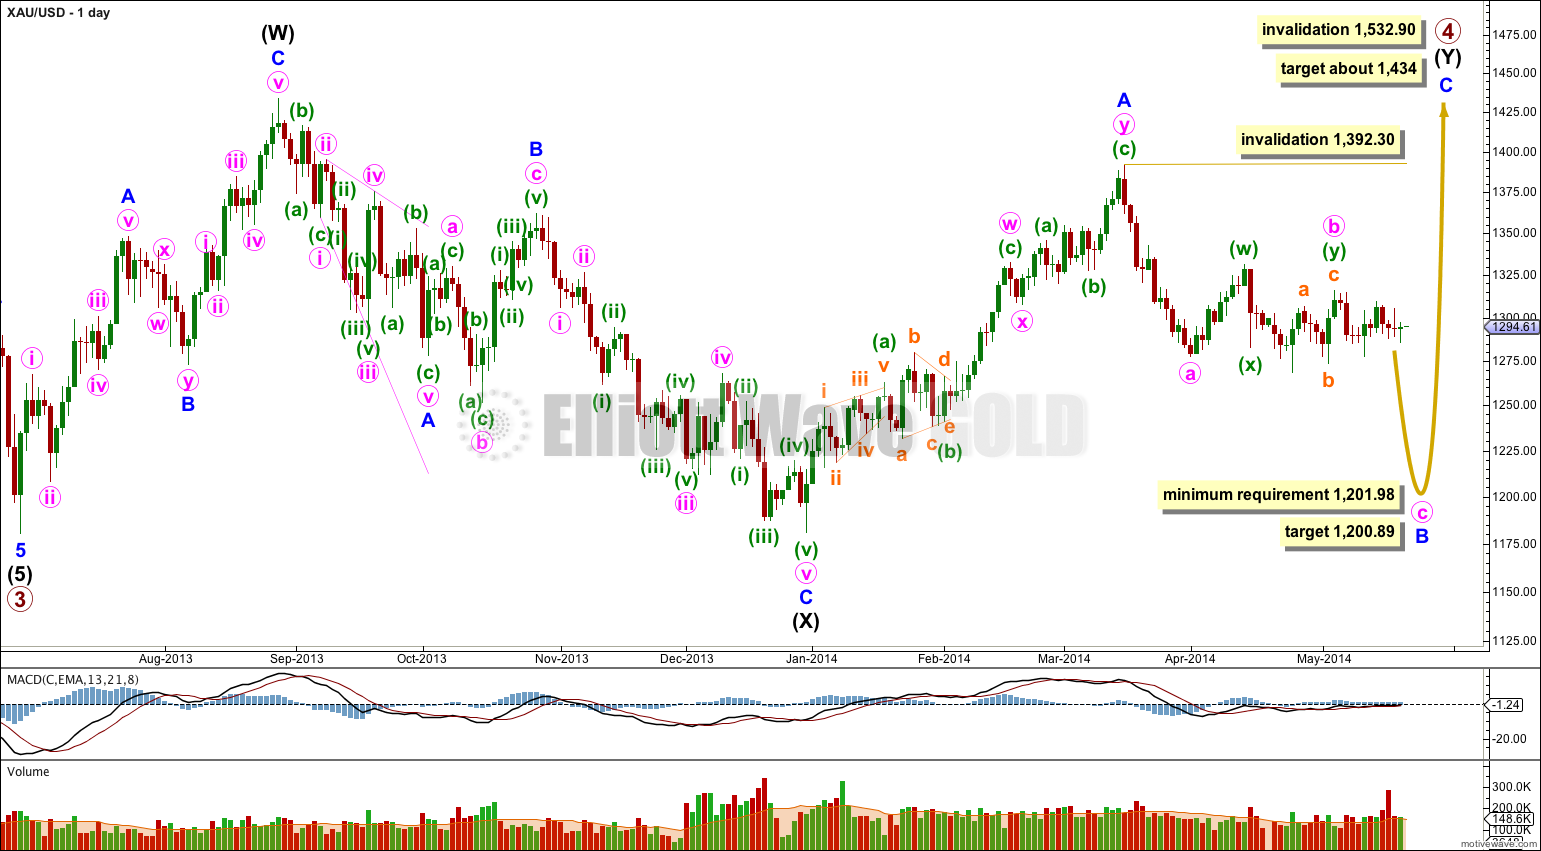
Gold is still within a large fourth wave correction at primary wave degree which is incomplete.
Primary wave 2 was a rare running flat. Primary wave 4 is unlikely to be a flat correction because it is likely to show structural alternation with primary wave 2.
Primary wave 4 is most likely to be completing as a double combination: zigzag – X – second structure. The second structure labeled intermediate wave (Y) is most likely to be a flat correction. Within the flat correction minor wave B must reach a minimum 90% the length of minor wave A at 1,201.98.
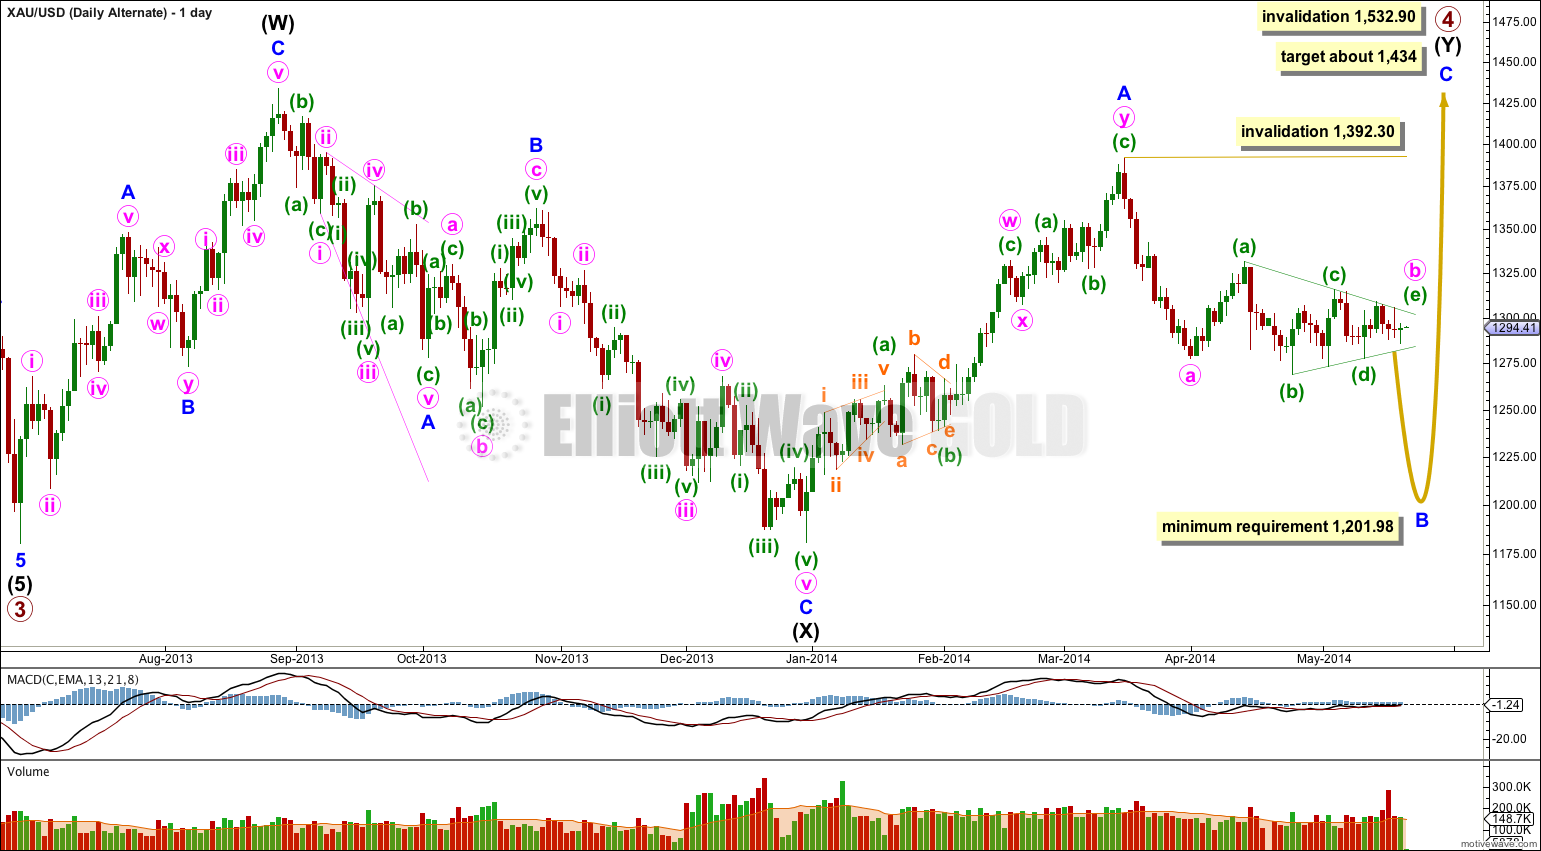
If downwards movement does not reach 1,201.98 or below then intermediate wave (Y) may not be a flat correction and may be a contracting triangle. I will keep this alternate possibility in mind as this next wave down unfolds. If it looks like a triangle may be forming I will again chart that possibility for you.
Overall the structure for primary wave 4 should take up time and move price sideways, and the second structure should end about the same level as the first at 1,434. Primary wave 4 may not move into primary wave 1 price territory. This wave count is invalidated with movement above 1,532.90.
Within intermediate wave (Y) minor wave B downwards is an incomplete corrective structure, and at this stage the structure may be either a single zigzag (as labeled here) or a double zigzag (relabel A-B-C to W-X-Y). While this next wave unfolds I will have to consider two structural possibilities: it may be an impulse for a C wave, or it may be a zigzag for a Y wave.
If minor wave B is a single zigzag then within it minute wave b may not move beyond the start of minute wave a above 1,392.30. Minute wave c would reach equality in length with minute wave a at 1,200.89.
If minor wave B is a double zigzag, relabeled minute w-x-y, then within it there is no invalidation point for minute wave x. But X waves within double zigzags are usually relatively brief and shallow, as they very rarely make new price extremes beyond the start of the first zigzag in the double.
Downwards movement saw a new low below 1,287.88, yesterday’s low. This wave count remains valid, but the sideways movement and lack of downwards momentum reduces its probability.
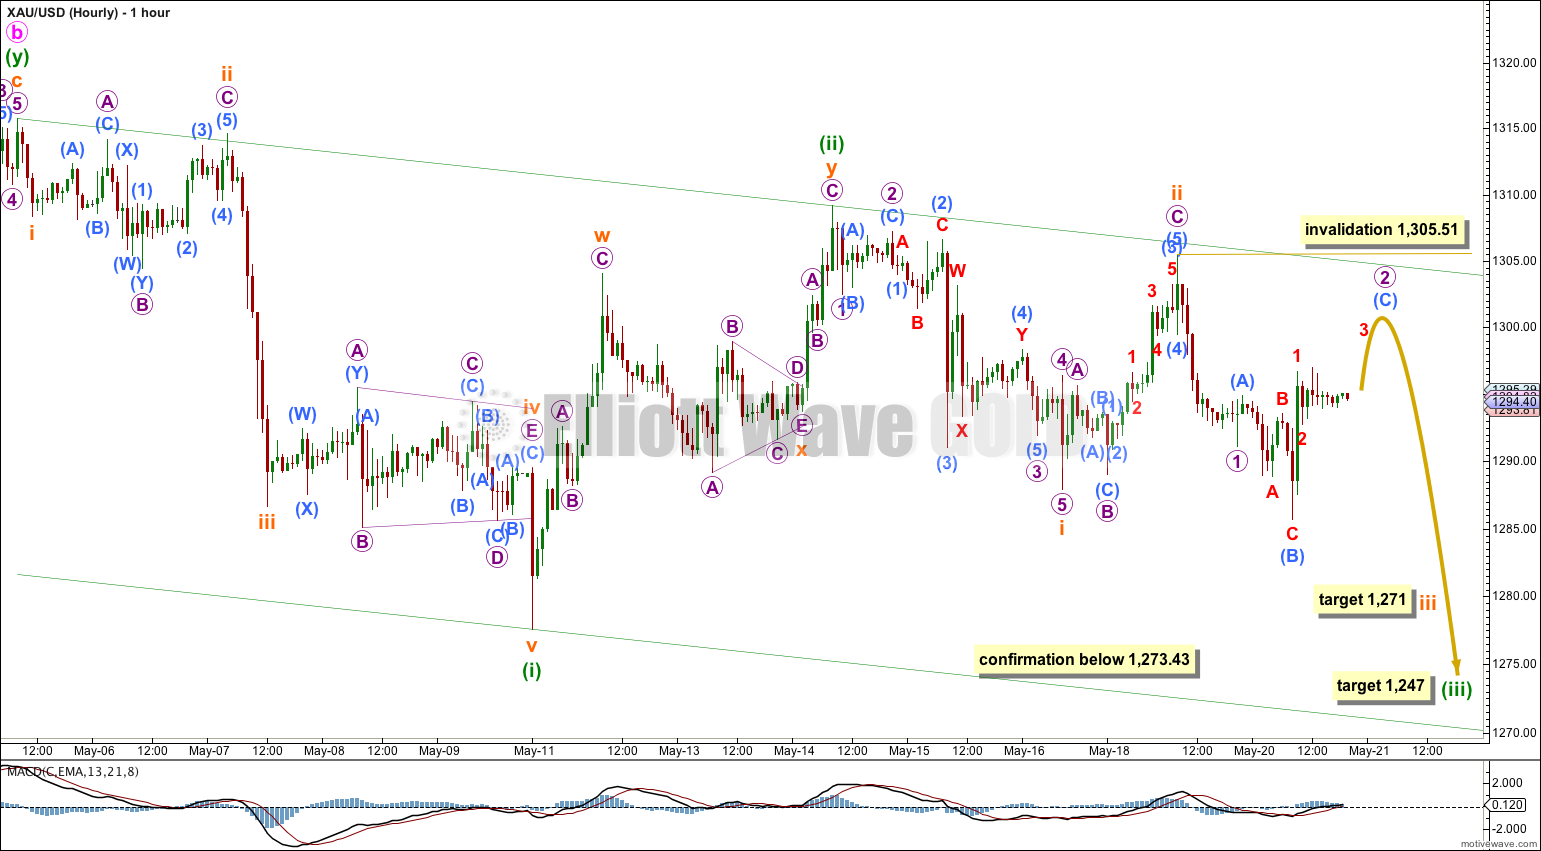
The expected direction for the next movement is exactly the same for both the main and alternate wave counts.
Micro wave 2 may be incomplete and if it moves higher, as I expect it should, it should find resistance at the upper edge of the base channel about minuette waves (i) and (ii).
At 1,271 subminuette wave iii would reach 1.618 the length of subminuette wave i.
At 1,247 minuette wave (iii) would reach 1.618 the length of minuette wave (i).
This next downwards wave should show a strong increase in downwards momentum.
Movement below 1,273.43 would provide clear price confirmation that Gold has broken out of its sideways trading range, and the breakout is to the downside.
Micro wave 2 may not move beyond the start of micro wave 1 above 1,305.51.
Alternate Wave Count.
It is possible that minute wave b is an almost complete running contracting triangle. I have checked the subdivisions carefully and it does fit.
The triangle may be close to completion. When it is finally complete then I would expect to see a sharp downwards movement.
Minuette wave (e) of the triangle would most likely fall short of the (a) – (c) trend line, but if not then it may overshoot the line.
When the triangle is complete I would be able to calculate a target for the next wave down for you.
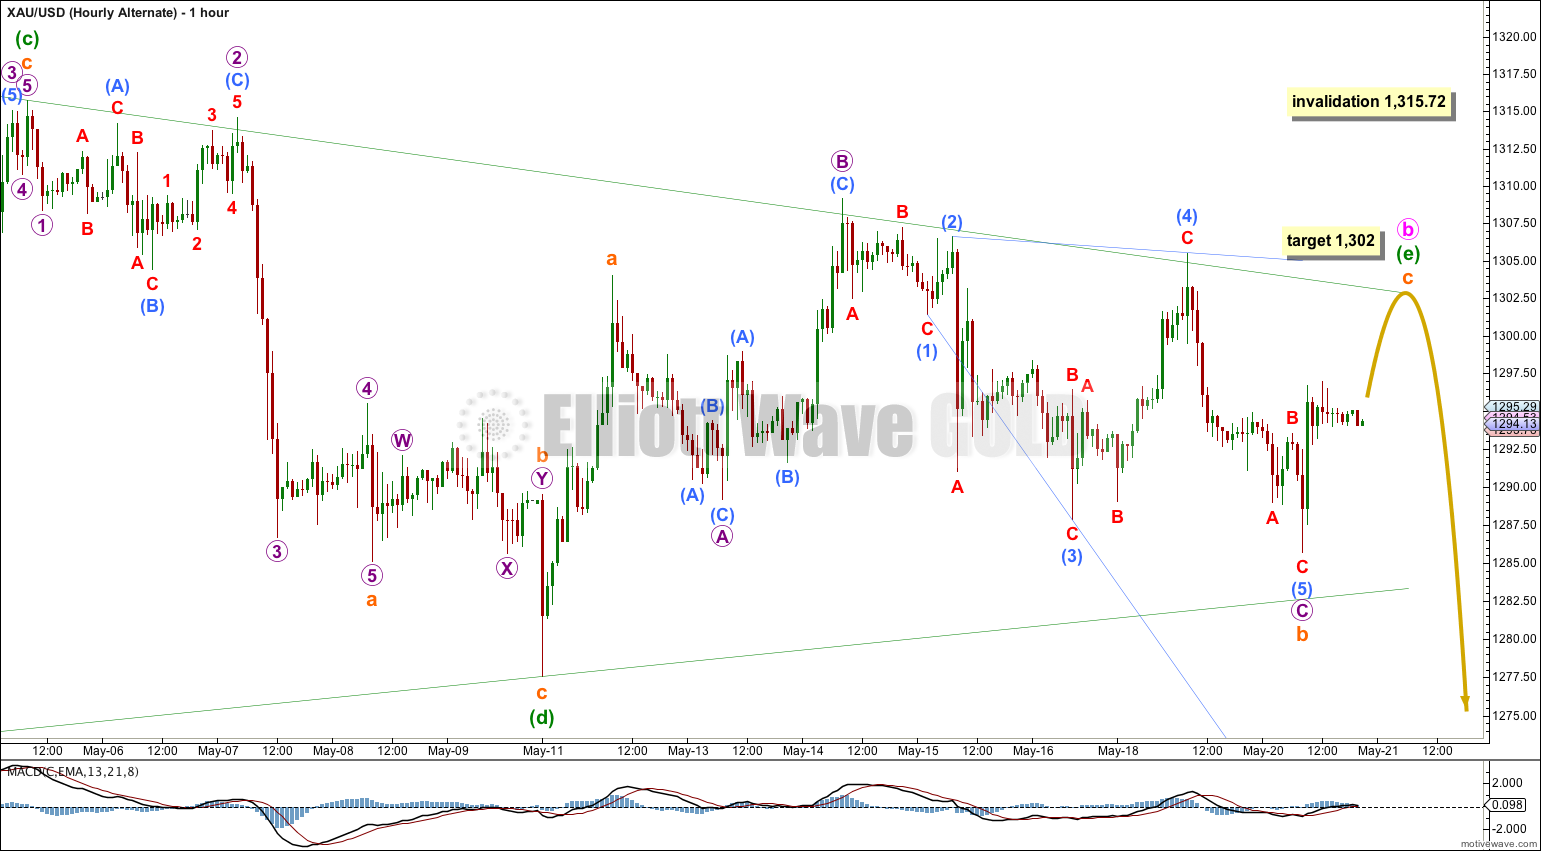
Because sideways movement continues and because MACD shows flat momentum I expect that if minute wave b is a triangle, then the triangle is incomplete.
Within the triangle minuette wave (b) was a double zigzag (this the only way the subdivisions will fit for a triangle) so minuette wave (e) may only be a single zigzag, as a triangle may not have more than one complex subwave.
Within minuette wave (d) the subdivisions fit as a single zigzag, and the problem with the odd looking fourth wave triangle for the main wave count is resolved. Subminuette wave c is just 0.25 longer than 0.382 the length of subminuette wave a.
Within minuette wave (e) subminuette wave c would reach 0.618 the length of subminuette wave a at 1,302. This may bring price to slightly overshoot the (a) – (c) trend line.
Minuette wave (e) may not move beyond the end of minuette wave (c) at 1,315.72.
This alternate wave count expects exactly the same movement next. If this unfolds as expected, and we see a sharp thrust out of the triangle, then this would be my main wave count.
Tomorrow is FOMC minutes day in the US. Gold has been known to move quite a bit following the FOMC minutes. I think the breakdown happens within 24 hrs as your analysis suggests! Fantastic job Lara!