Yesterday’s analysis expected to see sideways movement for the short term, to last up to one day. This is exactly what has happened over the last 24 hours.
Today’s analysis focusses on whether or not the sideways movement is over.
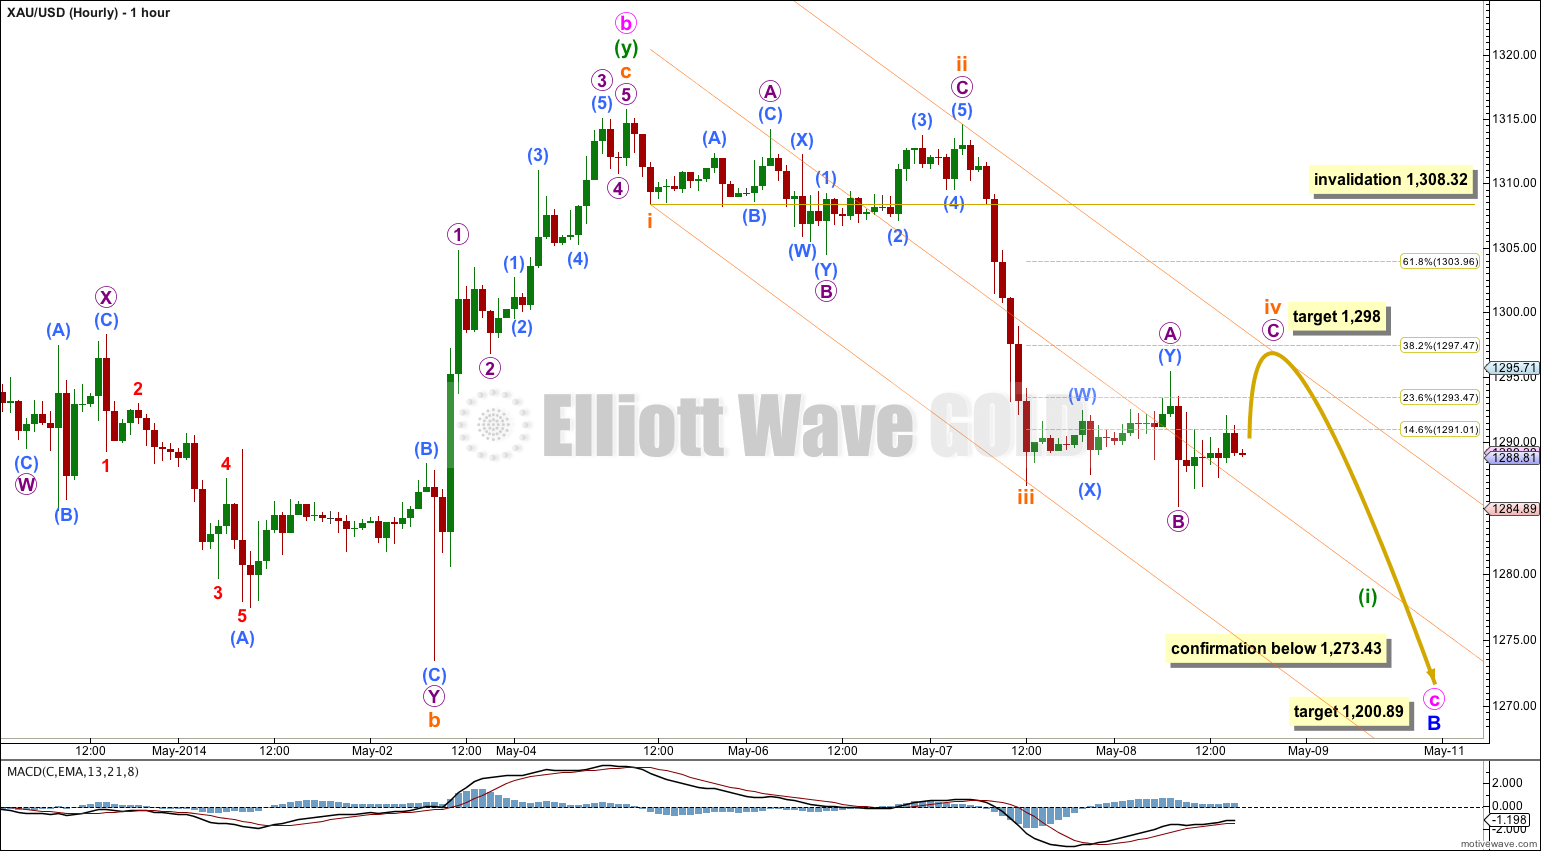
When price breaks below 1,273.43 I will have full confidence in this wave count and the target.
Summary: The target for downwards movement to end is at 1,200.89. This target may be about eight days away. In the short term I expect to see some more sideways movement which should end in a few more hours. The short term target for a little upwards movement is 1,298 and thereafter price should resume the downwards trend. The next candlestick for 9th May should be a longer red candlestick.
This analysis is published about 04:50 p.m. EST. Click on charts to enlarge.
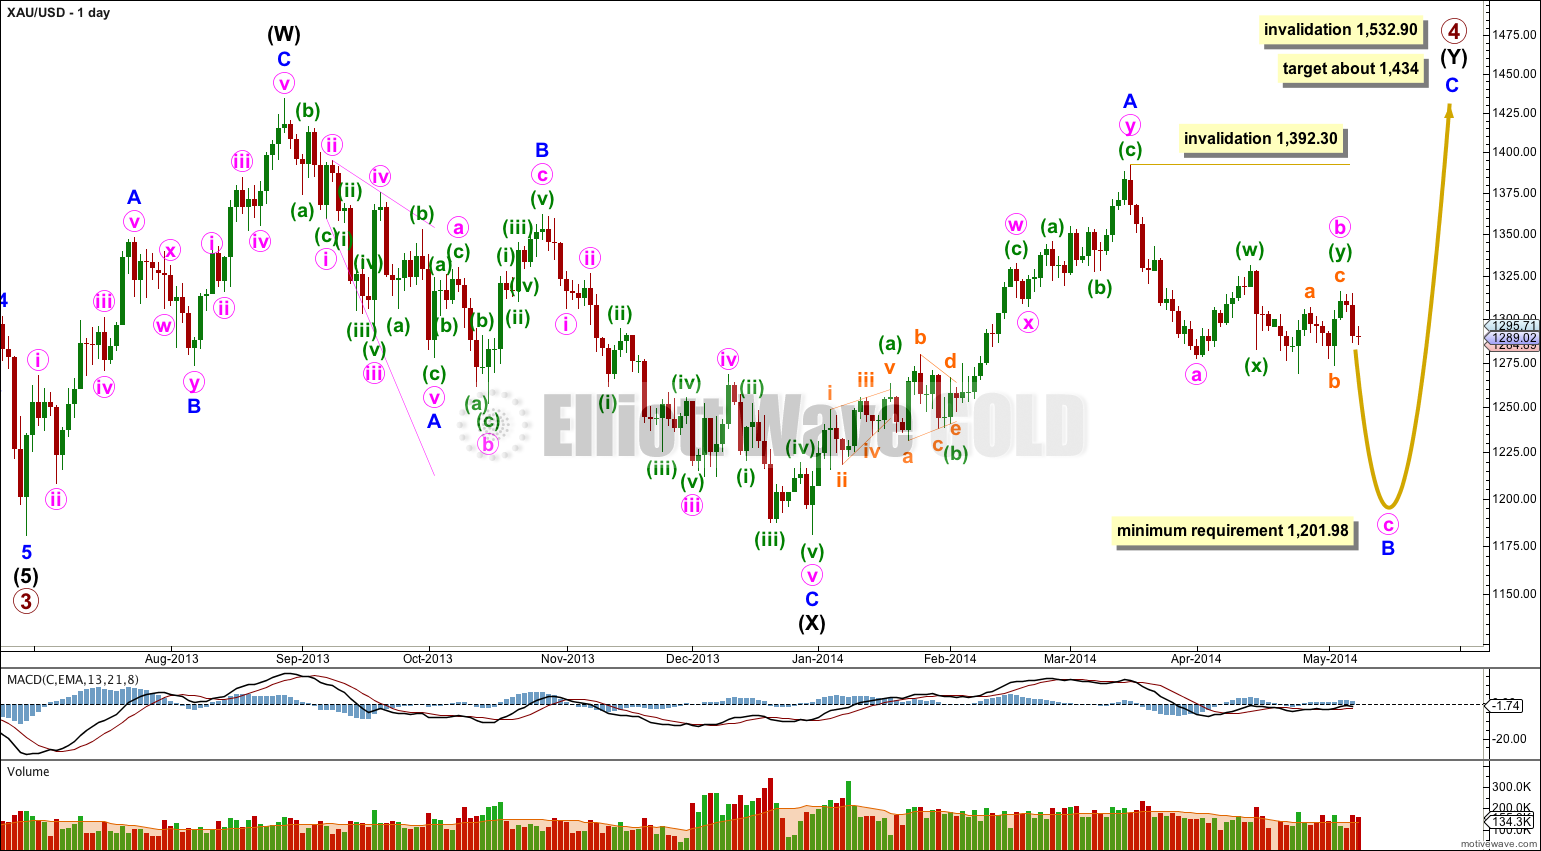
Gold is still within a large fourth wave correction at primary wave degree which is incomplete.
Primary wave 2 was a rare running flat. Primary wave 4 is unlikely to be a flat correction because it is likely to show structural alternation with primary wave 2.
Primary wave 4 is most likely to be completing as a double combination: zigzag – X – second structure. The second structure labeled intermediate wave (Y) is most likely to be a flat correction. Within the flat correction minor wave B must reach a minimum 90% the length of minor wave A at 1,201.98.
Overall the structure for primary wave 4 should take up time and move price sideways, and the second structure should end about the same level as the first at 1,434. Primary wave 4 may not move into primary wave 1 price territory. This wave count is invalidated with movement above 1,532.90.
Within intermediate wave (Y) minor wave B downwards is an incomplete corrective structure, and at this stage the structure may be either a single zigzag (as labeled here) or a double zigzag (relabel A-B-C to W-X-Y). When minute wave b is finally confirmed as complete then I will have two hourly wave counts for the two possibilities of the next downwards wave: either an impulse for a C wave or a zigzag for a Y wave.
If minor wave B is a single zigzag then within it minute wave b may not move beyond the start of minute wave a above 1,392.30.
If minor wave B is a double zigzag, relabeled minute w-x-y, then within it there is no invalidation point for minute wave x. But X waves within double zigzags are usually relatively brief and shallow, as they very rarely make new price extremes beyond the start of the first zigzag in the double.
There is no Fibonacci ratio between subminuette waves i and iii. This makes it more likely we shall see a Fibonacci ratio between subminuette wave v and either of i or iii. I would expect subminuette wave v downwards to most likely be 0.618 the length of subminuette wave iii at $17, with the next likely length equal with subminuette wave iii at $27.50.
Subminuette wave ii was a deep expanded flat correction. So far subminuette wave iv looks like a relatively shallow flat correction. It may yet morph into a combination or even a running triangle. At this stage its structure is incomplete.
If subminuette wave iv is a flat correction then at 1,298 micro wave C would reach 1.618 the length of micro wave A, and subminuette wave iv would end slightly above the 0.382 Fibonacci ratio of subminuette wave iii.
Draw a parallel channel about this downwards movement using Elliott’s first technique; draw the first trend line from the lows of subminuette waves i to iii, then place a parallel copy upon the high of subminuette wave ii. Expect subminuette wave iv to remain within this channel, and subminuette wave v to end either midway or about the lower edge of the channel.
Subminuette wave iv may not move into subminuette wave i price territory above 1,308.32.
Movement to a new low below 1,273.43 would provide a breakout of this range and provide full confidence in this wave count.
At this stage yesterday’s alternate wave count looks very strange and unlikely. The new low below 1,287.03 changes the structure of recent downwards movement and it can no longer be seen as a completed simple zigzag. It is possible that this could still be a correction as a double zigzag, but that possibility looks increasingly unlikely today. So much so that I do not want to publish such a wave count.


Either one of my wave counts is wrong (in which case I’d expect Silver is wrong) or… they’re not going to move exactly in synch.
I’m expecting Silver to move sideways, not much up. Minor wave E should be very choppy and overlapping.
Meanwhile I’m expecting Gold to move lower. Within that movement there should be two upwards corrections.
I’m working on another idea for Silver… I should publish that next week. I think you’ll be happier with it. It would expect Silver to break out to the downside.
Finally, at a monthly chart level I would say it’s more that Gold follows Silver: http://elliottwavegold.com/2013/08/gold-elliott-wave-technical-analysis-29th-august-2013/
This time Silver has made a new low. Gold may follow.
This would be entirely in line with their historical relationship.
Lara, something does not add up. You abandoned the alternate hourly wave count (see yesterday’s post) and expect the downwards trend to resume, while you are clearly predicting a corrective upwave B in silver, up to 20.80-21.00. Since silver usually follows gold and in an amplified way, I cannot fathom how can you see gold and silver going in different directions. Any insights? Thanks,
No.
You can’t figure out what level it would end at, because we don’t know where it starts. Yet.
The length from it’s start to it’s finish (subminuette wave v) will be either 17 or 27.50.
If subminuette wave iv ends at my target 1,298 then the targets for subminuette wave v would be 1,281 or 1,270.5.
Lara, do you think the end of minuette 1 will be after the trend confirmation of 1273.43 or is it likely that minuette 1 ends before confirmation and we retrace for minuette 2, leaving us without confirmation until we are within minuette 3 down? Thanks,
Yes, that is possible.
However – if we see a very clear five down on the hourly chart that would add a lot of confidence to the wave count.
I would leave 1,273.43 as a confidence point, but I would have more confidence that the downwards trend has resumed.
I would not wait then for 1,273.43 to be breached to have confidence.
Does that make sense?
Got it. Very clear 5 down on the hourly trumps target. Thank you.
Lara, you mentioned, “I would expect subminuette wave v downwards to most likely be 0.618 the length of subminuette wave iii at $17, with the next likely length equal with subminuette wave iii at $27.50.
Would it be correct to assume that the full numbers are $1,217 and $1,227.50?