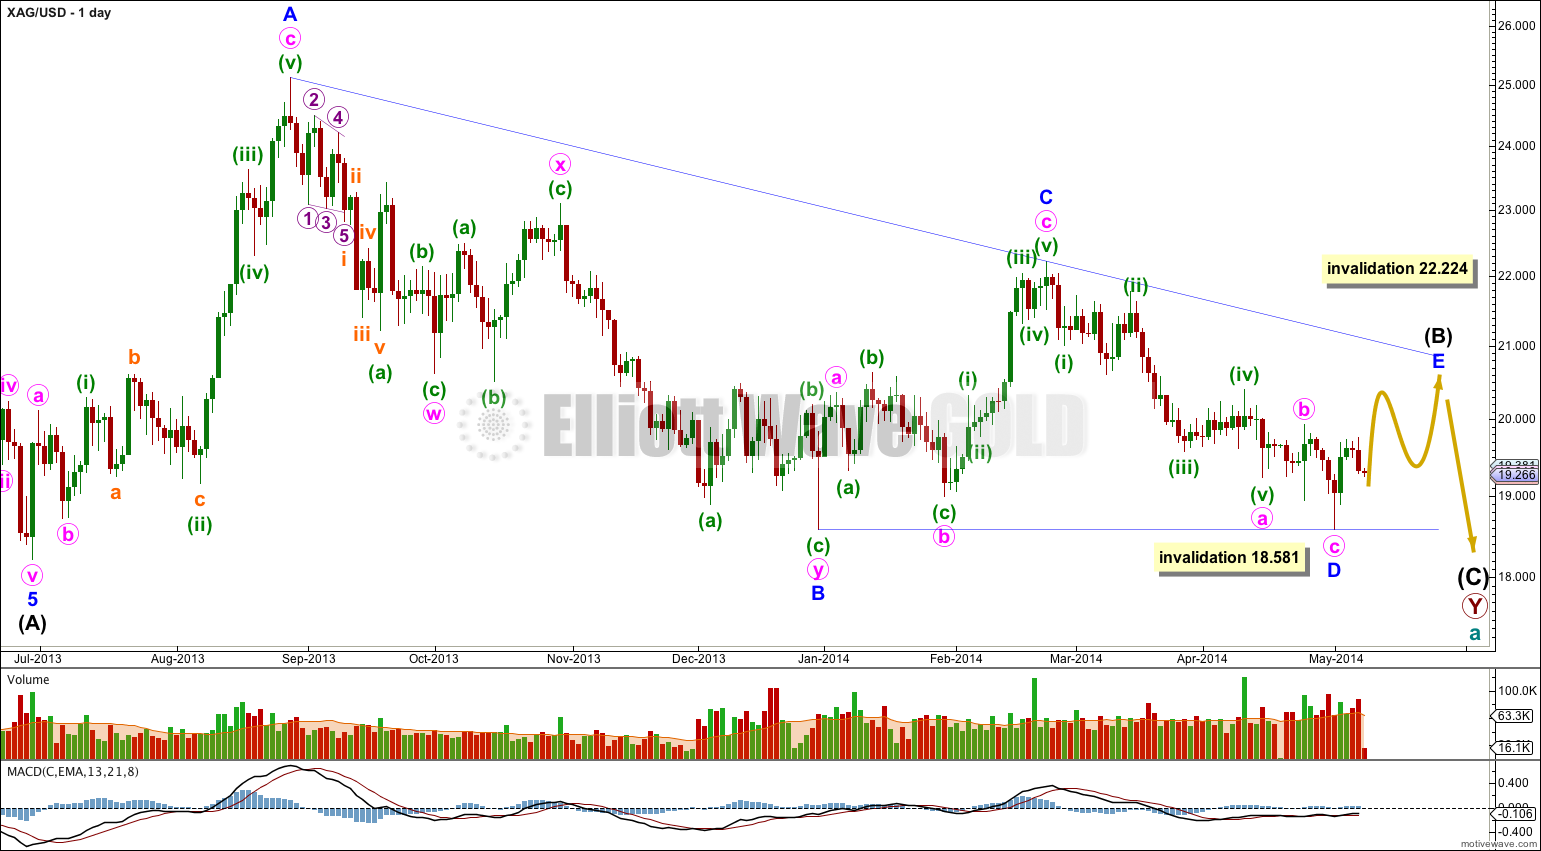
A new low slightly below 18.585 to 18.581 invalidated last week’s wave count for Silver.
I still expect a triangle is completing, but rather than a B wave within a B wave the triangle may be intermediate wave (B) in its entirety.
This makes no difference to the expectation of more sideways movement, but it makes all the difference to the expected direction of the eventual breakout. When sideways movement is done price should break out downwards.
Click on charts to enlarge.
It still looks like a triangle is forming at the daily chart level. The triangle fits best as a barrier triangle for intermediate wave (B). The B-D trend line is almost perfectly flat.
This wave count expects more choppy overlapping sideways movement with a decrease in volume, and momentum remaining close to zero, for at least another two weeks.
Within the barrier triangle minor wave D may not move substantially below the end of minor wave B. Although it looks most likely that minor wave D is complete now, it could move a little lower. As long as the B-D trend line remains flat this wave count will remain valid.
Minor wave E should subdivide as a single zigzag and may not move above the end of minor wave C at 22.224.
This main wave count expects price to break out to the downside once the sideways structure is complete.


There’s no way I can calculate a target for intermediate wave (C) to end when it has not yet begun.
You will find the bigger picture in the RH sidebar > categories > Historical Silver
Assuming we ARE in minor E of intermediate (B), what would your target be for (C)?
Do you have a chart which shows you current favored count from the high near 50?