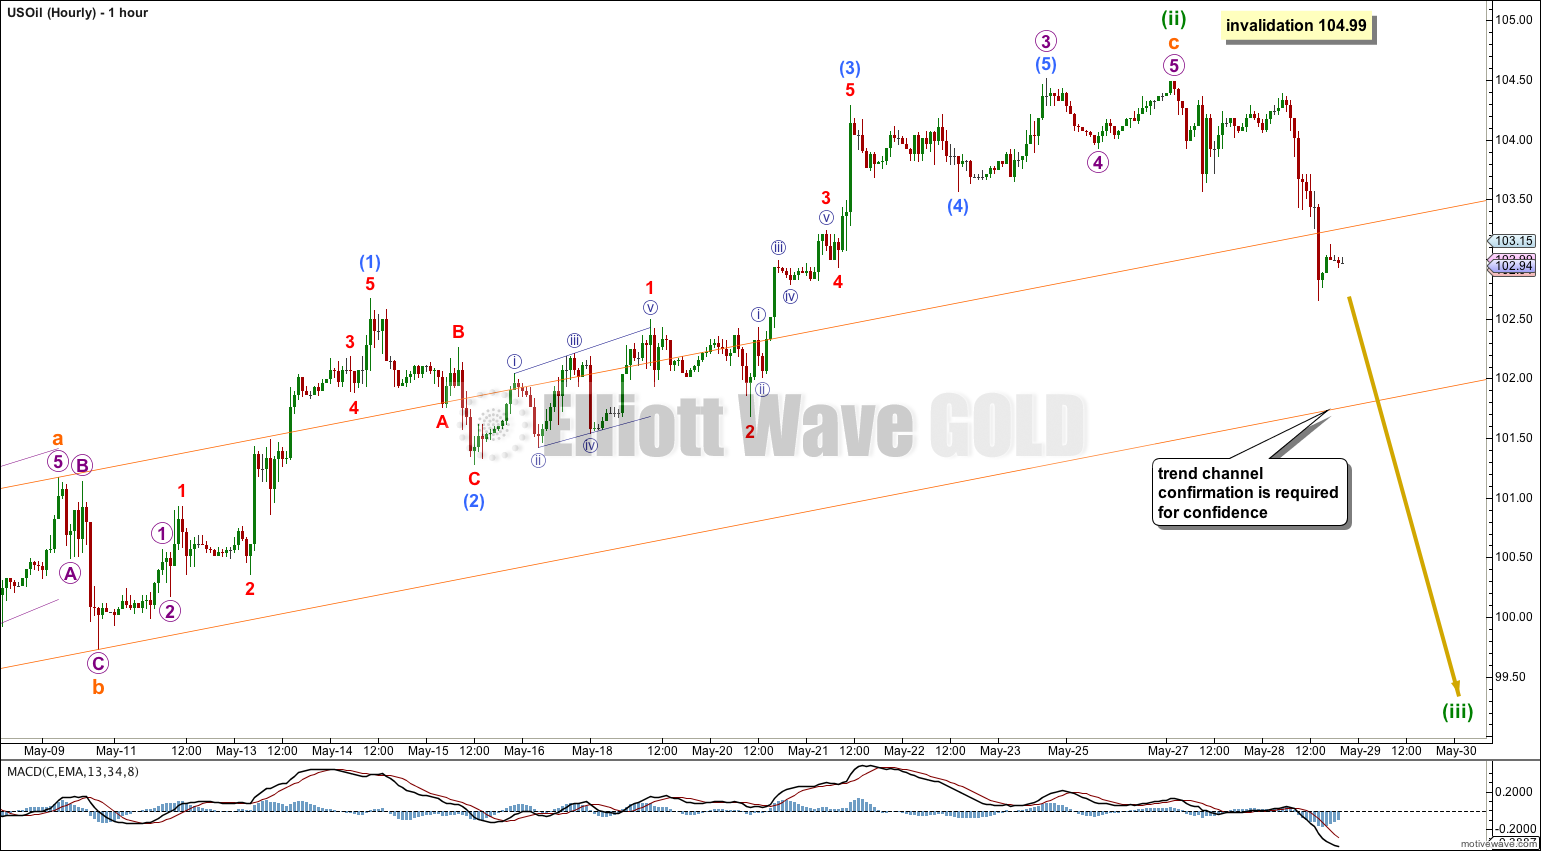
Last analysis expected that upwards movement was over and price should move lower. Price moved higher first, but remains below the invalidation point. Since reaching a high at 104.49 price has turned downwards.
Summary: I expect that upwards movement is over for now. A clear breach of the channel on the hourly chart would provide me with confidence that the middle of a third wave down has started. The target for the next wave down is 92.91 and may be reached in two to three weeks.
Click on charts to enlarge.
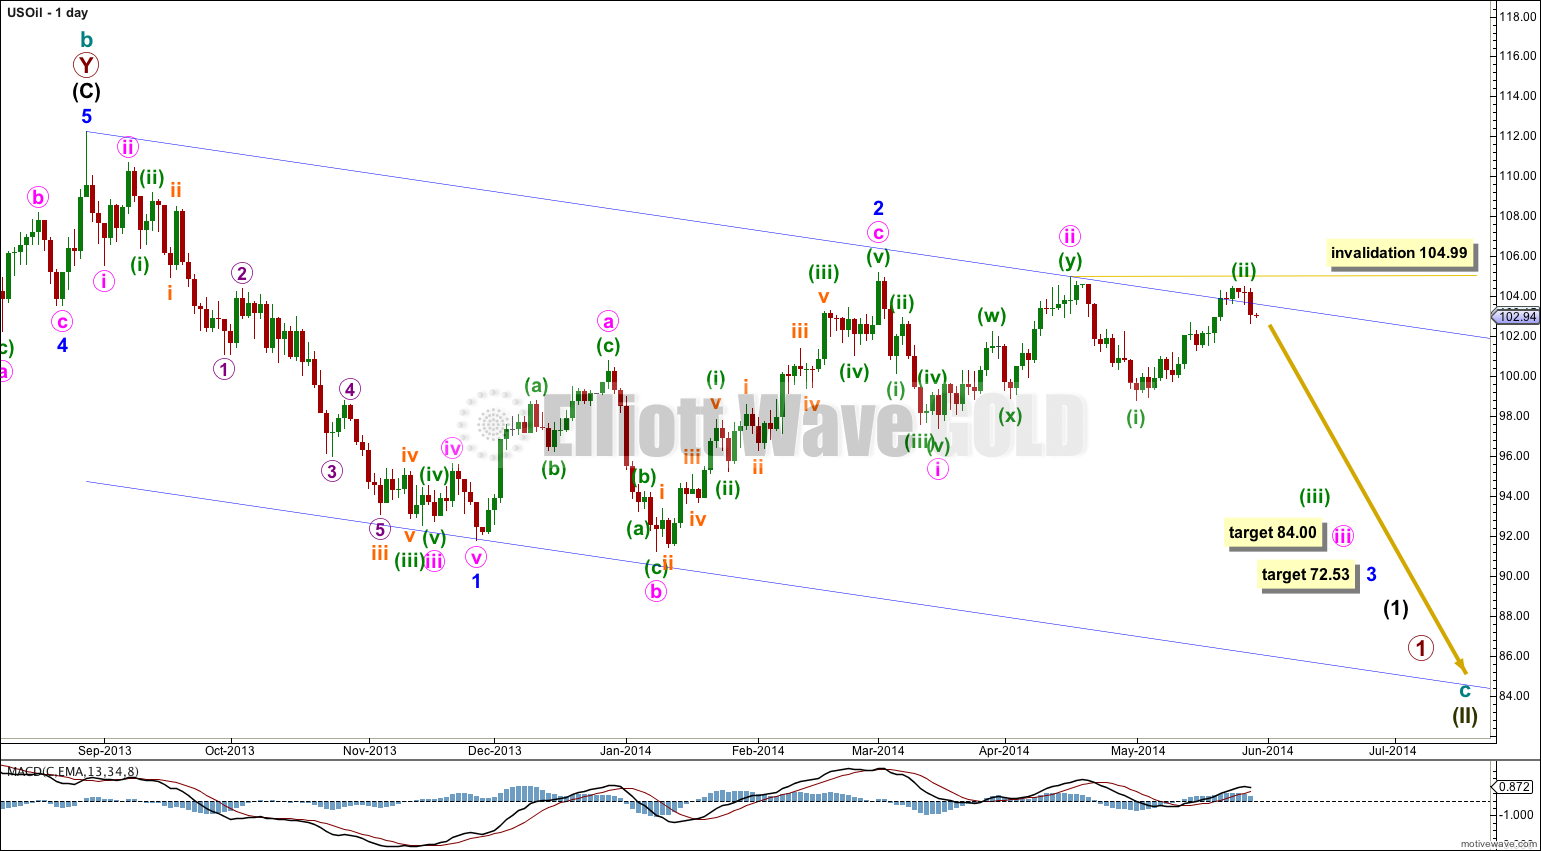
The daily chart shows all of the start of cycle wave c downwards.
Minor wave 1 subdivides perfectly as an impulse and minor wave 2 as an expanded flat correction, which is a 66% correction of minor wave 1.
At 72.53 minor wave 3 would reach 1.618 the length of minor wave 1. Minor wave 1 lasted 65 days, and I would expect minor wave 3 to be extended so longer in duration. It may last a total Fibonacci 89 days.
I have slightly adjusted the base channel about minor waves 1 and 2 to a “best fit” channel. I would expect upwards corrections to find resistance at the upper edge of this channel, and the third wave down should have enough momentum to break through support at the lower edge of the channel.
Minuette wave (ii) may not move beyond the start of minuette wave (i). This wave count is invalidated with movement above 104.99.
Minuette wave (ii) moved higher. There is no Fibonacci ratio between subminuette waves a and c.
There has not been a breach of the orange channel containing minuette wave (ii). This is still required before I would have any confidence that the trend has changed to downwards. While we do not have this confirmation I will allow for the possibility of more upwards movement. Minuette wave (ii) may not move beyond the start of minuette wave (i) above 104.99.
When this orange channel is breached then I would move the invalidation point down to the start of minuette wave (iii) and calculate a target for minuette wave (iii).


It sure is taking its time isn’t it! That’s okay. This is really common at the beginning of strong third waves. They often begin with a series of first and second waves, which can be very deep. They convince us there will be no strong third wave, and they do that right before the third wave takes off.
It does look rather triangular on the daily chart I agree. But then you would have to fit the triangle into the bigger picture; it cannot be a second wave because second waves cannot be triangles.
The invalidation point is pretty close by at this time. If 104.49 is breached my wave count is horribly wrong, and I have to go back to the drawing board at the monthly chart level.
But if I’m right then I’d have more confidence once price gets back into that base channel on the daily chart and starts to show an increase in momentum.
We shall see. Next week may give us confidence… or not.
Hi Lara,
Crude is just not giving up the way it should have been. Do
you think it may still start 3rd of 3rd or it is a
triangle and a prior uptrend may resume?