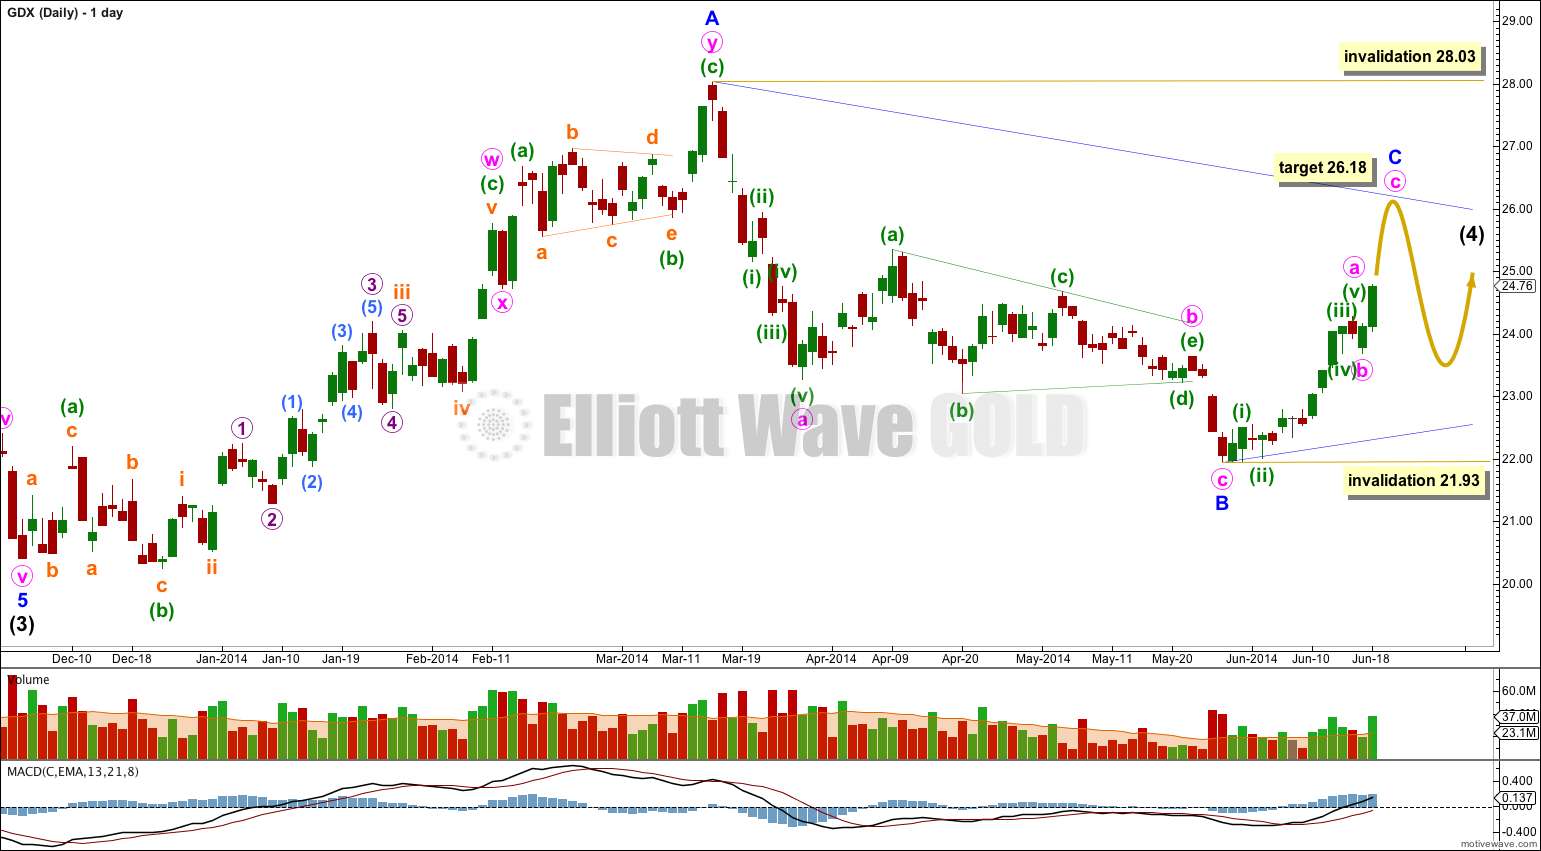
Last Elliott wave analysis three days ago expected upwards movement for GDX. The target for it to end is 26.18. At the time of writing it is getting very close to this target.
Click charts to enlarge.
The clearest piece of movement is the downwards movement from the high. This looks most like a first, second and third wave. This may be the start of a larger correction.
Intermediate wave (3) is $1.06 longer than 2.618 the length of intermediate wave (1).
Within intermediate wave (3) there are no Fibonacci ratios between minor waves 1, 3 and 5.
Ratios within minor wave 1 of intermediate wave (3) are: minute wave iii has no Fibonacci ratio to minute wave i, and minute wave v is $2.19 longer than 0.618 the length of minute wave i.
Ratios within minor wave 3 of intermediate wave (3) are: minute wave iii has no Fibonacci ratio to minute wave i, and minute wave v is $0.63 longer than 0.382 the length of minute wave iii.
Draw a parallel channel about this downwards movement. Draw the first trend line from the lows of intermediate waves (1) to (3), then place a parallel copy upon the high of intermediate wave (2). I would expect intermediate wave (4) to find resistance at the upper edge of the channel, and it may end there.
Intermediate wave (4) should last one to a few months.
I expect that intermediate wave (4) is completing as a regular contracting triangle. Within the triangle all the subwaves must subdivide as corrective structures, one may be a multiple, and four of the five waves must be zigzags or multiple zigzags.
So far minor wave A is a multiple so this means all the remaining subwaves must be simple A-B-C corrections. Minor wave A is technically a double combination so this means all the remaining waves must be simple zigzags.
Minor wave D may not move below the end of minor wave D at 21.93, although if the triangle is a barrier triangle minor wave D may end about the same level as minor wave B as long as the B-D trend line is essentially flat. This invalidation point is not black and white.
Minor wave C may not move beyond the end of minor wave A above 28.03. This invalidation point is black and white.
Overall this wave count now expects to see very choppy overlapping sideways movement for several weeks yet before this correction is over.


There are some really good reasons why I’m not going to do that detailed here:
http://elliottwavegold.com/2014/01/gdx-elliott-wave-technical-analysis-29th-january-2014/
I subscribe to both S&P500 and Gold, but what I really want is a daily analysis of GDX. Just customer input.
Hi Lara,
what is with this count…
http://goldseiten.de/artikel/209653–Gold—Warten-Sie-auch-noch-auf-die-finalen-1.000-USD.html
Looking at the second chart I can see a few problems with that wave count:
Within the five up both the second and fourth wave corrections are labeled as very rare running flat corrections, and the analyst has ignored a fairly clear triangle because it is in a second wave position.
The downwards wave looks like it has been labeled with two ideas, a main and an alternate idea. Both look valid.
However, there is no detail of how the analyst sees the subdivisions of this wave count. And there is no bigger picture.
Elliott wave is fractal in nature. The wave count has to make sense at time frames higher and lower. Otherwise you’ll have more invalidations and your wave count is of less value. But this requires a LOT more work and effort.
Looking at the bigger picture it is difficult to see how a new impulse began at the low of 1,180.84. Look at the weekly chart; you will see that if the bigger downwards wave ended there then the second and fourth waves within the big downwards wave are way out of proportion. That looks very wrong.
Oh and finally, I can only comment on the charts. I cannot read German 🙂
Thanks for this update, Lara. I think it is possible that GDX would find resistance on the declining trend line of the triangle. However on this leg so far, miners have been outperforming metals by a large margin. If your triangle scenario is to work out, during the next rise ( perhaps in July ) gold miners should really fizzle out and fail to make a new high while gold does make a new high. Such radical change in behavior is somewhat hard to imagine. Rather, given the strong volume and money flow in miners, esp. GDXJ, I am guessing that GDX would still outperform gold during the next rise and the declining trend line would be broken and then triangle scenario may have to be rejected.
But I guess we will find out in over the next few weeks.
Thanks for your analytical work.
Lara,
Seems gold and gdx daily charts are mutually supportive. I appreciate that in moment of some confusion with gold you show both gold and gdx charts.
Suggestion: If you can get good data I suggest once per week (on same day) a chart for gold, silver and gdx. Great to be able to compare which confirms or points out possible problems in a wave count. Of course that is time consuming but maybe drop oil and use the time for a once per week side-by-side analysis of gold, silver and gdx ?