The target at 1,271 was met and exceeded by 3.97 during the last 24 hours. Upwards movement was expected for the short term.
However, I am making a judgement today to swap over the main wave count to the triangle idea for primary wave 4. This upwards movement does not look like a small second wave and now looks like something bigger is happening. The triangle idea fits perfectly.
Summary: Overall upwards movement is expected to continue for the next several days, with corrections along the way. In the short term I expect choppy overlapping movement for a correction to last about 24 hours and end about 1,263.79.
Click on charts to enlarge.
Main Wave Count.
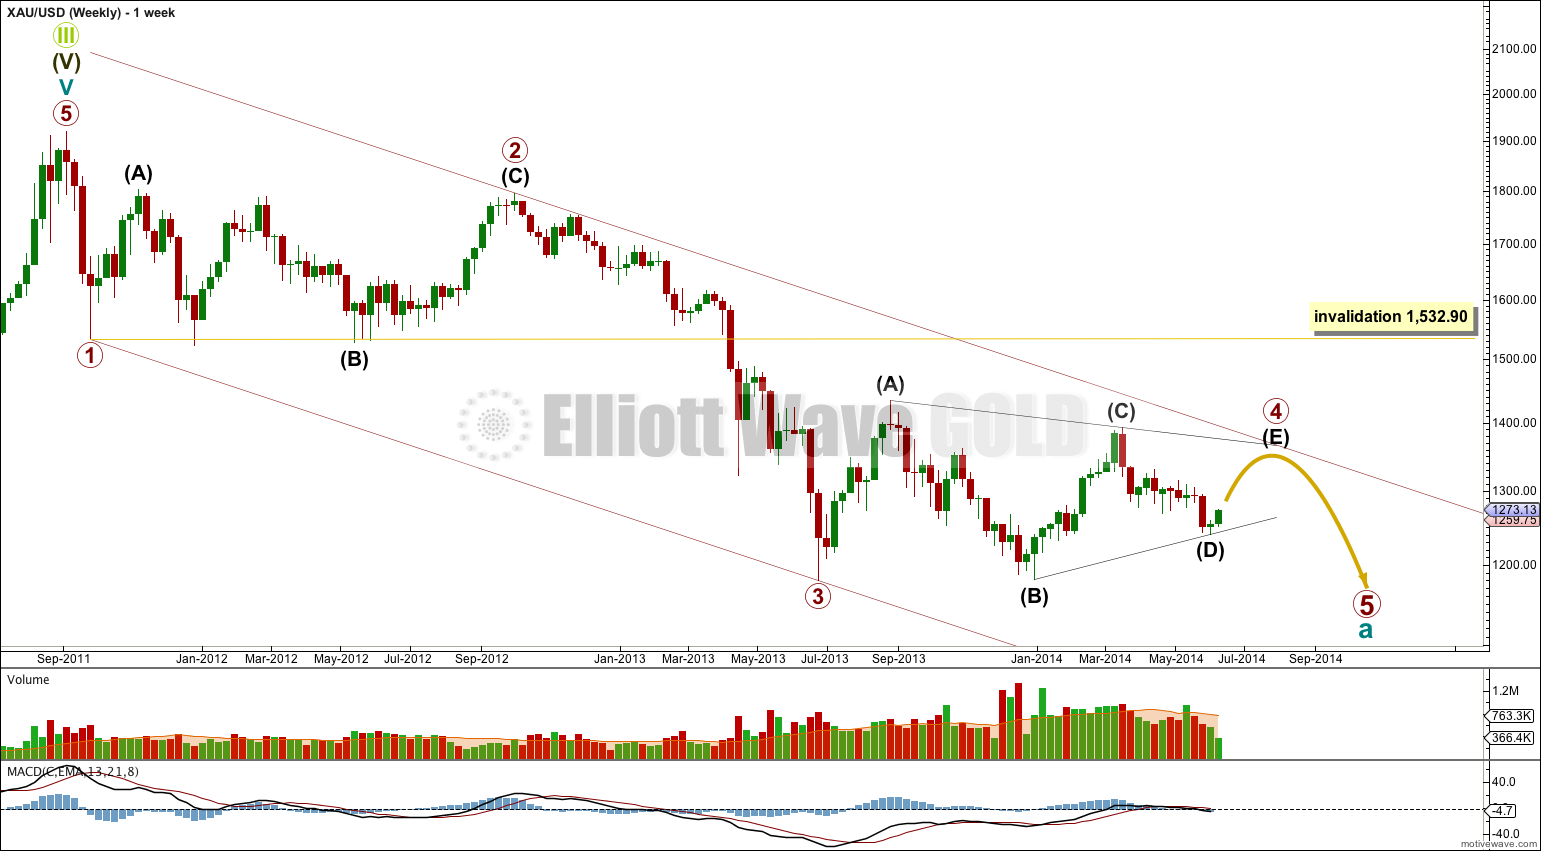
I am switching the main wave count at the daily chart level from seeing primary wave 4 as a combination to seeing primary wave 4 as a huge contracting triangle.
I am doing this today because upwards movement of the last seven days does not look like a second wave correction and looks more like a new upwards trend because it has lasted much longer than just the 2-3 days I was expecting.
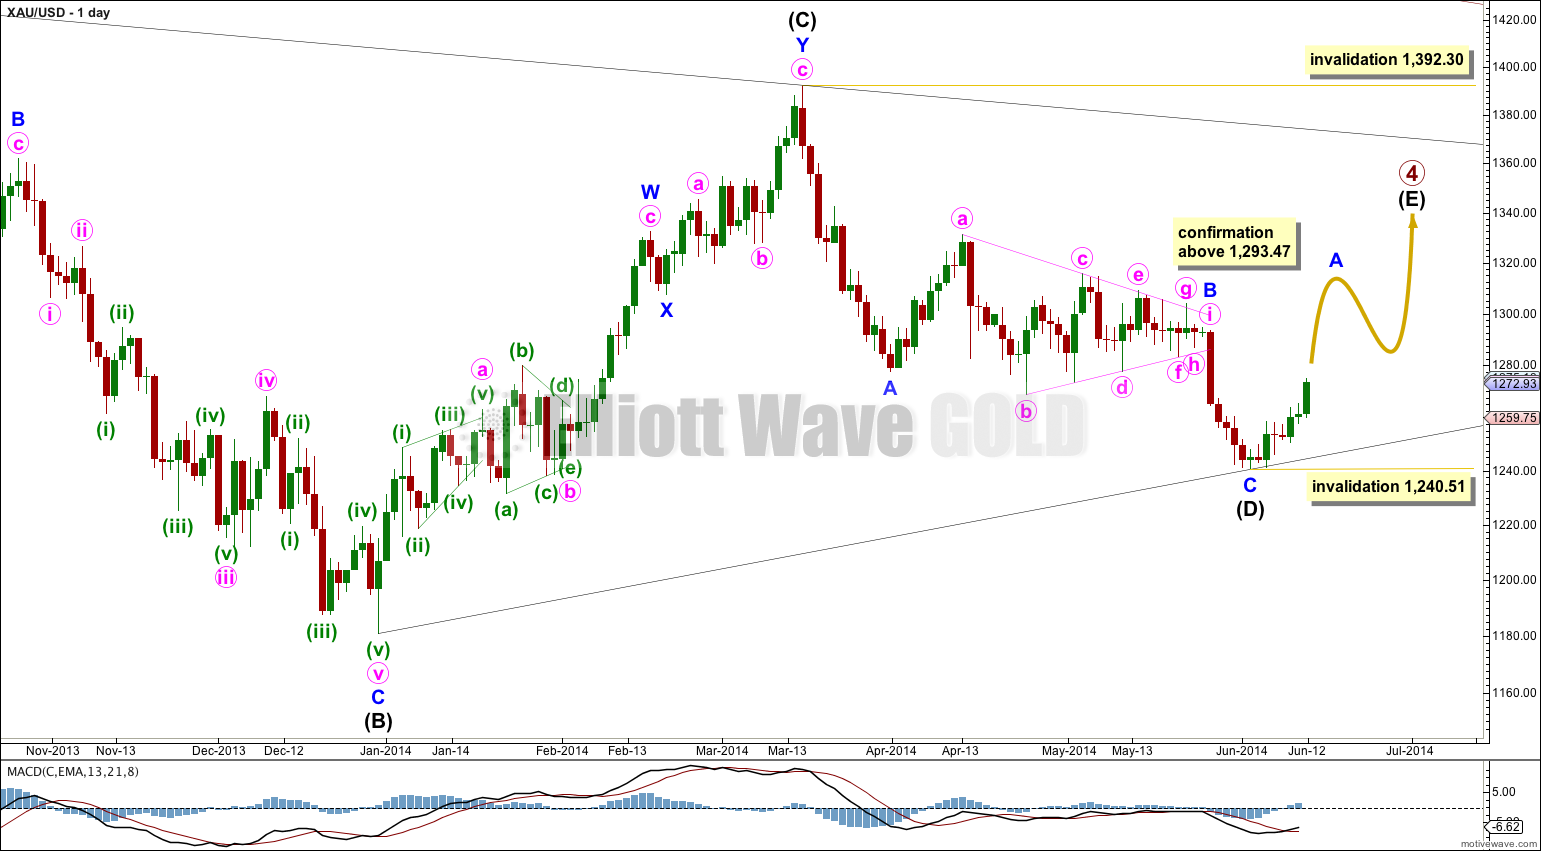
Within the triangle only the final wave for intermediate wave (E) needs to complete.
I would expect intermediate wave (E) to fall short of the (A) – (C) trend line, and if it was long lasting enough to reach that far it should find resistance at the upper edge of the maroon channel about the impulse of cycle wave a.
Primary wave 4 may not move into primary wave 1 price territory above 1,532.90.
Gold is still within a large fourth wave correction at primary wave degree which is incomplete.
Primary wave 2 was a rare running flat. Primary wave 4 is unlikely to be a flat correction because it is likely to show structural alternation with primary wave 2.
This wave count now expects the most likely structure for primary wave 4 is a huge triangle. The triangle is now within the final wave of intermediate wave (E) which should subdivide as a zigzag.
Intermediate wave (E) is most likely to be time consuming and fall short of the (A) – (C) trend line. It may also overshoot this trend line, but that is less common.
Within the zigzag of intermediate wave (E) minor wave B may not move beyond the start of minor wave A at 1,240.51.
The last piece of upwards movement is showing a strong increase in momentum. This fits with a third wave, and is a second reason for changing the wave count today. Yesterday’s wave count expected this last piece of upwards movement to be the end of a correction. That does not fit with momentum, and the structure of the correction was very atypical.
If this upwards movement is an impulse for minor wave A then momentum fits perfectly.
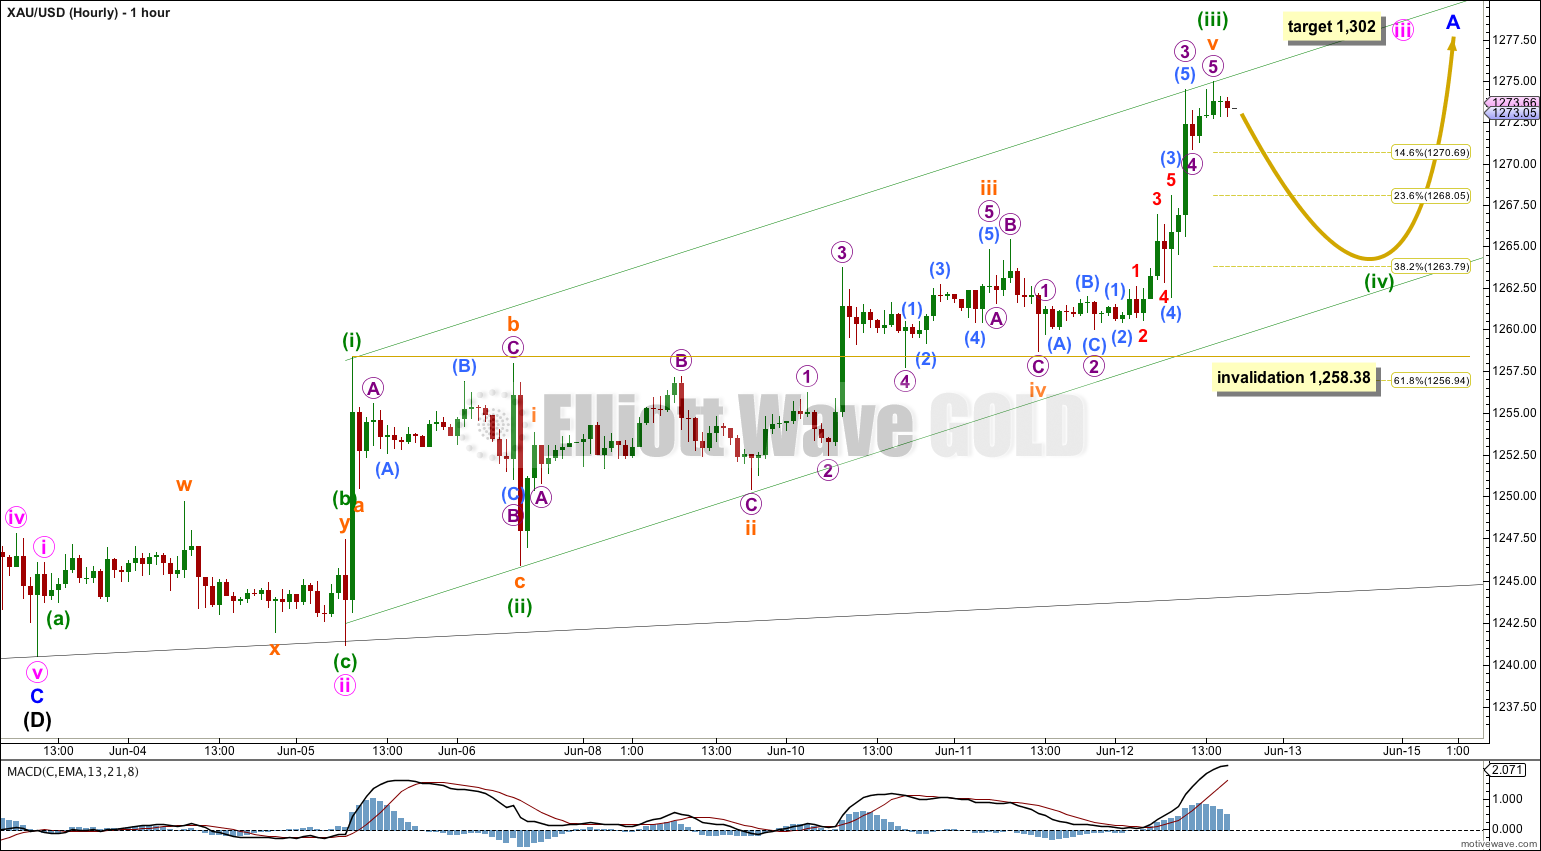
Within minute wave iii minuette wave (iii) is 1.19 longer than 1.618 the length of minuette wave (i).
Within minuette wave (iii) there are no adequate Fibonacci ratios between subminuette waves i, iii and v.
Within minor wave A minute wave iii is incomplete. Minute wave i was very short, and so at 1,302 minute wave iii would reach 11.09 the length of minute wave i. This is an unusual Fibonacci ratio, but it is mathematically correct and I have seen waves exhibit this ratio occasionally. When I know where minuette wave (iv) has ended then I would be able to calculate the end of minute wave iii at two wave degrees, so this target may widen to a small zone or it may change tomorrow.
At this stage I would expect sideways and lower movement over the next 24 hours as minuette wave (iv) moves lower. It may not move into minuette wave (i) price territory below 1,258.38.
Draw a channel about minute wave iii using Elliott’s first technique: draw the first trend line from the highs of minuette waves (i) to (iii), then place a parallel copy upon the low of minuette wave (ii). I would expect minuette wave (iv) to find support at the lower edge of this channel.
Minuette wave (ii) was a deep 72% zigzag correction. I would expect minuette wave (iv) to be a relatively shallow triangle, flat or combination. It would most likely end about the 0.382 Fibonacci ratio of minuette wave (iii) at 1,263.79.
Alternate Wave Count.
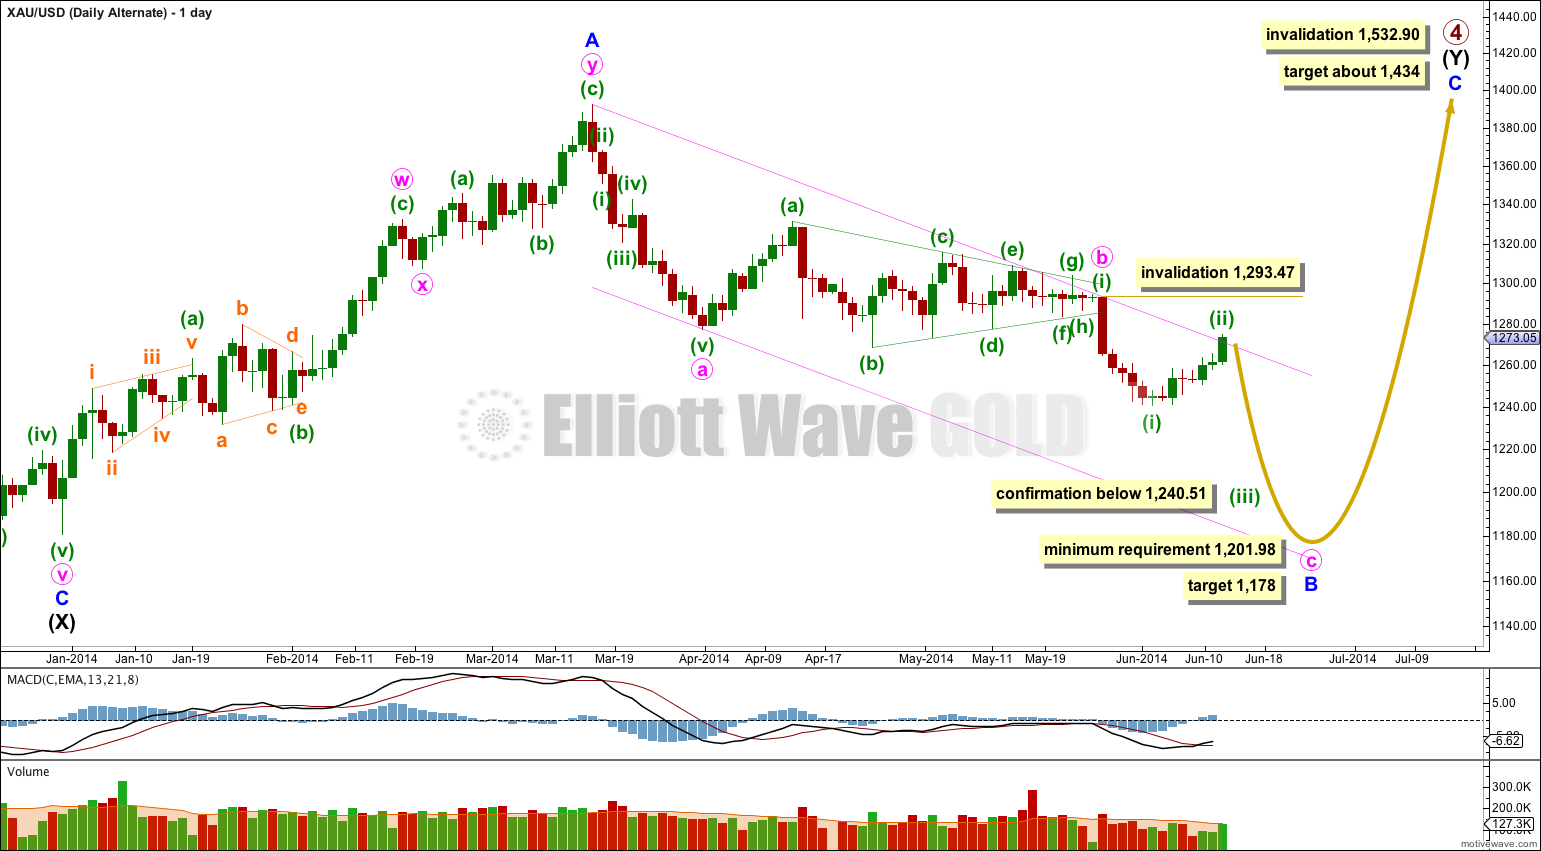
It is still possible that primary wave 4 is not a triangle but will complete as a double combination: zigzag – X – flat.
If the upper edge of the pink channel about minor wave B is breached by a daily candlestick above it then I would discard this wave count before the invalidation point at 1,293.47 is passed.
Minor wave B downwards within the flat correction must reach a minimum 90% length of minor wave A at 1,201.98. Within minor wave B minute wave c would reach equality with minute wave a at 1,178.
Within minute wave c minuette wave (ii) may not move above the start of minuette wave (i) at 1,293.47.
At this stage the duration of minuette wave (ii) looks wrong. This is why this wave count is now an alternate.
This analysis is published about 6:10 p.m. EST.


There are no rules, no.
If primary 4 falls short of the weekly chart channel then yes, that may herald a weak fifth wave that also falls short.
We will watch volume as primary wave 4 comes to an end, if it approaches the trend line on high volume we may see a throw over. But what is more likely is that volume will decline as the triangle completes and it may fall short of the trend line.
Gold does have a tendency though to have strong fifth waves, and this is more common than weak fifth waves.
Once the triangle is complete then I’ll play with the channel and find the best way to draw it.
From what I am reading here, it seems that if primary wave 4 develops as a huge triangle it would not have to end at the upper boundary of the weekly chart channel. If that is so, then could a primary wave 5 theoretically also fall short of the lower end of the channel and still be considered complete? Are there any rules about this? Thanks.
I think you’re right about it going up. The S&P is going down. Prechter published a semilog chart of the market versus Gold (not dollars) showing that we’re in a massive supercycle downtrend on the market (with respect to Gold). I think it is a balance between the euphoria of a never ending market boom (bullish scenario) and the pesimism of a market crash (bearish scenario). If Gold rockets up massively, then the stock market won’t look like it is crashing. Deception. The nature of the beast. This scenario would have the previous week low on Gold being the E point of a huge triangle on the weekly that brought Gold down to 61.8 % on the monthly. Now there’s a scenario for you, eh? Ha!