
Last analysis expected downwards movement with an increase in momentum. This is not what happened. Upwards movement above 104.49 invalidated the daily wave count.
I have a new wave count. A variation of prior analysis is an alternate wave count.
Summary: Price should move lower to a target at 97.04. The invalidation point is at 105.21.
Click on charts to enlarge.
Main Wave Count.

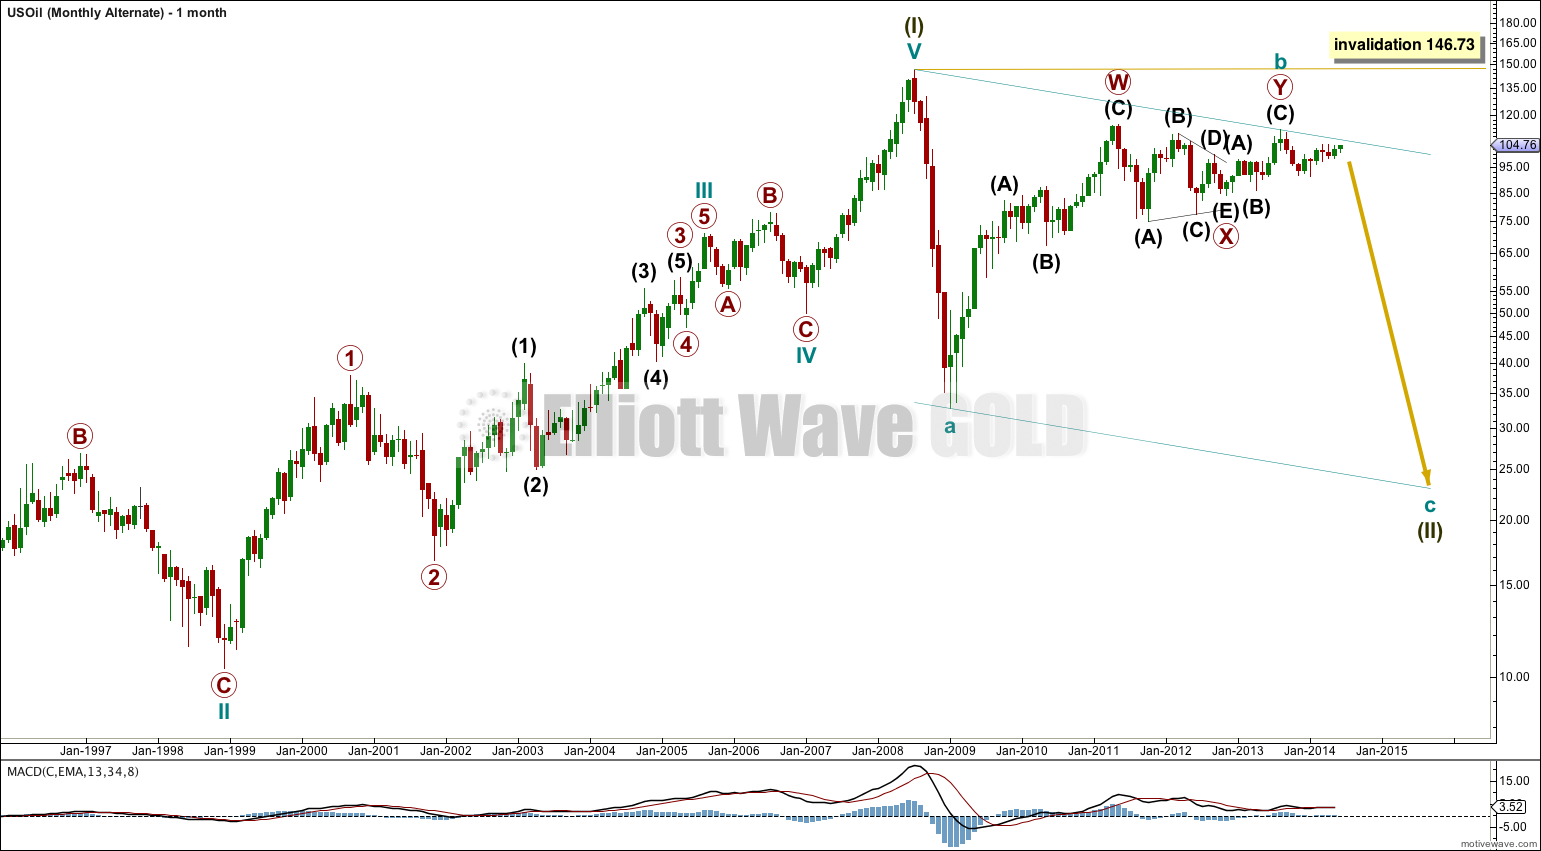
The one thing which looks most certain in this wave count is cycle wave a downwards is a five wave impulse. This means cycle wave b may not move beyond the start of cycle wave a above 146.73. Cycle wave b should subdivide as a three wave structure. It looks like a double zigzag which would be incomplete.
Within the double zigzag this wave count sees primary wave X as a regular contracting triangle, ending at 85.64 where intermediate wave (E) typically undershot the B-D trend line. The alternate analysis sees primary wave X triangle ending earlier at 84.07, and this is the key difference between the two wave counts.
Within primary wave Y intermediate wave (C) is incomplete. It would most likely move at least a little above the end of intermediate wave (A) at 112.24 to avoid a truncation.
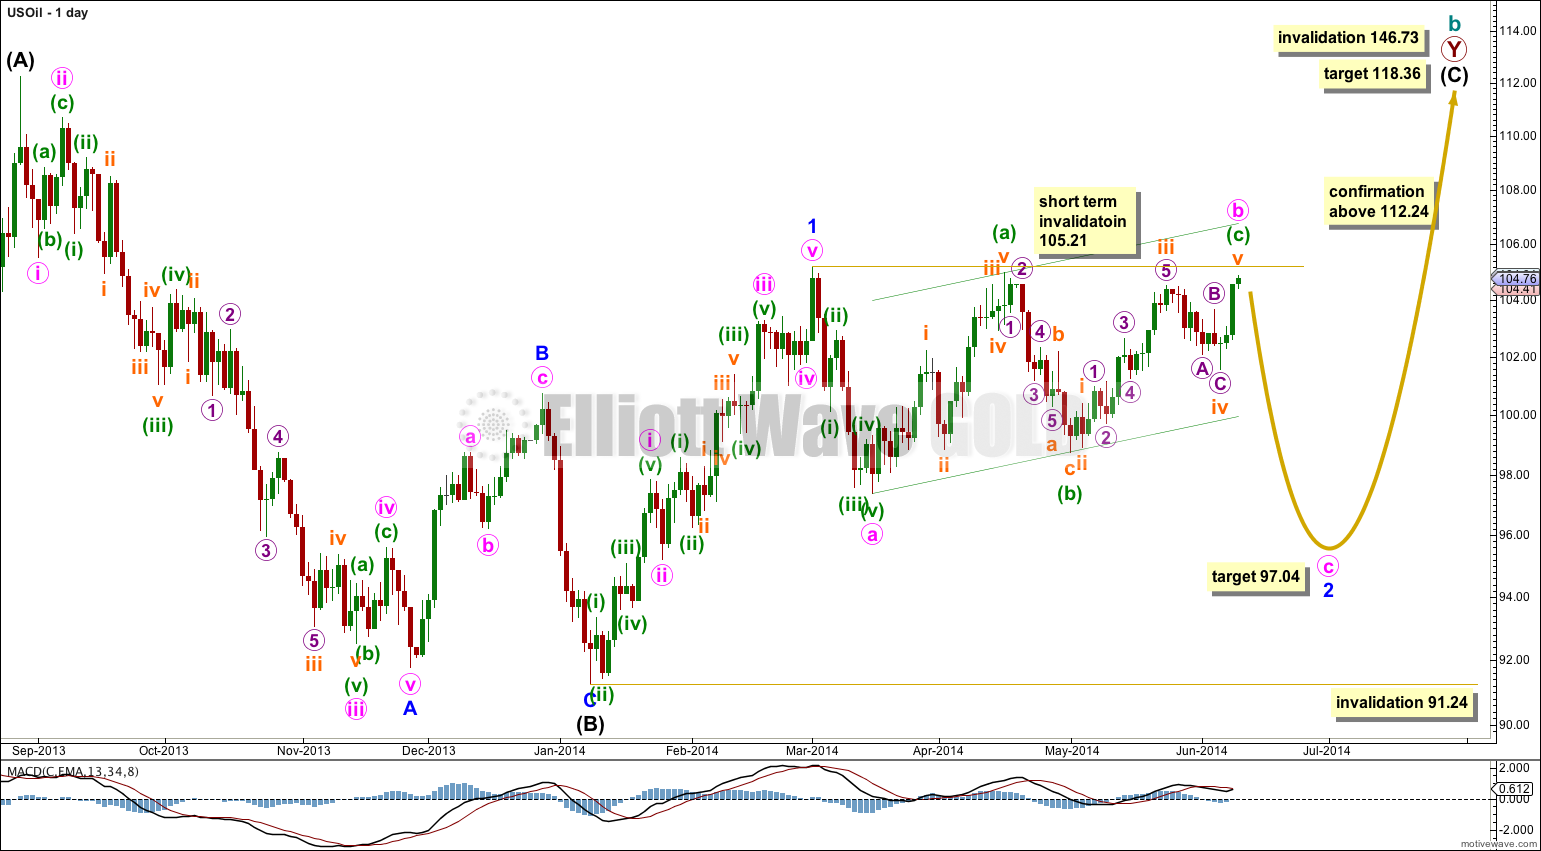
The daily chart shows the structures of intermediate waves (B) and (C) within the second zigzag of primary wave Y.
Intermediate wave (C) may subdivide as either an impulse or ending diagonal. It looks so far more like an impulse.
Within the impulse minor wave 2 is an incomplete zigzag. This part of the wave count sees minute wave a downwards within minor wave 2 as a five wave impulse. If this is correct then minute wave b may not move beyond the start of minute wave a at 105.21.
At 97.04 minute wave c would reach equality with minute wave a.
Minor wave 2 may not move beyond the start of minor wave 1 below 91.24.
Thereafter, this wave count would expect a third wave upwards.
At 118.36 intermediate wave (C) would reach equality in length with intermediate wave (A).
Movement above 112.24 (after minor wave 2 is complete) would provide confirmation of this wave count. At that stage the alternate below would be invalidated.
Movement above 105.21 would invalidate both wave counts at this stage. If this happens then my analysis of minute wave a downwards as a five wave structure is wrong. This would indicate minor wave 2 would be over and a strong third wave upwards would be underway. I would expect any invalidation above 105.21 to be followed by significant further strong upwards movement.
Alternate Wave Count.
This wave count follows on directly from last analysis.
Cycle wave b is here seen as complete. Within it primary wave X is a regular contracting triangle ending a bit earlier. This does not have as clean a fit as the main wave count.
Cycle wave c downwards would have begun.
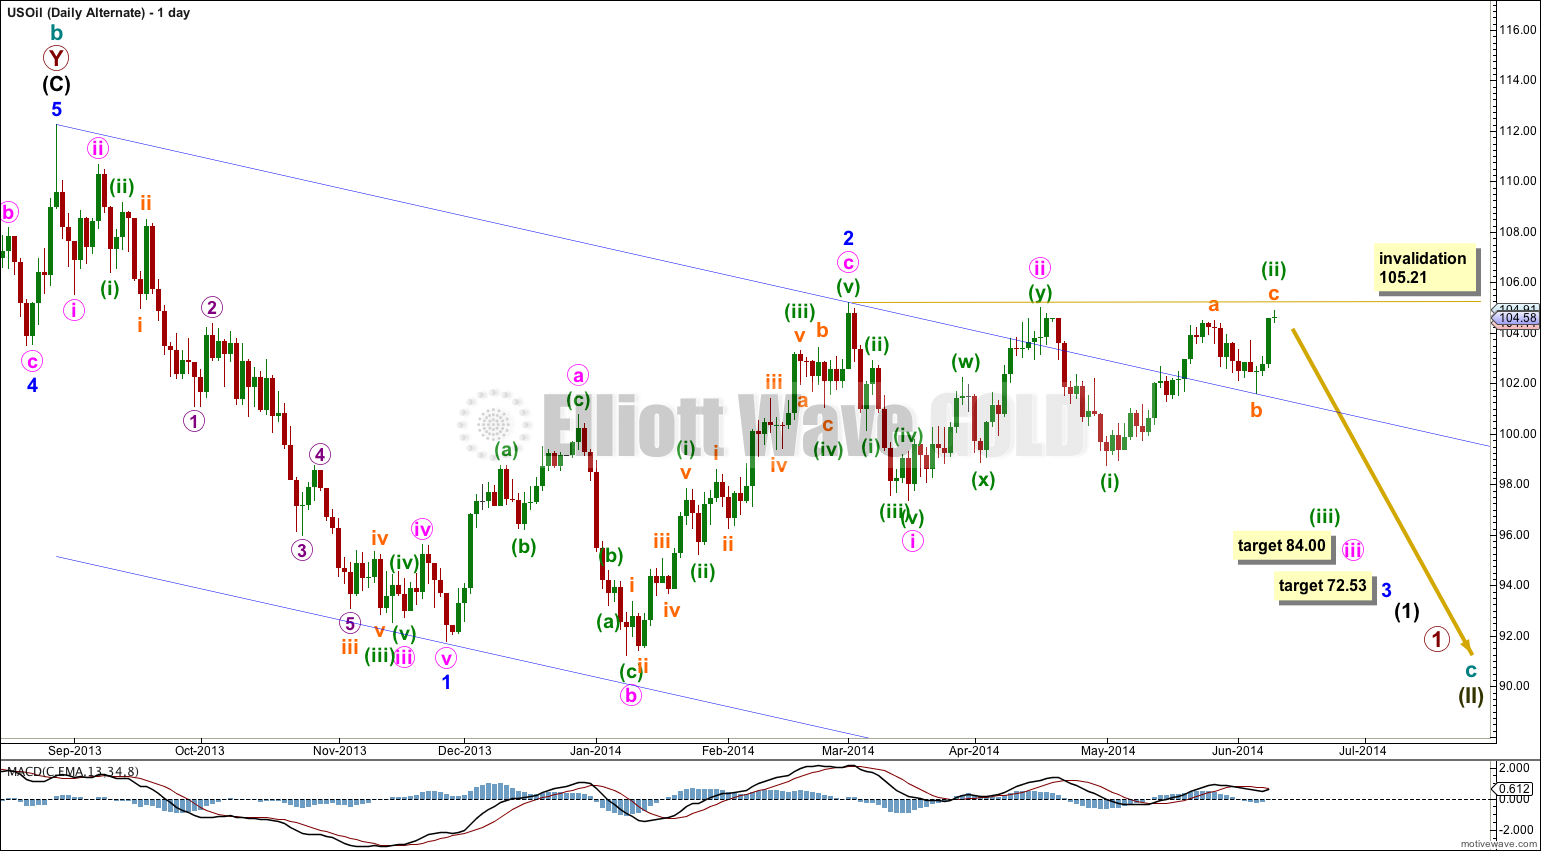
Within cycle wave c minor waves 1 and 2 would be complete. A base channel drawn about them is breached by upwards movement and this reduces the probability of this wave count.
At 84.00 minute wave iii would reach 2.618 the length of minute wave i.
At 72.53 minor wave 3 would reach 1.618 the length of minor wave 1.
This wave count requires an imminent strong increase in downwards momentum as the middle of a third wave begins. This now looks unlikely.
Minute wave ii (if it were to continue higher) may not move beyond the start of minute wave i above 105.21.
Lara,
Thank you for the clarifications and implications of the invalidation points.
Rodney