Downwards movement invalidated the alternate wave count and confirmed the main wave count.
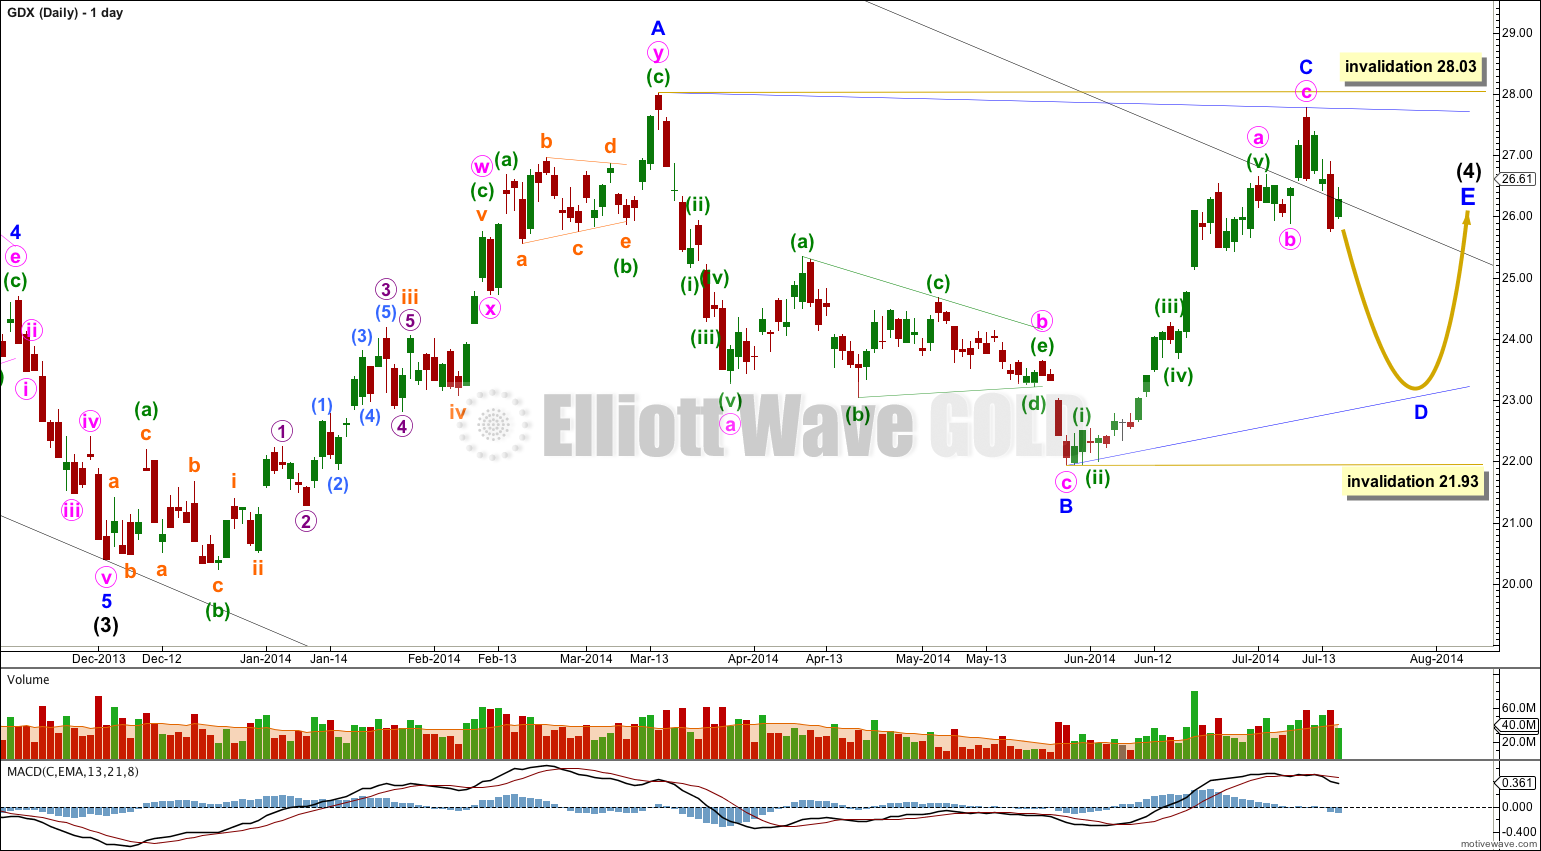
The main wave count expects downwards movement from here to about 23.10 to 22.81 in about four weeks time. However, I have a new alternate to consider today which has an extremely good fit and resolves some problems I had with the main wave count. After further consideration I may swap these two over. I may let Gold lead here.
Click charts to enlarge.
Main Wave Count.
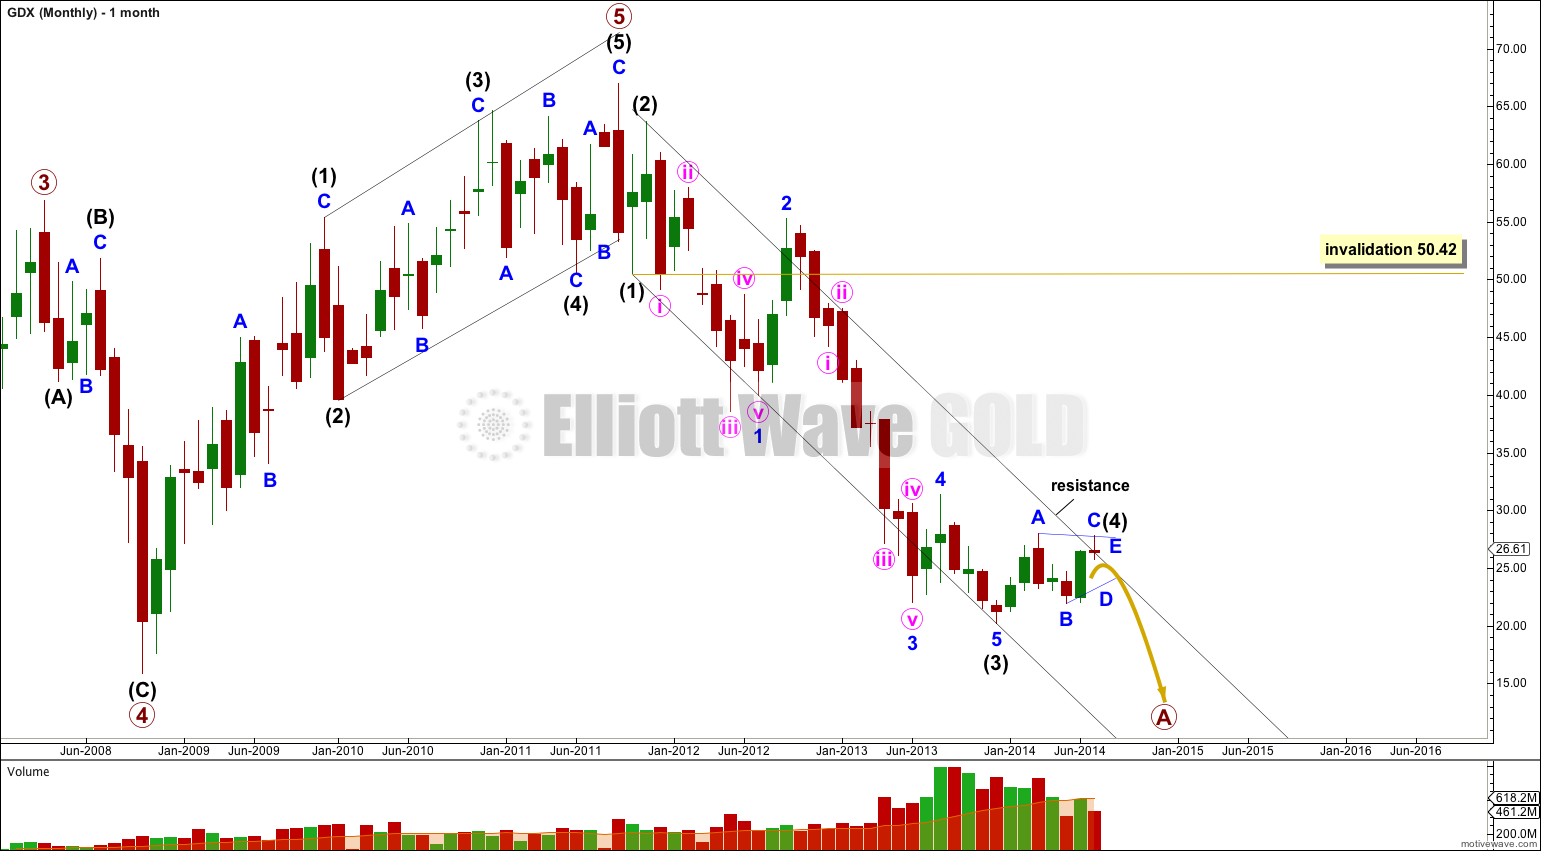
The clearest piece of movement is the downwards movement from the high. This looks most like a first, second and third wave. This may be the start of a larger correction.
Intermediate wave (3) is $1.06 longer than 2.618 the length of intermediate wave (1).
Within intermediate wave (3) there are no Fibonacci ratios between minor waves 1, 3 and 5.
Ratios within minor wave 1 of intermediate wave (3) are: minute wave iii has no Fibonacci ratio to minute wave i, and minute wave v is $2.19 longer than 0.618 the length of minute wave i.
Ratios within minor wave 3 of intermediate wave (3) are: minute wave iii has no Fibonacci ratio to minute wave i, and minute wave v is $0.63 longer than 0.382 the length of minute wave iii.
Draw a parallel channel about this downwards movement. Draw the first trend line from the lows of intermediate waves (1) to (3), then place a parallel copy upon the high of intermediate wave (2). Intermediate wave (4) to be finding resistance just above the upper edge of the channel.
Intermediate wave (4) should last one to a few months in total. I expect it to end in about six to eight weeks time.
If intermediate wave (3) ends at 20.38 on 3rd December, 2013, then this is where intermediate wave (4) begins. Minor wave A begins with an expanded flat correction and is technically a double combination. However, double combinations should move price sideways and should not slope against the main trend as this one clearly does. GDX is not a market I have been analysing for long, and so far it does not seem to have typical structures, but this problem is significant and the reason for looking for an alternate.
If intermediate wave (4) triangle begins with a double combination for minor wave A then all the remaining subwaves must be simple A-B-C structures, most likely zigzags.
Minor waves B and C are both zigzags.
A second problem now with this wave count is the shallow slope of the A-C trend line. A-C trend lines normally have steeper slopes than this one.
Minor wave D may end between about 75% to 85% of minor wave C between 23.10 to 22.81. It may not move below the end of minor wave B at 21.93. I would not accept a barrier triangle with a very shallow A-C trend line because it would look too atypical. The B-D trend line should have a reasonable slope.
If price moves below 21.93 the alternate below would be confirmed.
Alternate Wave Count.
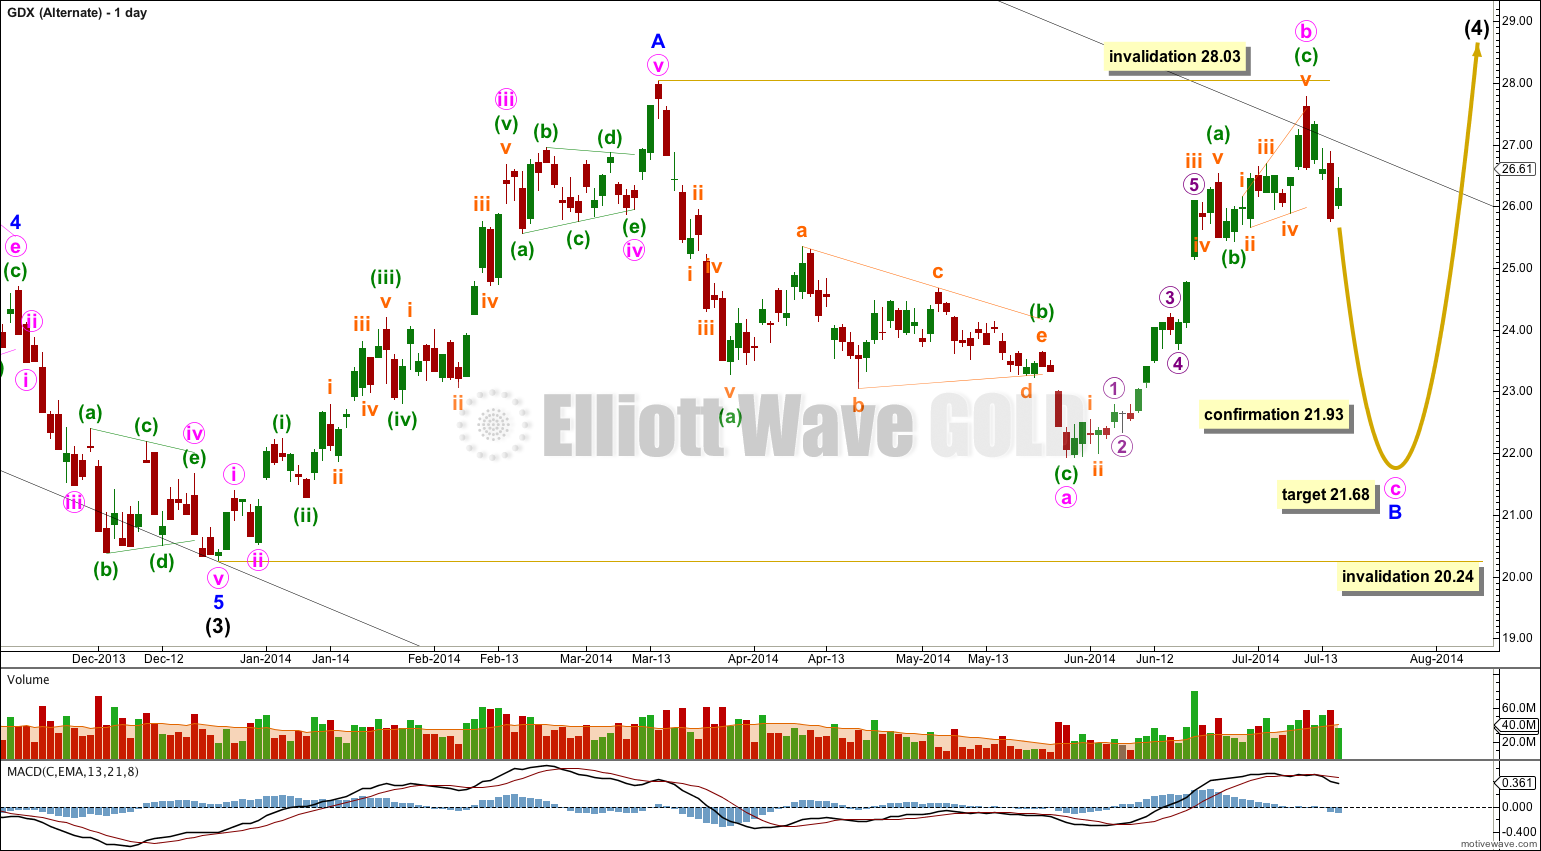
If intermediate wave (3) ends a little lower, at the price low at 20.24 on 23rd Dec, 2013 then there is a nice running contracting triangle for a fourth wave just prior to the end. Although this is out of proportion to its counterpart minute wave ii zigzag, triangles and zigzags of the same degree are often disproportionate.
Minor wave A now fits better as a five wave impulse. There are no adequate Fibonacci ratios between minute waves i, iii and v. Minute wave iv shows alternation as a running contracting triangle, with the zigzag of minute wave ii.
Ratios within minute wave iii are: minuette wave (iii) is 14.70 longer than 1.618 the length of minuette wave (i), and there is no Fibonacci ratio between minuette wave (v) and either of (i) or (iii).
Minor wave B may be unfolding as a regular flat correction: minute wave a subdivides as a zigzag and minuette wave b is also a zigzag with a 96% correction of minute wave a. At 21.68 minute wave c would reach equality in length with minute wave a.
Because minor wave A subdivides as a five then intermediate wave (4) must be a zigzag. Within the zigzag minor wave B may not move below the start of minor wave A at 20.24.
When minor wave B is complete then minor wave C should move at least a little above the end of minor wave A at 28.03 to avoid a truncation.
Minute wave a lasted 51 days and minute wave b lasted 30 days. Minute c may end about in about three to four weeks time.


Hi Lara, Can you look and see if there is a more bullish short term wave count for GDX that fits better with either of your Gold wave counts that show primary 4 is not yet complete? With these wave counts, Gold still needs to make a new interim high (1350+/-). Even before today’s big move up (7/17/14), I don’t see GDX going down to 23 or lower before first going up to complete it’s own Intermediate wave 4. I know that GDX and Gold don’t have to be exactly in sync, but I think GDX is likely to make a new interim high at around the same time as Gold completing Primary 4. Thoughts?
I noticed these charts are dated 7-17-14 but do not include the trading activity of today (7-17-14). Can we assume your wave counts were unaffected by today’s activity?
I checked both Yahoo and Google data. This is the latest data I can get. And yes, it does not seem to include the latest day.
I don’t know if the wave count was affected by subsequent days movement because I don’t have that data.
Here are today’s chart. Hit 61.8% retrace of the pull back.
http://www.tradingdevices.com/wp-content/uploads/2014/07/GDX15071714.pdf
http://www.tradingdevices.com/wp-content/uploads/2014/07/GDX60071714.pdf
http://www.tradingdevices.com/wp-content/uploads/2014/07/GDXDaily071714.pdf