Sideways movement has slightly breached the invalidation point on the hourly chart. The Elliott wave count at the hourly chart level is adjusted, but the target remains mostly the same.
Summary: One more downwards wave is required to complete this structure. The target can now be calculated at two wave degrees at 1,278 to 1,280. If the lower black (B)-(D) trend line is breached in the next few days then the trend should remain down for much longer.
Click on charts to enlarge.
Main Wave Count.
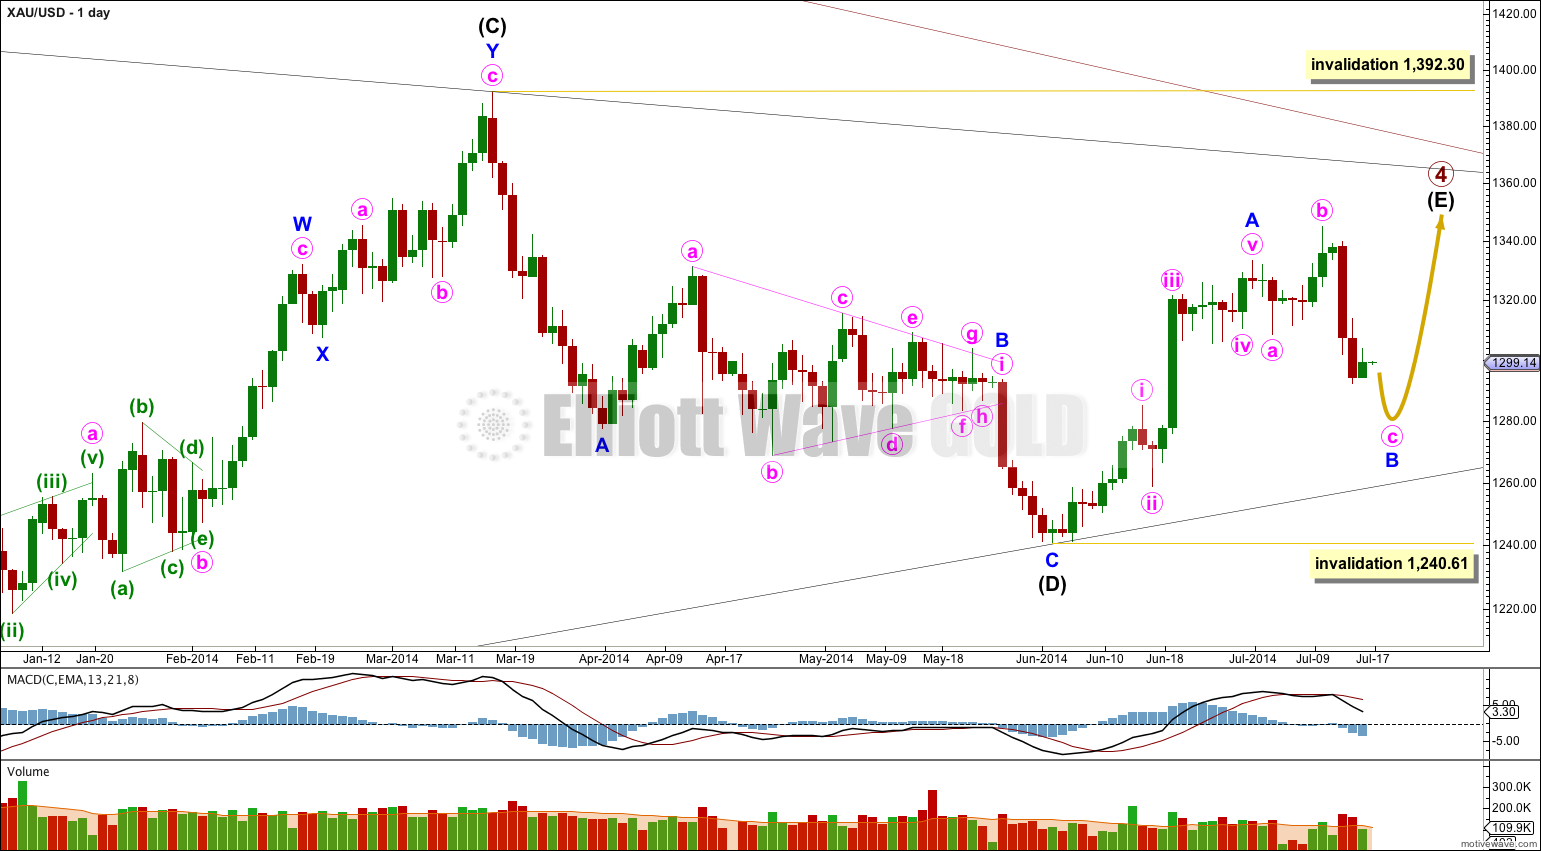
It is likely that only minor wave A is complete and sideways movement is an incomplete minor wave B. This wave count could see primary wave 4 complete in a total 56 or 57 weeks, just one or two weeks longer than a Fibonacci 55. So far primary wave 4 is in its 55th week.
Minor wave B may not move beyond the start of minor wave A below 1,240.61. Invalidation of this wave count at the daily chart level would provide full confidence in the alternate wave count.
If minor wave B moved substantially lower it should find very strong resistance at the (B)-(D) trend line. A breach of this trend line would look very atypical and at that stage this main wave count would significantly reduce in probability, so much so I would discard it.
Minor wave B is seen here as an expanded flat correction. Within it minute wave c is almost complete. When minor wave B is complete I can then calculate a target upwards for minor wave C to complete intermediate wave (E) using the ratio between minor waves A and C. I may be able to do that tomorrow or the day afterwards for you.
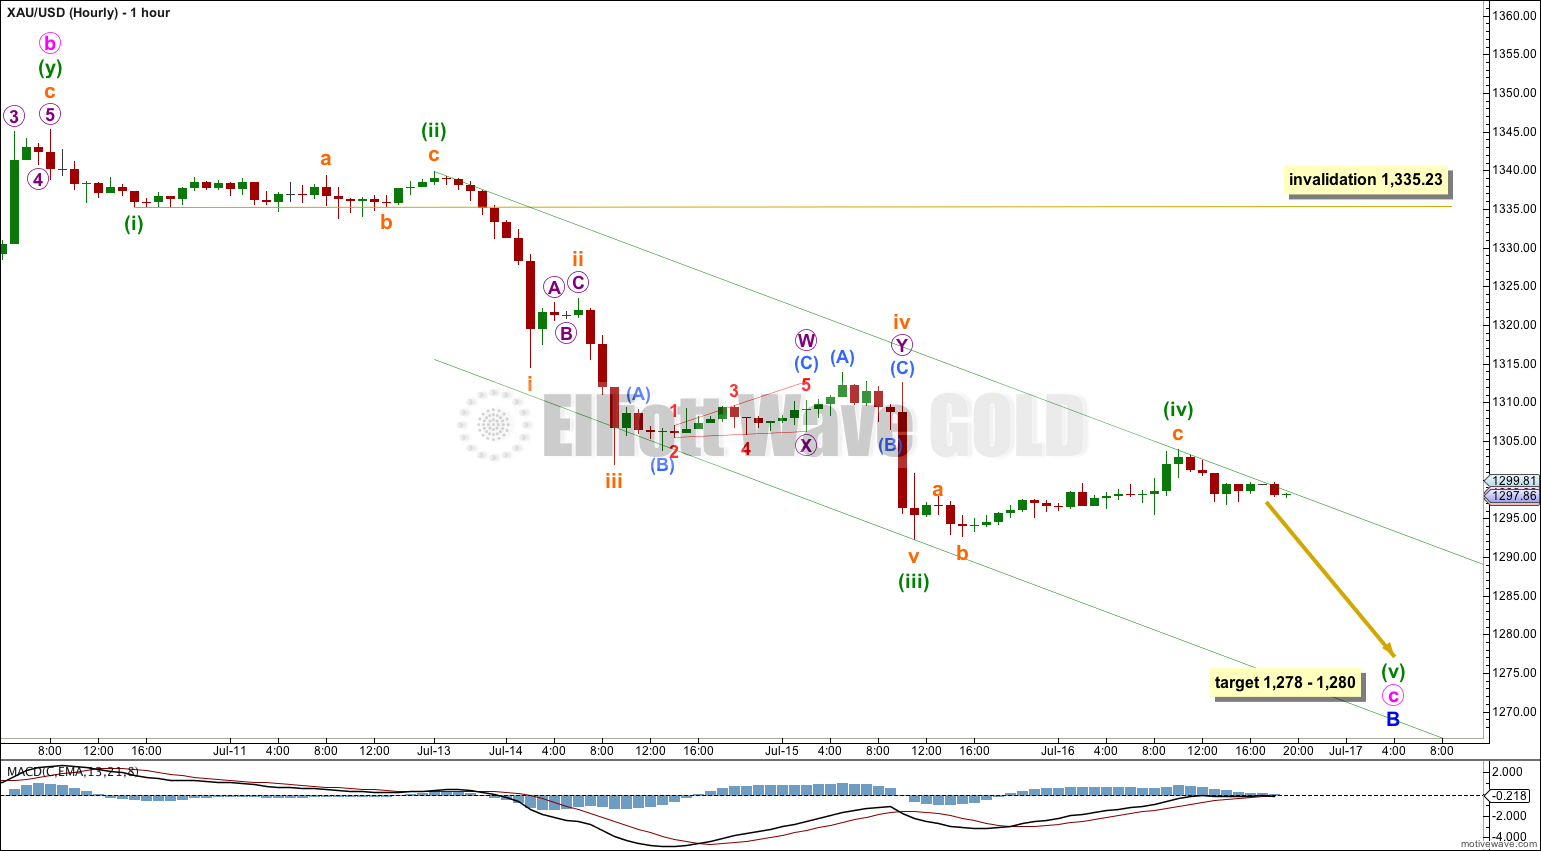
Yesterday’s labeling on the hourly chart was invalided. This labeling fits nicely and fits well with the look of this movement on the daily chart.
Within minute wave c the middle of the third wave has the strongest downwards momentum.
There is no Fibonacci ratio between minuette waves (iii) and (i). This makes it more likely we shall see a Fibonacci ratio between minuette wave (v) and either of (i) or (iii). At 1,278 minuette wave (v) would reach 2.618 the length of minuette wave (i). This is just $2 below 1,280 where minute wave c would reach 2.618 the length of minute wave a. This gives a $2 target zone with a good probability.
Ratios within minuette wave (iii) are: subminuette wave iii has no Fibonacci ratio to subminuette wave i, and subminuette wave v is just 1.19 short of equality with subminuette wave iii.
I have drawn a channel about this downwards wave using Elliott’s second technique: draw the first trend line from the ends of minuette waves (ii) to (iv), then place a parallel copy on the end of minuette wave (iii). I would expect minuette wave (v) to end most likely mid way within this channel.
Minuette wave (iv) may not move into minuette wave (i) price territory above 1,335.23.
When the channel is breached by subsequent upwards movement that shall be the first confirmation that minute wave c and so minor wave B are complete. At that stage this wave count would then calculate a target upwards for minor wave C.
Alternate Wave Count.
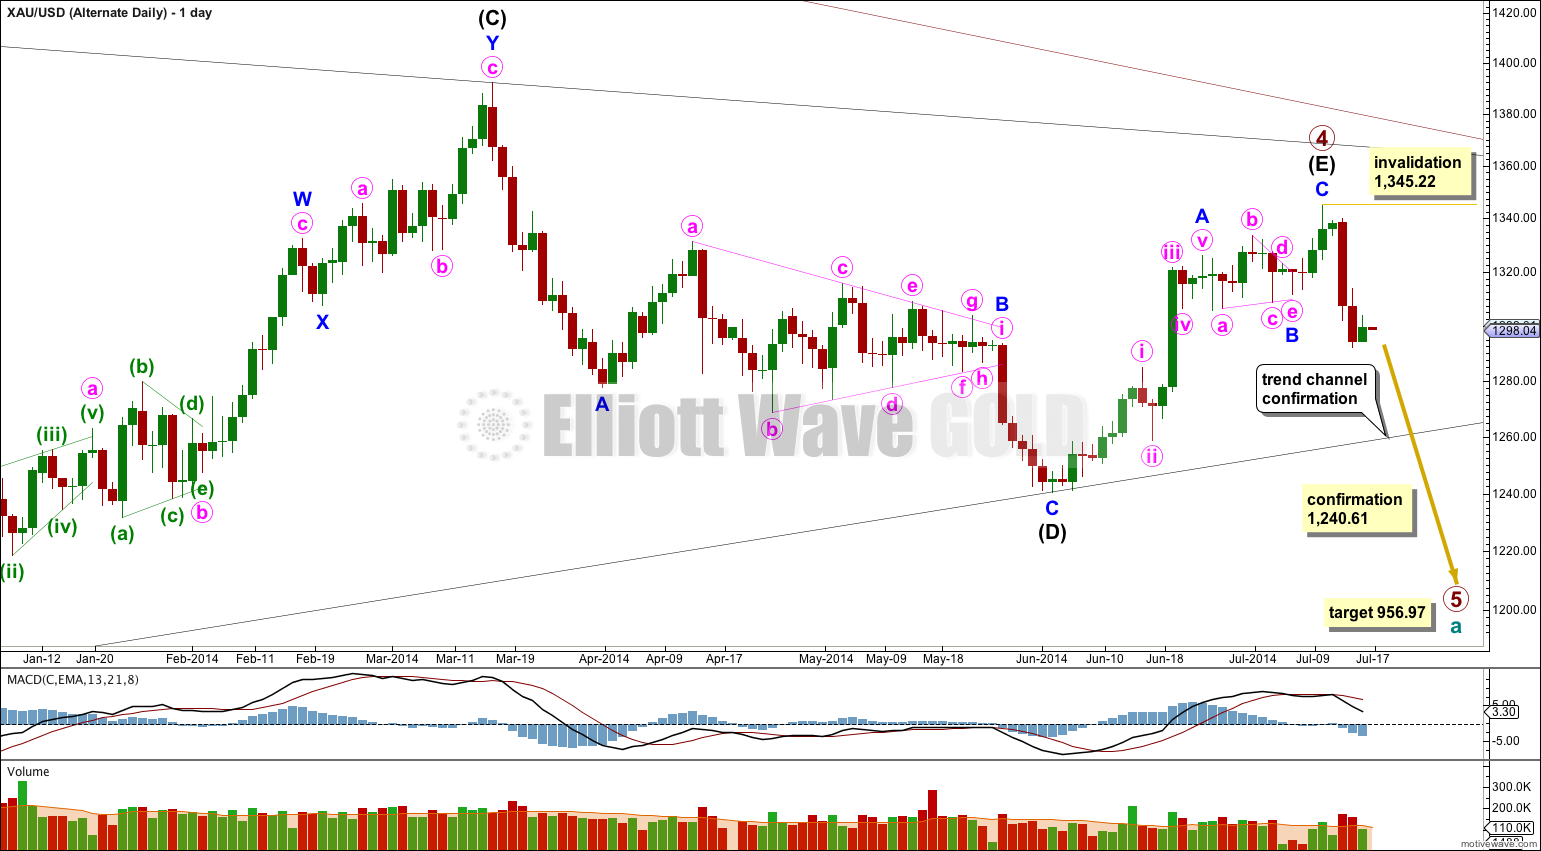
It is possible that primary wave 4 is complete in a total 54 weeks, just one short of a Fibonacci 55 and just one week longer than primary wave 2 which was 53 weeks in duration.
The subdivisions for this alternate do not have as neat a fit as the main wave count:
– The triangle for minor wave B has an overshoot of the b-d trend line within minute wave c which looks significant on the hourly chart.
– At the end of minor wave A minute wave v does not subdivide well as a five wave structure on the hourly chart. This movement fits better as a three.
– Minor wave C subdivides here as a five wave structure, but it has a much better fit as a zigzag (which is how the main wave count sees it).
For the three reasons above this alternate has a lower probability. I would judge it at this stage to have a 20 – 30% probability.
In the short term both wave counts expect more downwards movement, so there is no divergence in expectations. The differentiating point is the lower (B)-(D) trend line here on the daily chart. If this trend line is breached by a full daily candlestick below it and not touching it then I would discard the main wave count and this alternate would be my only wave count.
Final price confirmation would come with movement below 1,240.61. At that stage the main wave count would be fully invalidated.
At 956.97 primary wave 5 would reach equality in length with primary wave 1. Primary wave 1 was a remarkably brief three weeks in duration. Primary wave 5 could also be as brief, but it is more likely to show a little alternation and be longer lasting.
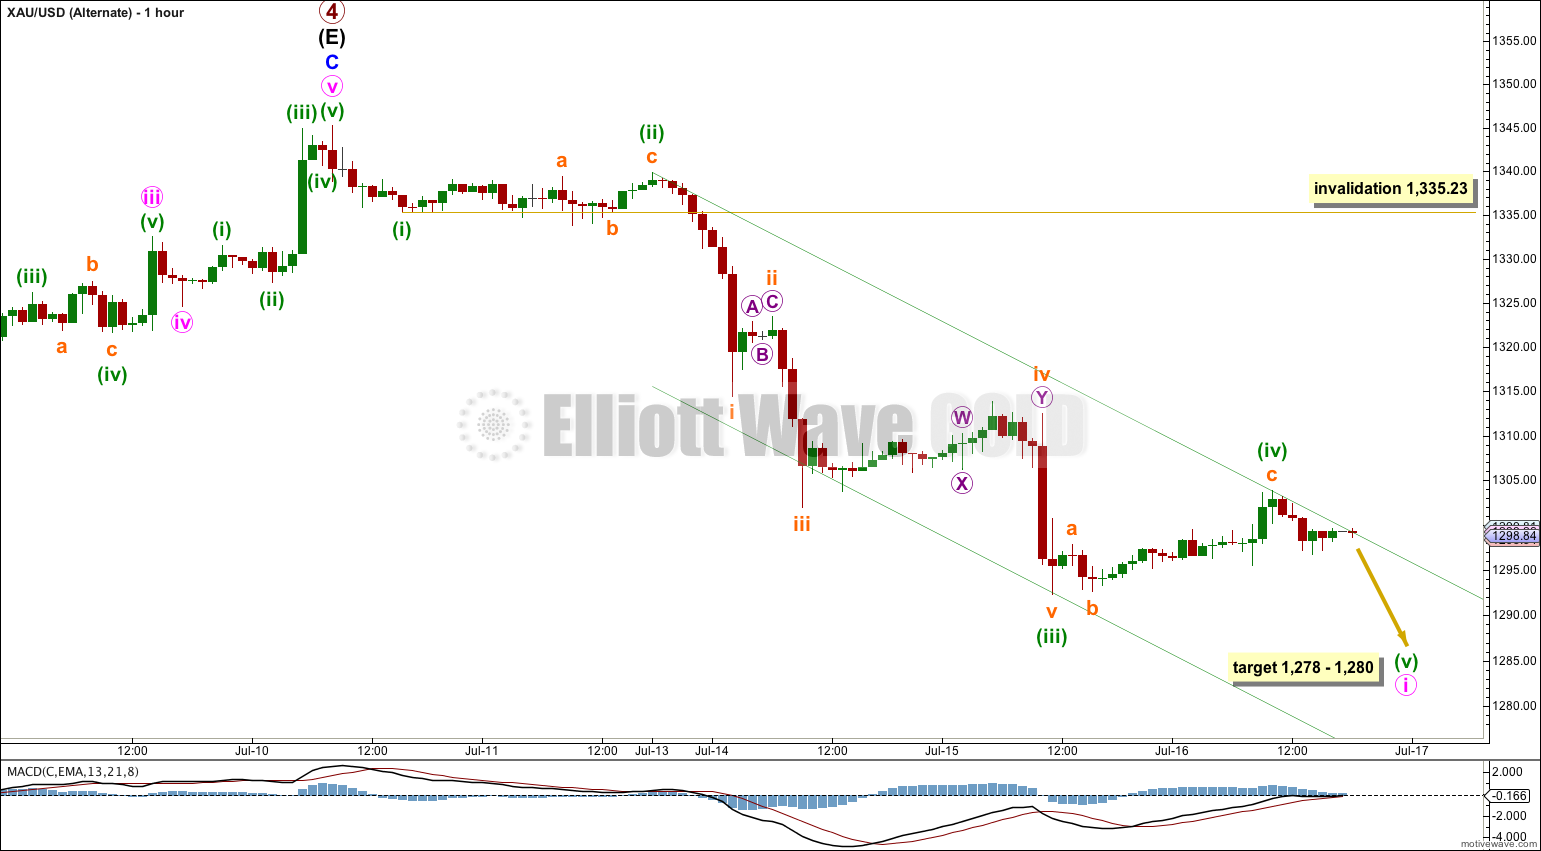
The labeling for this alternate wave count is the same as for the main wave count now for this piece of movement. I am confident now that this labeling is correct.
This alternate wave count has the same target for downwards movement.
For this alternate wave count when the first five down is complete for minute wave i a deep second wave correction would be expected for minute wave ii.
Minute wave ii may not move beyond the start of minute wave i above 1,345.22.
Within minute wave i minuette wave (iv) may not move into minuette wave (i) price territory above 1,335.23.
This analysis is published about 07:27 p.m. EST.


Could you please provide a quick hint as to where your analysis may be headed today? We are still under 1335, so technically speaking both wave counts may still be valid. Thanks.
Hi Lara,
There is a positive divergence showing on MACD.(1hr Chart). this suggests us, the trend is going to change to upwards soon. Are you still expecting 1280 as the target?
Thank you !