Movement below 1,291.83 confirmed the alternate wave count and invalidated the main Elliott wave count. By a simple process of elimination I now have just one wave count for you today.
Summary: The target for this downwards movement to end is 1,275 to 1,271. It should be over within the next 24 hours. Thereafter, a new wave upwards should begin which should move above 1,345.22.
Click on charts to enlarge.
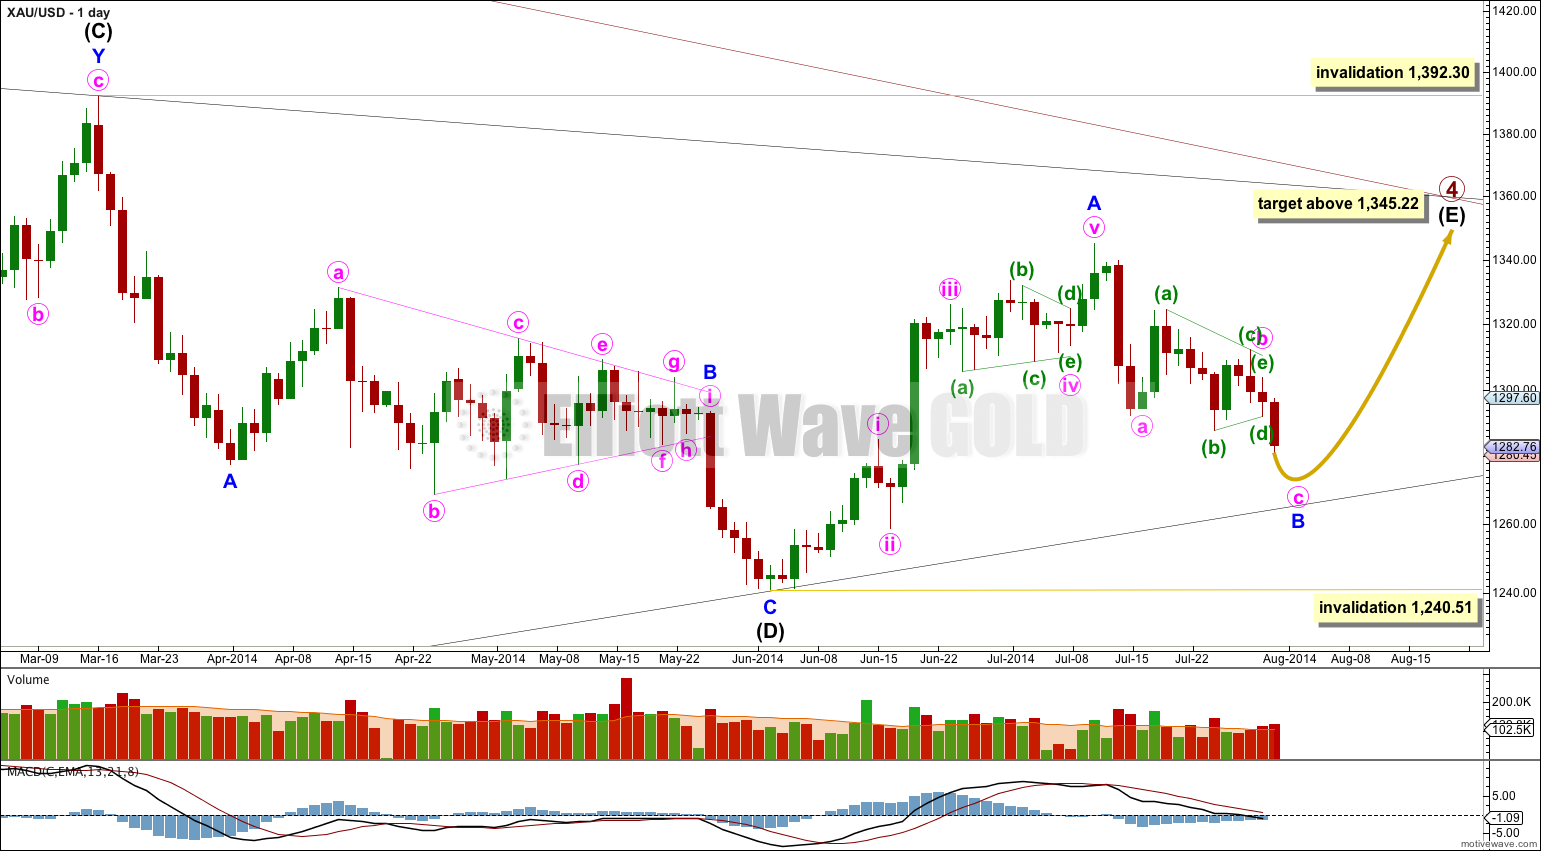
The main wave count sees primary wave 4 as an incomplete regular contracting triangle. Primary wave 2 was a deep 68% running flat correction. Primary wave 4 is showing alternation in depth and some alternation in structure.
Within the triangle of primary wave 4 intermediate wave (E) is unfolding as a zigzag: minor wave A is a five wave impulse and minor wave B downwards is an incomplete zigzag.
Because there is a clear triangle within this downwards wave of minor wave B this movement cannot be a new impulse to the downside because a triangle may not be the sole corrective structure in a second wave position. The position of this triangle indicates strongly that intermediate wave (E) is incomplete.
If minor wave B gets down as low as the black (B)-(D) trend line it should find very strong support there. Only a small intra-day overshoot could be contemplated if this wave count is correct. Minor wave B may not move beyond the start of minor wave A below 1,240.51.
When minor wave B is complete then I can calculate a target upwards for you for minor wave C. Because I do not know where it begins I cannot do that yet for you. Minor wave C is extremely likely to make at least a slight new high above the end of minor wave A at 1,345.22 to avoid a truncation. Intermediate wave (E) at its end is most likely to fall short of the (A)-(C) trend line. The other possibility is it may overshoot the (A)-(C) trend line and if it does that it may then find final resistance at the upper edge of the big maroon channel copied over here from the weekly chart.
Intermediate wave (E) may not move beyond the end of intermediate wave (C) above 1,392.30.
I can see one alternate possibility today. If primary wave 4 is over at the high labeled minor wave A within intermediate wave (E) then it is possible that primary wave 5 is beginning with a leading diagonal in a first wave position. However, leading diagonals in first wave positions are not very common, and I have never seen a zigzag for a first wave of a leading diagonal which has a triangle in its B wave position. This alternate idea is possible, but I judge it to have a very low probability, maybe as low as 5%. I will only publish this idea if the black (B)-(D) trend line is clearly breached.
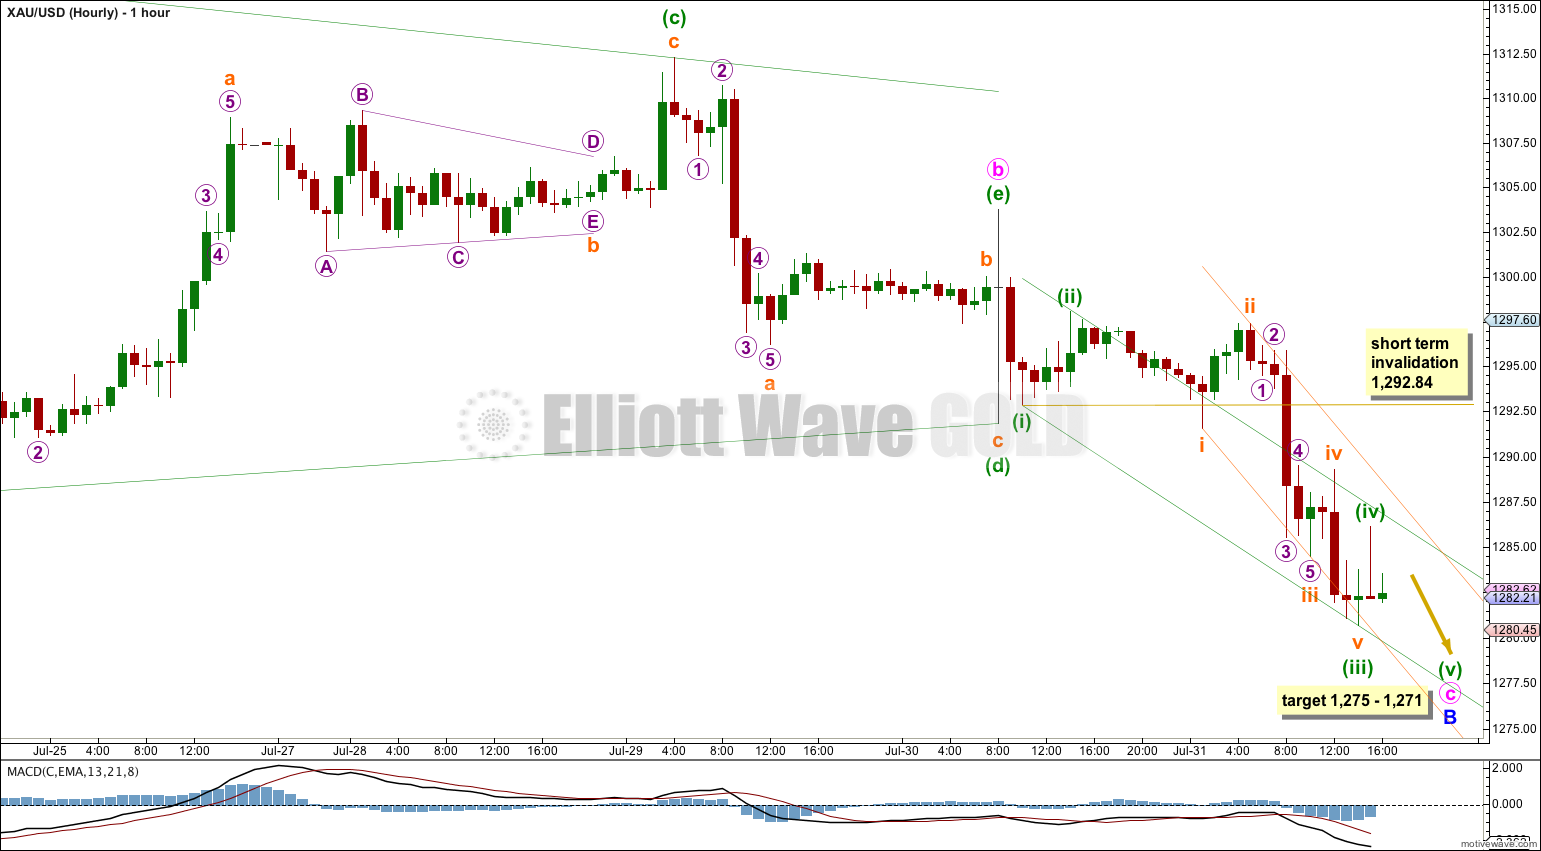
The triangle was most likely over at the high labeled minuette wave (e) at 1,303.77. Subsequent movement fits best as a series of first and second waves.
Movements following triangles are most commonly relatively short and brief. At 1,271 minute wave c would reach 0.618 the length of minute wave a. At 1,275 minuette wave (v) would reach equality in length with minuette wave (i).
Minuette wave (iii) is 0.30 short of 1.618 the length of minuette wave (i).
I have drawn two channels on this downwards movement, both using Elliott’s first technique. The green channel about minute wave c is drawn first with a trend line from the ends of minuette waves (i) to (iii), then a parallel copy is placed on the end of minuette wave (ii). I would expect minuette wave (iv), if it continues further, to find resistance at the upper green trend line. When this green channel is clearly breached by upwards movement that shall be earliest indication that minute wave c and so minor wave B in its entirety is over.
Minuette wave (iv) may not move into minuette wave (i) price territory above 1,292.84. When minuette wave (v) downwards is complete then subsequent movement above this point would provide confidence that minute wave c is over because at that point upwards movement may not be just a fourth wave correction within the downwards trend, and so the downwards trend would have to be over.
I would expect minute wave c to end within the next 24 hours.
This analysis is published about 05:38 p.m. EST.


Steve,
Looks like C wave truncated @ 1280. This level has huge support for Gold due to Geo-political events
Lara, after the jobs report, I am wondering if minute wave c isn’t over, but is going to fall one more time? This low seems like a bit of an anti-climax.
minute wave a = 1347 to 1292
minute wave b = 1292 to 1326
minute wave c = 1326 to around 1270?
minuette wave a of c = 1326 to 1287.5
minuette wave b of c = 1287.5 to 1312
minuette wave c of c = 1312 to 1278.5
minuette wave d of c = 1278.5 to below 1303 sometime early next week?
minuette wave e of c = to middle of next week
I’ve provided an alternate which looks at more downwards movement.
I’m sorry Steve, but I have great difficulty envisaging a wave count from a series of price points for waves. A chart would be so much better. Its in the comments guidelines actually.
No problem. Note the data is two points higher than it should be from 30 Jul (owing to IQFeed switching to the December contract), which distorts the price a little bit:
No probs. Note that the data is two points higher than it should be from 30 July (owing to IQFeed switching to the December contract), which distorts the price a little bit:
No problem. Pls note that the data is two points higher than it should be from 30 July (owing to IQFeed switching to the December contract), which distorts the price a little bit:
That is supposed to be minute wave b on the high
No worries, I figured it should be.
Actually, that has a nice fit. It looks pretty good.
I’ll chart it and look at the Fibonacci ratios and trend lines. If it still looks good I’ll publish it as an alternate tomorrow.
Thanks Steve!
Good. The minute C wave stretches out longer than the other two in terms of time, but could at least have price equality between the A and C waves (and between the impulsive minuette-waves and between the corrective minuette waves within minute C).
Yes we can. When the fourth wave is complete (its still not I think) then there will be a maximum level for the fifth wave.
Equality between minute a and c would be at 1,273.50, which looks about right for that ending diagonal.
1273.5 would also end around the bottom of a channel for the C wave, which connects the highs of 17 and 29 Jul and the low of 24 Jul (and not quite 1 Aug). Maybe that is relevant. I’ve marked the point values for each of the waves. Is there any chance it could go down from here and just complete the C wave without the 4th wave reaching the top of the channel?
That big up-move put paid to that last question!