A slight breach of the invalidation point on the hourly chart changes the picture considerably. I have considered multiple possibilities and present the Elliott wave count with the best fit and best overall look, which agrees with current momentum.
Summary: I expect Gold is most likely in a B wave triangle which should continue for a few more days with very choppy overlapping movement. The highest probability breakout when it is done is upwards to 1,346. Only if 1,280.35 is breached will I consider the breakout to be downwards, but this still has a lower probability.
Click on charts to enlarge.
Main Wave Count.
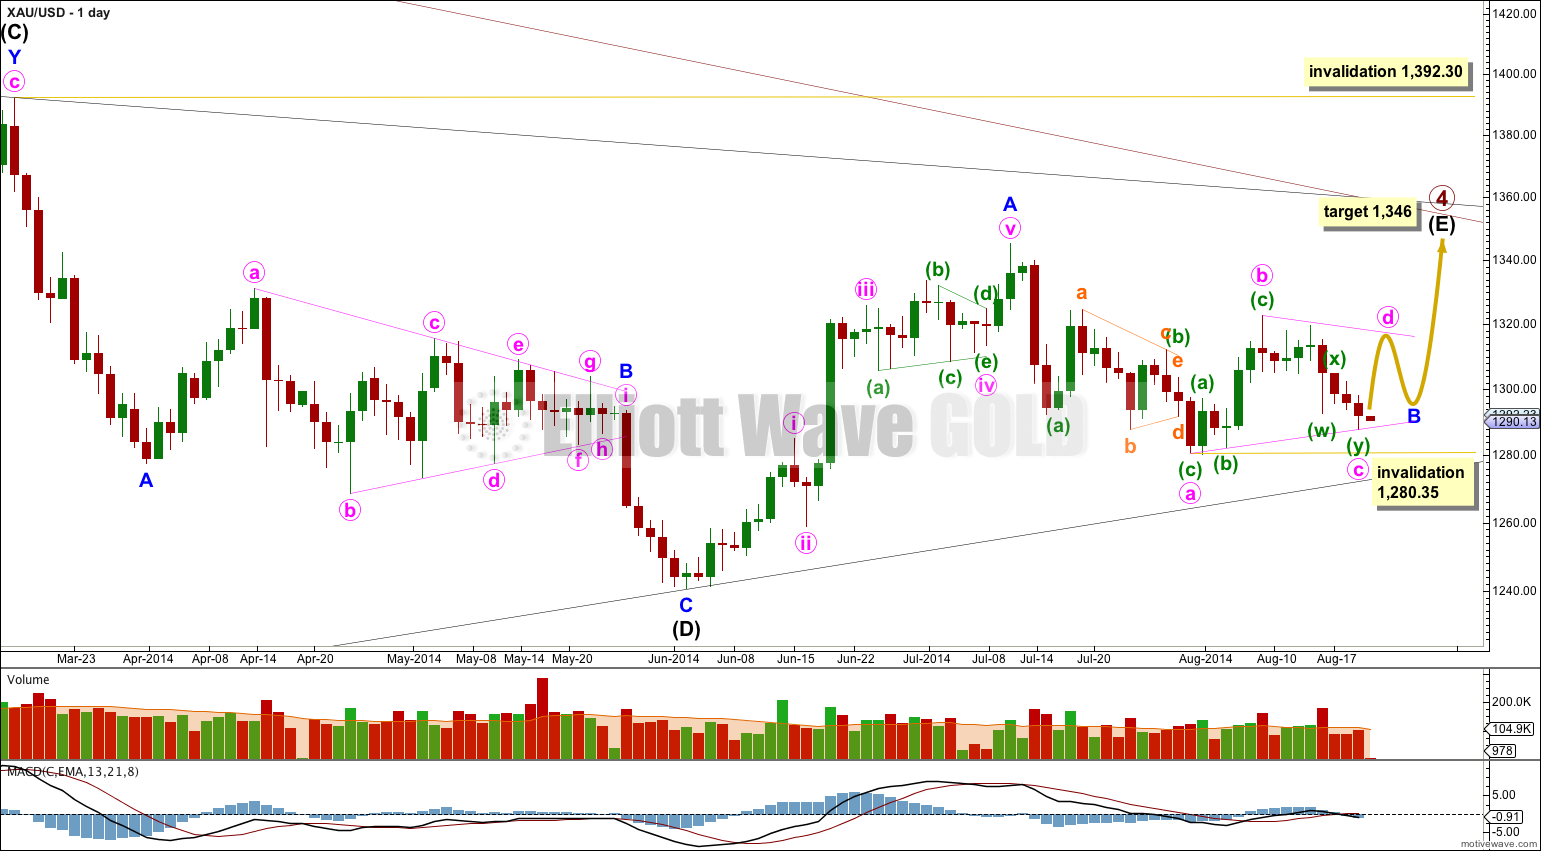
Primary wave 4 is an incomplete regular contracting triangle. Primary wave 2 was a deep 68% running flat correction. Primary wave 4 is showing alternation in depth and some alternation in structure.
Within the triangle of primary wave 4 intermediate wave (E) is unfolding as a zigzag: minor wave A is a five wave impulse and minor wave B downwards is an incomplete triangle.
I have looked at all possible structures for minor wave B:
– It cannot be a flat correction because minute wave b is less than 90% the length of minute wave a, which fails to meet the requirement for a flat.
– It cannot be a zigzag because although we could see minute wave a as a five wave diagonal minute wave c is neither an unfolding impulse nor a diagonal, which means minute wave c cannot be a diagonal because its second wave subdivides only as a combination, which cannot be seen as a single zigzag.
– It cannot be a combination because the second structure in the combination would be a flat correction, but its C wave does not fit as either an impulse (the third wave is showing substantial decrease in momentum) or a diagonal (it looks too weird, and again a third wave is showing a substantial decrease in momentum).
– It cannot be a double zigzag for the same reasons as it cannot be a combination.
Through a process of elimination I can conclude minor wave B is most likely to be completing as a regular contracting triangle. Minute waves d and e are still yet to complete and may take several days.
Within the triangle of minor wave B minute wave c may not move beyond the end of minute wave a below 1,280.35. Minute wave d may not move above the end of minute wave b at 1,322.83. Minute wave e may not move beyond the end of minute wave c (which is yet to move slightly lower; it is not finished) and is very likely to fall comfortably short of the a-c trend line.
At 1,346 minor wave C would move slightly above the end of minor wave A at 1,345.22 and avoid a truncation, and intermediate wave (E) would fall short of the (A)-(C) trend line. This target will probably remain the same.
There are three nice examples of triangles on this daily chart: within intermediate wave (D), within minor wave A of intermediate wave (E), and within minor wave B of intermediate wave (E). In all three examples the final subwave of the triangle ends comfortably short of the A-C trend line. This is the most common place for the final wave of a triangle to end and that is what I will expect is most likely to happen for this primary degree triangle of primary wave 4.
Intermediate wave (E) may not move beyond the end of intermediate wave (C) above 1,392.30.
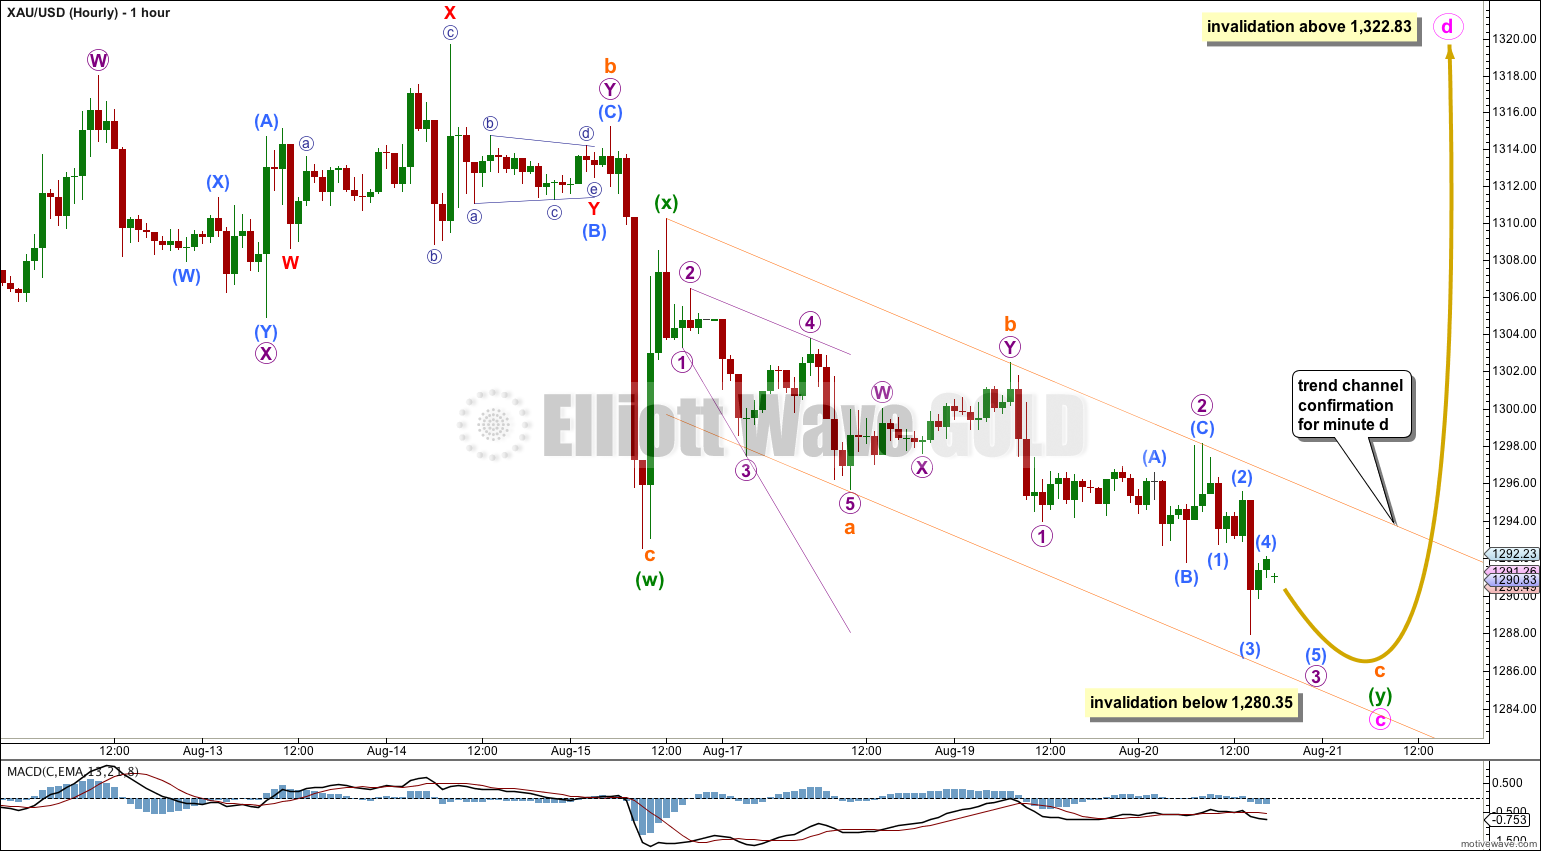
Minute wave c is an incomplete double zigzag because this downwards movement from its start at 1,322.83 does not fit well at all as a single zigzag.
Within the second zigzag of minuette wave (y) subminuette wave a may be a leading expanding diagoanl, subminuette wave b a double zigzag, and subminuette wave c may be an incomplete impulse. I do not have a target for subminuette wave c to end for you because it looks like it will not exhibit a Fibonacci ratio to subminuette wave a: it has already passed equality with subminuette wave a and the structure is incomplete and were it to reach 1.618 the length of subminuette wave a the invalidation point would be breached.
Minuette wave (y) fits very nicely into a channel drawn using Elliott’s technique for a correction: draw the first trend line from the start of subminuette wave a to the end of subminuette wave b, then place a parallel copy on the end of subminuette wave a. I would expect downwards movement to find strong support at the lower edge of the channel. When this channel is clearly breached by upwards movement I will have confidence that minute wave c is over and minute wave d upwards has begun.
Minute wave d may not move beyond the end of minute wave b above 1,322.83. However, this invalidation point is not black and white. As long as the b-d trend line is essentially flat the triangle will remain valid. Barrier triangles may see their d waves end very slightly beyond the end of their b waves. Minute wave d should last at least two days, probably a bit longer, and should unfold as a zigzag.
This wave count is supported by MACD. At the daily chart level during minor wave B triangle MACD is hovering about the zero line. At the hourly chart level there is divergence between MACD trending upwards while price moves lower, which points to an imminent trend change back to the upside.
First Alternate Daily Wave Count.
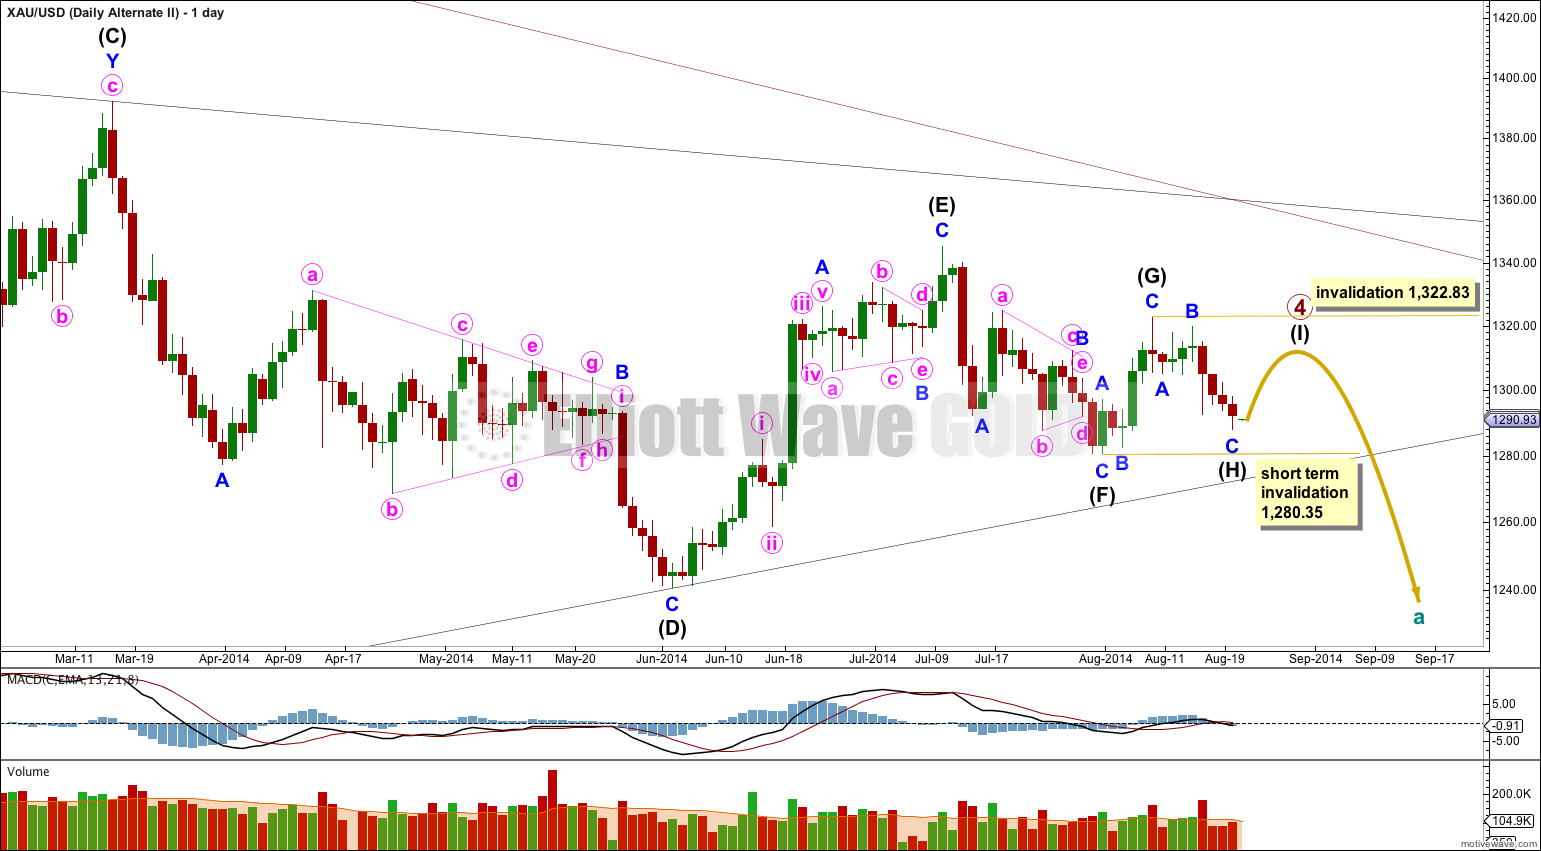
This alternate idea still has some validity, and importantly could see the end of primary wave 4 within a few days. If this is correct then when the final subwave is over the next movement could be a very violent swift downwards movement.
It is possible that primary wave 4 is an almost complete nine wave triangle. Triangles may be either five waves (most common) or nine waves (fairly uncommon). Because nine wave triangles are reasonably rare this idea is reduced in probability to an alternate.
The only other nine wave triangle I have seen of which I am confident is shown on this daily chart. Within intermediate wave (D) minor wave B is a clear nine wave triangle. Within that triangle one of the subwaves can only be seen as a double zigzag, so within a nine wave triangle one of the subwaves may take a more complicated W-X-Y form. This may be what we are seeing here at a larger degree.
This alternate idea resolves the problem of proportion within intermediate wave (E): now the triangle is minor wave B and minor wave A is a five wave impulse. Minor waves A and B are nicely in proportion.
This triangle does look odd though in that intermediate waves (F), (G) and (H) all fall comfortably short of the triangle trend lines. This is quite different to analogous waves within the nine wave triangle of minor wave B of intermediate wave (D) where minute waves f, g and h were much closer to the triangle trend lines. It is also unusual in that for almost all triangles the ends of the subwaves (except for the last one) and often movements within the subwaves end when they touch the triangle trend lines.
There is a further problem with this wave count today. Within this triangle one of the subwaves is already a double zigzag (intermediate wave (C) ) and all the other subwaves may only be simple A-B-C structures. Intermediate wave (H) no longer fits nicely as a single zigzag because this downwards movement looks more like a double zigzag. The probability of this alternate is further reduced today to less than 10%.
I would expect intermediate wave (I) to end above 1,310.27 but below 1,322.83. Minor wave C within the final zigzag of intermediate wave (I) should move beyond the end of minor wave A at 1,310.27 to avoid a truncation, but it may not move beyond the end of intermediate wave (G) at 1,322.83. At 1,311.37 minor wave C would reach equality in length with minor wave A.
Intermediate wave (H) may not move beyond the end of intermediate wave (F) below 1,280.35. Only once intermediate wave (I) could be considered complete then subsequent movement below 1,280.35 would provide confirmation of this alternate.
If this idea is correct then when the final ninth wave is complete then the next movement would be the first movement out of a huge triangle. This movement should be expected to be surprisingly swift and violent.
If this wave count is confirmed then I would expect primary wave 5 to be relatively short and brief. When triangles are excessively time consuming then the movement following the triangle is reduced in length.
Second Alternate Daily Wave Count
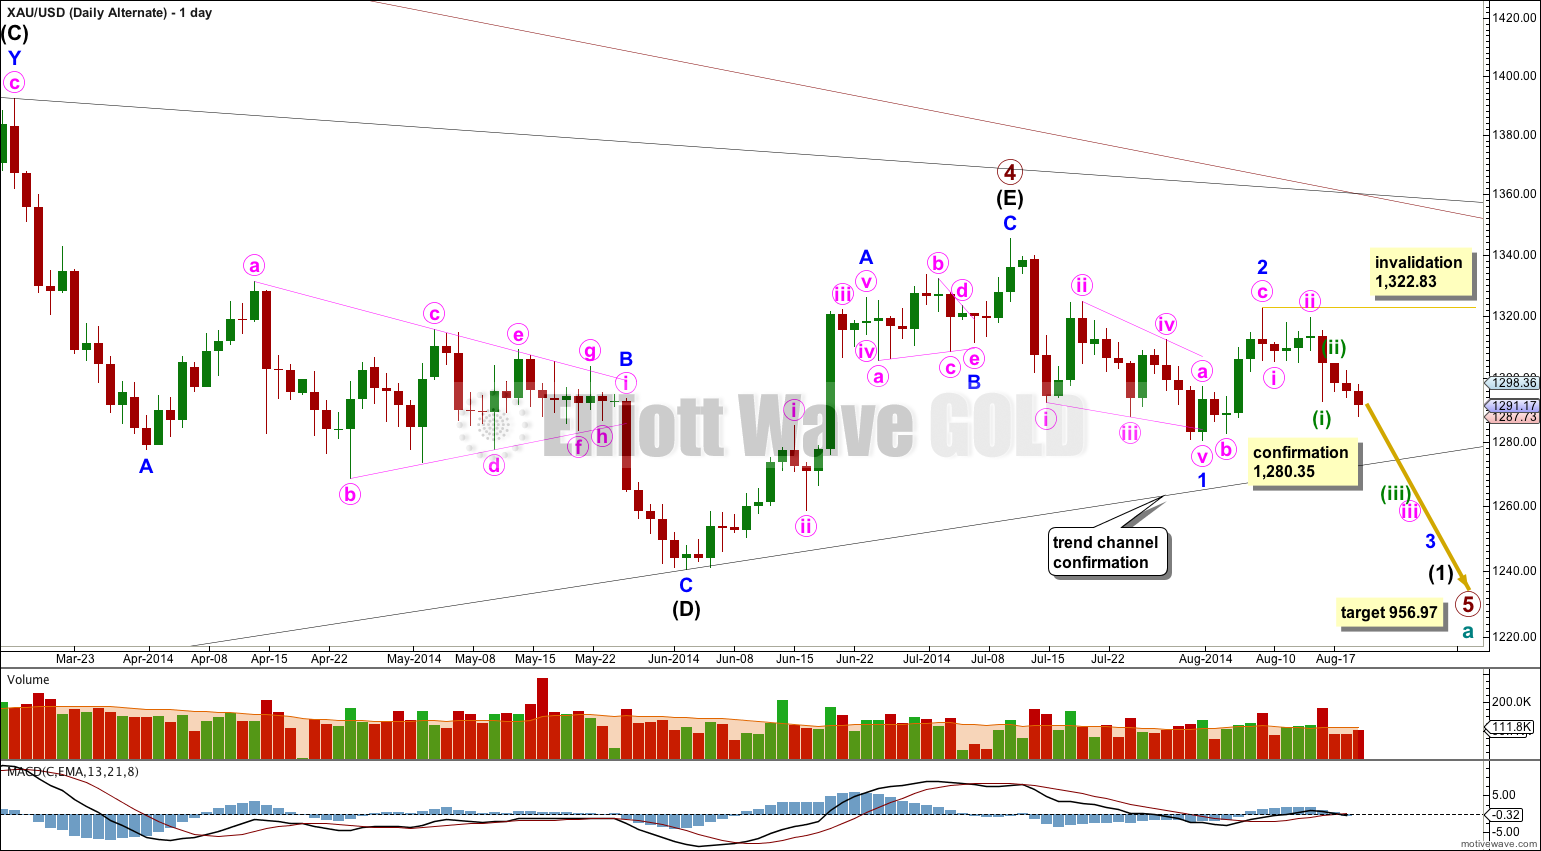
It is possible (but unlikely) that primary wave 4 is over at the high of 1,345.22.
If primary wave 4 is over then primary wave 5 downwards would reach equality in length with primary wave 1 at 956.97. Primary wave 1 was a remarkably brief 3 weeks duration. I would expect primary wave 5 to last some months, and is already longer than one month.
The only structure which fits for minor wave 1 is a leading contracting diagonal. While leading diagonals are not rare, they are not very common either. This slightly reduces the probability of this wave count.
Within diagonals the second and fourth waves are commonly between 0.66 to 0.81 the prior wave. Here minute wave ii is 0.61 the length of minute wave i, just a little shorter than the common length, slightly reducing the probability of this wave count. Minute wave iv is 0.66 the length of minute wave iii, just within the common length.
Leading diagonals in first wave positions are normally followed by very deep second wave corrections. Minor wave 2 is deep at 65% the length of minor wave 1, but this is not “very” deep. This again very slightly reduces the probability of this wave count.
The biggest problem I have with this wave count and the main reason for it being an alternate is the leading diagonal following the end of the triangle for primary wave 4. When triangles end the first piece of movement out of the triangle is almost always very strong and swift. Diagonals are not strong and swift movements. To see a first wave out of a triangle subdividing as a diagonal is highly unusual and does not at all fit with typical behaviour. This substantially reduces the probability of this alternate wave count. I would judge it to have less than a 10% probability.
If this wave count is correct then current movement for the last three days should be the start of a third wave, within a third wave, within a third wave. Current movement should be increasing substantially in downwards momentum for this wave count. The fact that it is not further reduces the probability of this alternate.
Within minor wave 3 no second wave correction may move beyond the start of its first wave above 1,322.83.
Only if this wave count is confirmed with a new low below 1,280.35 next week would I take it seriously. After that a clear breach of the lower (B)-(D) trend line of the primary wave 4 triangle would provide full and final confirmation of this alternate. A full daily candlestick below that trend line would provide me with 100% confidence in this wave count.
This analysis is published about 07:42 p.m. EST.


I can see two possibilities. Minor wave B has just ended as a double zigzag, but I have to check subdivisions (that takes some time). OR – the second alternate which sees primary wave 5 as begun is correct. That still requires a clear breach of the B-D trend line though for confidence. At the moment that trend line is exactly where price stopped…. so far. The next few days will tell us what Gold is doing at primary degree. I’ll have the analysis out shortly.
I’ve noticed when supports/resistances act like they are not there, long slow drawn out moves take place. This is exactly the movement I expect for gold as it acted like the 200dma was not even there. Oil has acted the same way for the last 8 weeks since $107
Hi Lara, what is the target at the bottom? As far as I know 1200 is about the cost of gold production. Will it get below that?
Yes would be great to know it if is heading more south we are at 1279 now. Would short be the better juice now? Or are we still expecting an upward correction?
Guide us what to do now, this is double bottom and i think gold will again move up till 1378. what do you say. invalidation point in 1271.
Lara,
The price has moved lower and invalid first Two wave count. is it possible to provide us with a little more analysis before the next report?
Thank you so much
Yes, could we get a quick update given the circumstances?
Primary 5 underway
looks like down to 5
Are we below the BD trendline? I’m using FXCM and it looks like we are just kissing the line? Don’t want to be suckered into a false break out.
Just to play devil’s advocate, how about Minor wave B as a double zigzag? Have to see movement from the 8/14 high as a 5 down tho, which has some difficulty…
Yeah i can see that. Leading diagonal down. Correction up to 8/8 high. Then ending diagonal down. Replace green (i) with pink (iii). Draw a best fit channel encompassing the whole move and it will look strange but fits. This “breakout” wave “5” contains mixed signals. Leading diagonal suggests resistance to the intended direction IMO. So why? GDX has halted on the 50dma as i type. Its like everyone is waiting for confirmation. Im not convinced yet.
Hello,
I dont believe, that we are already down the way to 5. But we are short before to reach the (B)-(D) Line (see my first chart). After crossing this line I would prefer my second chart. Could it be possible, that we didnt finish wave (D)?
greetings, Jan
Thanks for the upload. I have the same bd trend line (mine hasn’t crossed yet). Your second chart opens up a whole other can of worms. Lol… Im really hating wave 4’s especially b waves within a wave 4! I shouldn’t have attempted to play this move.
Either way, the movement has moved well beyond $1281 regardless of the trendline. $1281 was a Minor B of Int E invalidation pt..