
I have two Elliott wave counts for you today. I would judge the main wave count to have a 60% probability, and the alternate to have a 40% probability. We should have some clarity within two or three days, at the most.
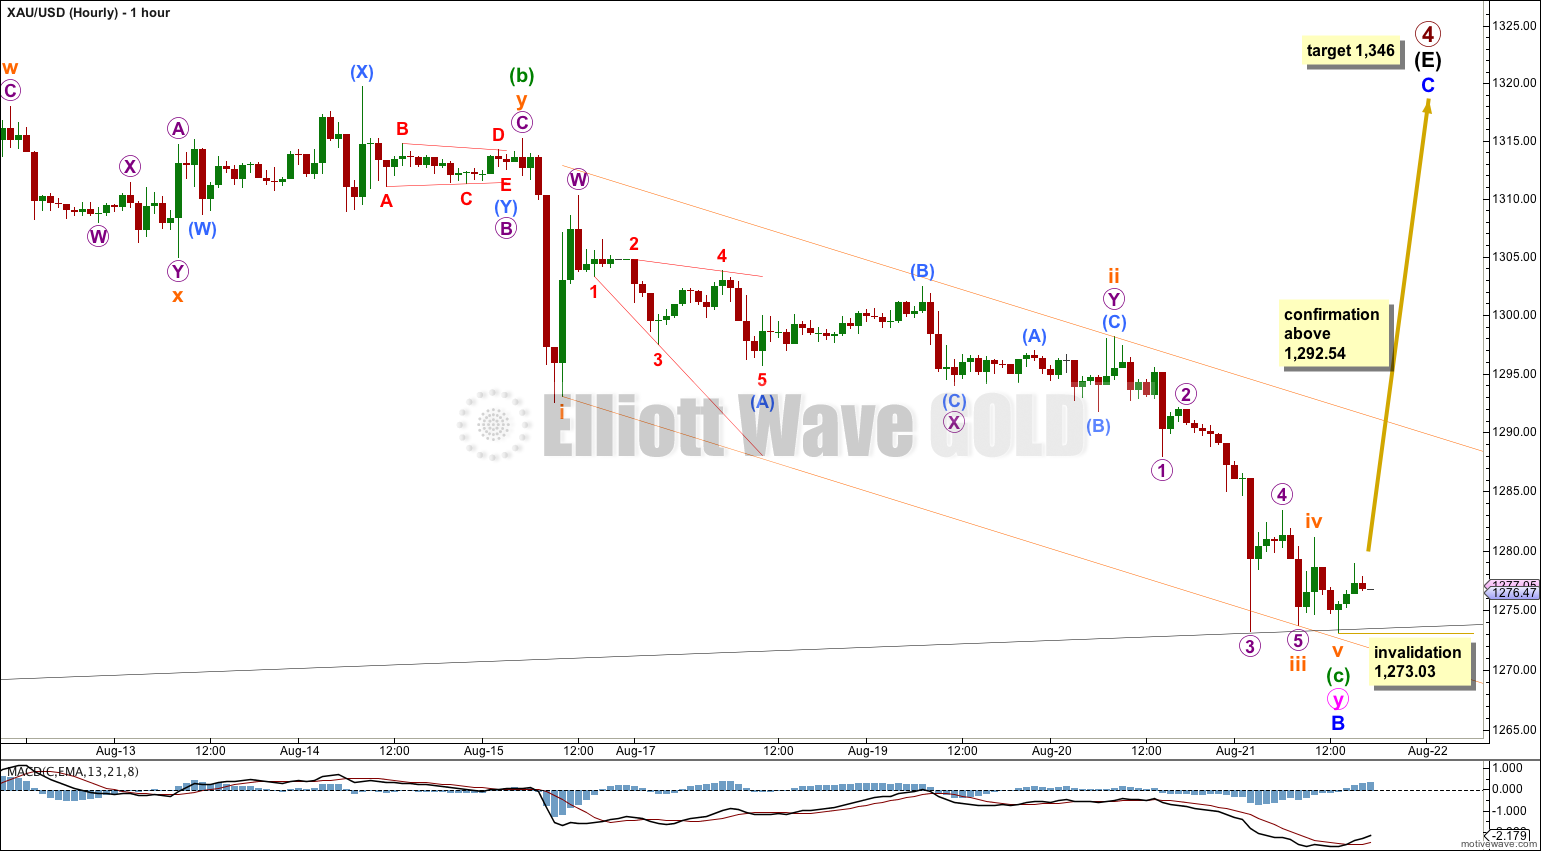
Movement below 1,280.35 has increased the probability of a trend change, but it is not confirmed and will not be until the (B)-(D) trend line is breached with one full daily candlestick below it, and not touching that trend line.
Summary: Movement above 1,292.54 would be a strong indication that Gold still has one final upwards wave to complete primary wave 4. The target remains at 1,346. Movement below 1,273.03 would be a strong indication that primary wave 4 is over. This idea still requires a clear breach of the (B)-(D) trend line at the DAILY chart level for 100% confidence. The target is 956.97 but that may still be 15 weeks away. The short term target is 1,269.
Click on charts to enlarge.
Main Wave Count.
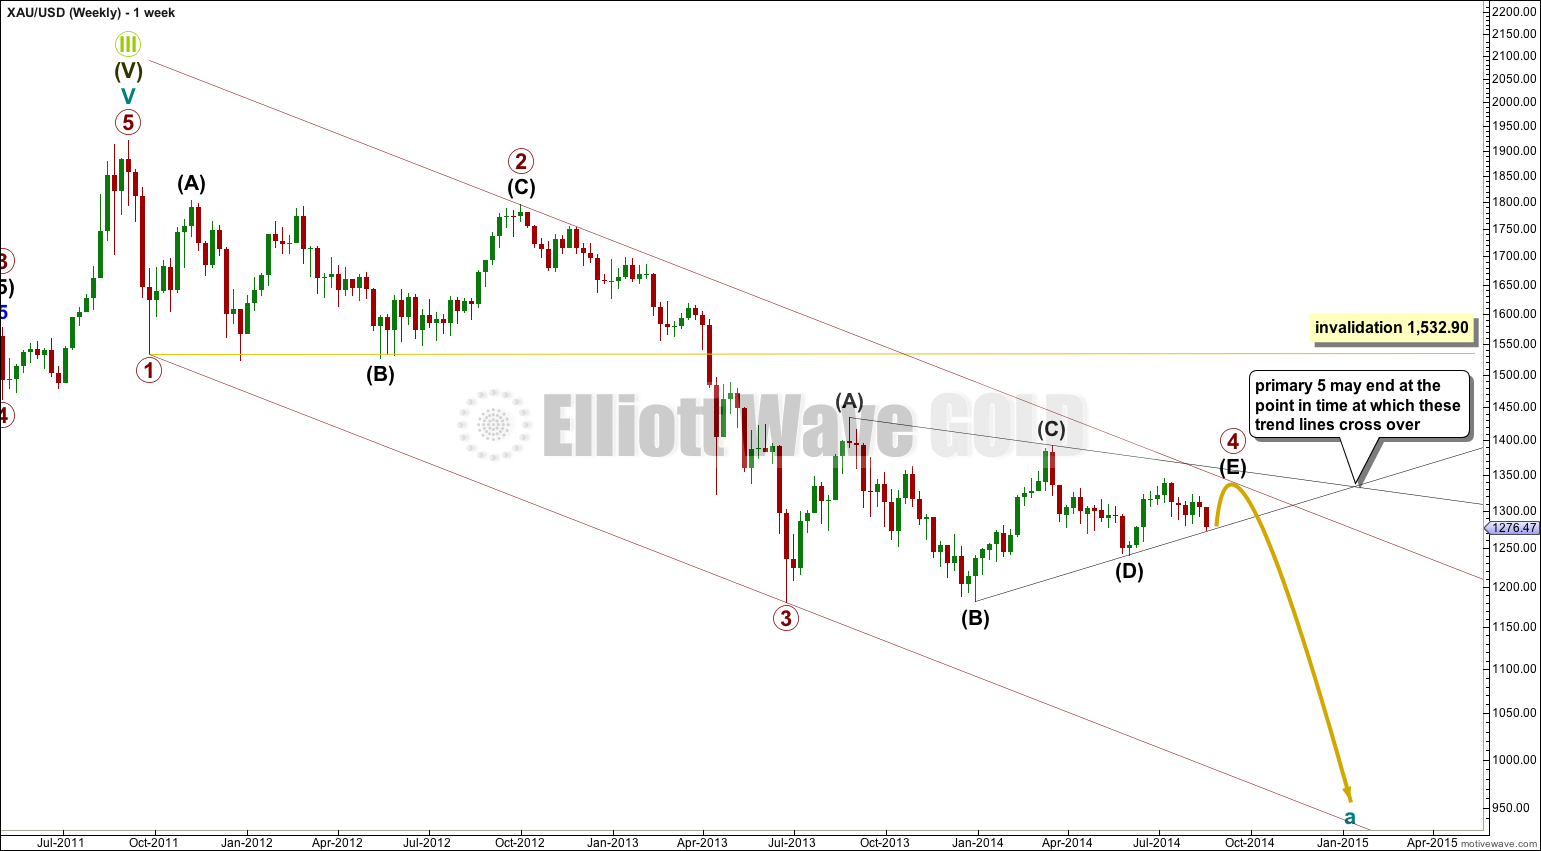
Primary wave 4 may be very close to completion now, or it could actually have been over six weeks ago (alternate count below). At the weekly chart level it looks most likely that primary wave 4 is not over because the movement from the high six weeks ago at 1,345.22 is choppy and overlapping, which is not typical of price behaviour at the end of a triangle.
The lower (B)-(D) trend line of the triangle must be clearly breached on the daily chart for 100% confidence in the idea that the triangle is over.
Primary wave 1 lasted just a Fibonacci three weeks, a remarkably brief primary degree wave. Primary wave 2 was a deep 68% running flat correction lasting 53 weeks, just two short of a Fibonacci 55.
Primary wave 4 is now in its 60th week and may not exhibit a Fibonacci duration and ratio to either of 1 or 3. If it was over 6 weeks ago though it would have completed in 54 weeks, just one short of a Fibonacci 55 and almost even in duration with primary wave 2.
It would be very common for primary wave 4 to touch the upper edge of the maroon channel. This channel is drawn using Elliott’s first technique: draw the first trend line from the lows of primary waves 1 to 3, then place a parallel copy on the high of primary wave 2.
Primary wave 4 may not move into primary wave 1 price territory above 1,532.90.
Primary wave 4 is an incomplete regular contracting triangle. Primary wave 2 was a deep 68% running flat correction. Primary wave 4 is showing alternation in depth and some alternation in structure.
Within the triangle of primary wave 4 intermediate wave (E) is unfolding as a zigzag: minor wave A is a five wave impulse and minor wave B downwards now fits as a completed double zigzag.
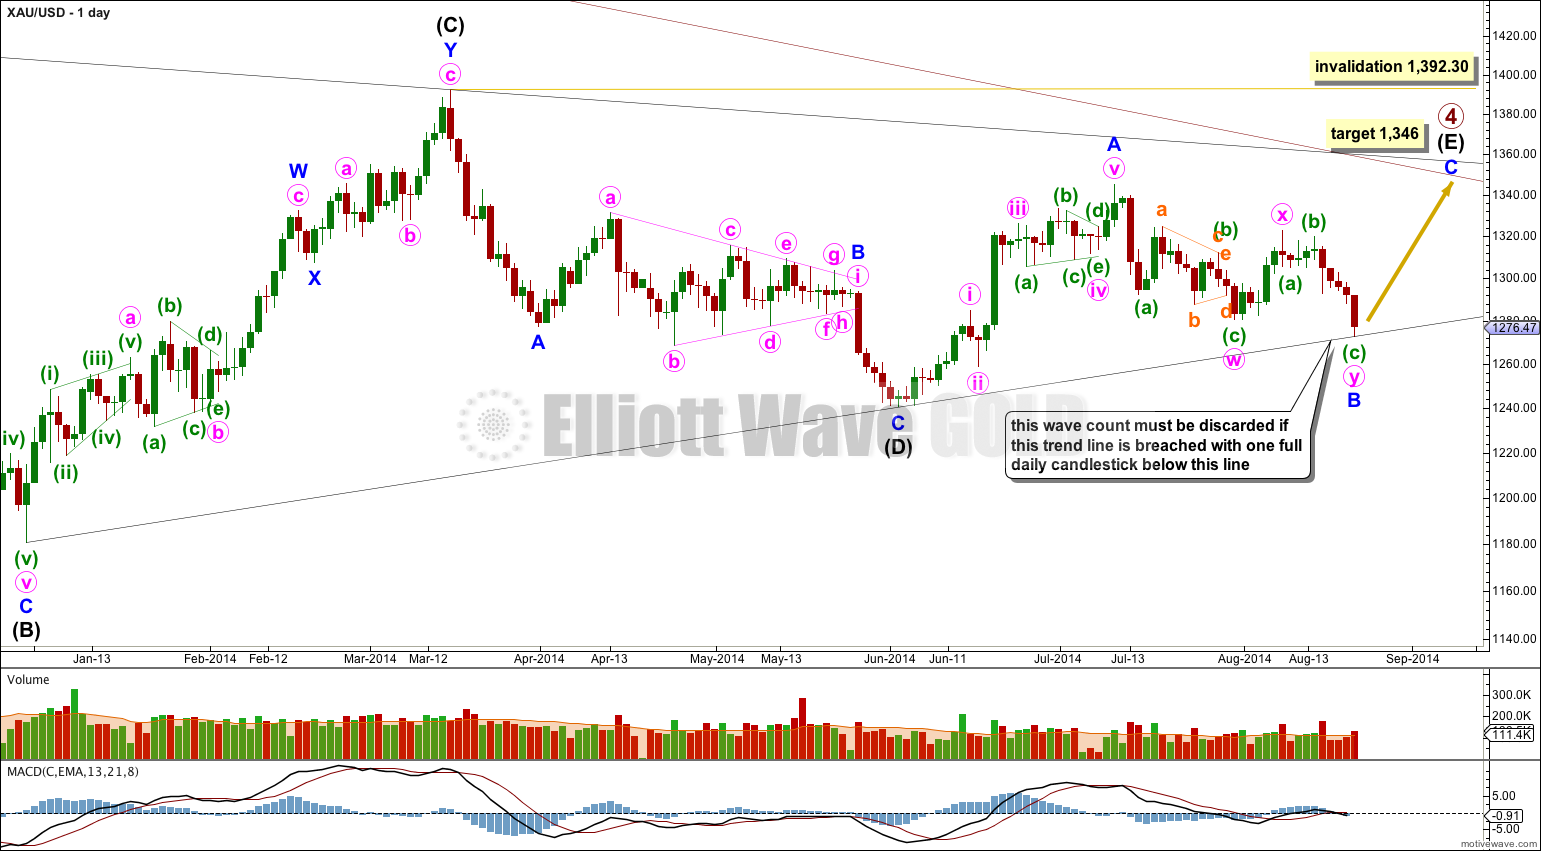
There are four nice examples of completed triangles on this daily chart. When triangles are complete the first movement out of them is most often quite swift and sharp. Importantly, this first movement does not hesitate at the B-D trend line and will plough straight through the trend line, which ceases to provide support or resistance. It is significant that at this stage the (B)-(D) trend line is still providing support to downwards movement. This is one reason why I consider this main wave count to still have a higher probability.
If minor wave C is to avoid a truncation it should move above the end of minor wave A at 1,345.22. At 1,346 it would do this, and may end when price comes to touch the upper edge of the maroon channel copied over here from the weekly chart. This may see minor wave C last a Fibonacci 13 days in total.
Intermediate wave (E) may not move beyond the end of intermediate wave (C) above 1,392.30.
Within the second zigzag of minor wave B, minute wave y, the structure is now complete.
Within minute wave y, minuette wave (c) is 3.77 short of 2.618 the length of minuette wave (a). The structure of minuette wave (c) is now a completed five wave impulse, with the third wave showing the strongest dowwnards momentum.
Ratios within minuette wave (c) are: subminuette wave iii is 2.32 longer than equality with subminuette wave i, and subminuette wave v is just 0.44 short of 0.382 the length of subminuette wave i.
Subminuette waves ii and iv show alternation, but they are grossly disproportionate. This gives this portion of the wave count an odd look, but the subdivisions all fit.
If this wave count is correct then the first indication we will have would be a clear breach of the upper edge of the channel drawn about minuette wave (c). Draw this trend line from the lows of subminuette waves i to iii, then place a parallel copy on the high of subminuette wave ii.
Price confirmation would come with movement above 1,292.54. If my analysis of this most recent downwards wave is correct then at that point we may have confidence that Gold will continue upwards towards 1,346, to reach that target in about 13 days time.
Alternate Daily Wave Count
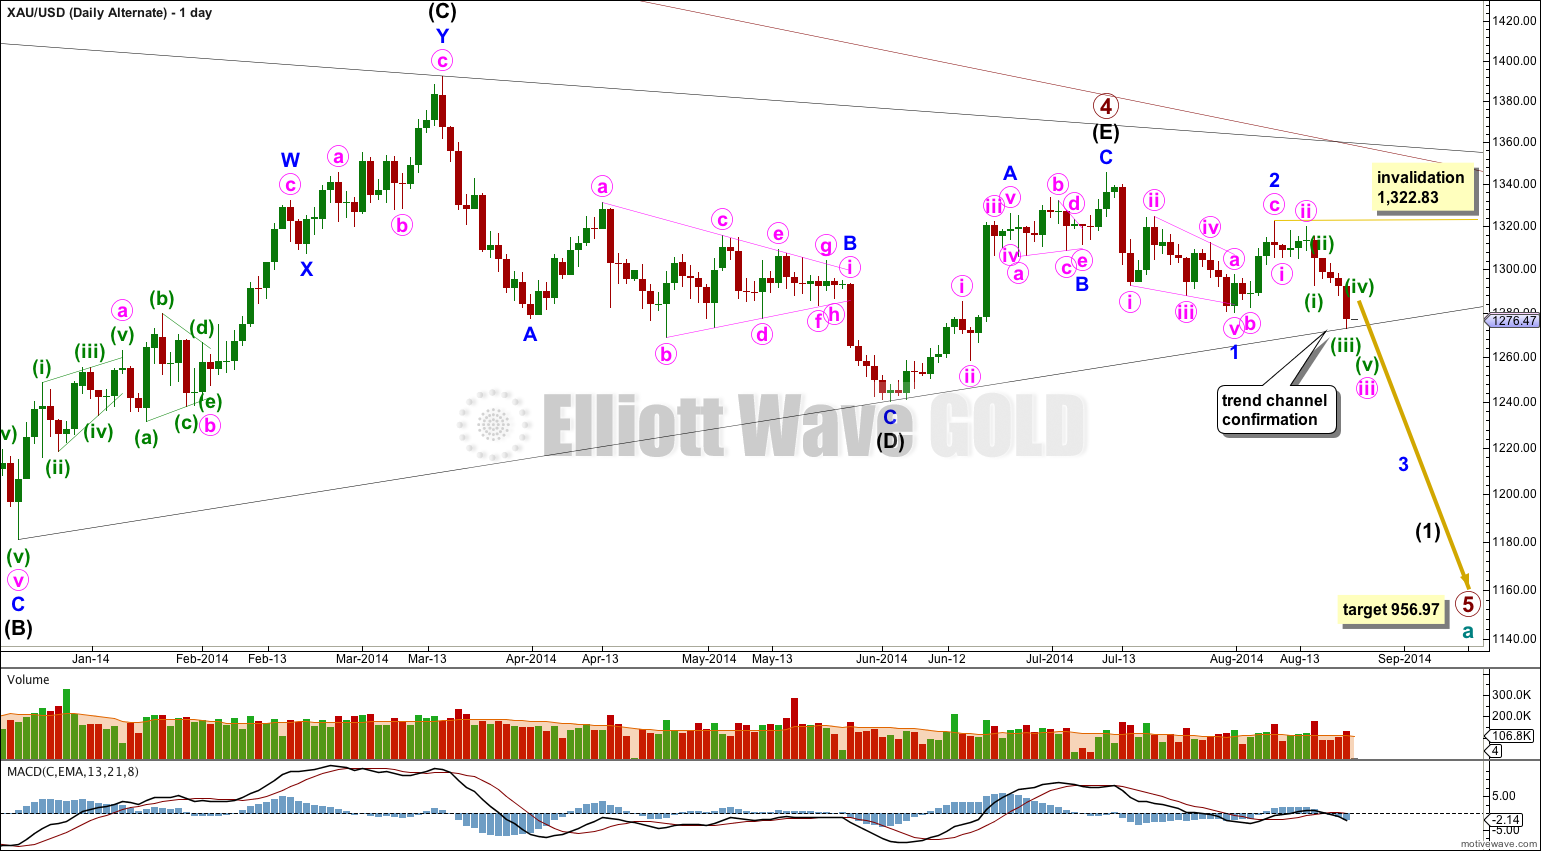
It is possible that primary wave 4 is over at the high of 1,345.22. The probability of this idea has increased today, but it still requires confirmation with a clear breach of the (B)-(D) trend line on this daily chart.
If primary wave 4 is over then primary wave 5 downwards would reach equality in length with primary wave 1 at 956.97. Primary wave 1 was a remarkably brief 3 weeks duration. I would expect primary wave 5 to last some months, and is already longer than one month.
The only structure which fits for minor wave 1 is a leading contracting diagonal. While leading diagonals are not rare, they are not very common either. This slightly reduces the probability of this wave count.
Within diagonals the second and fourth waves are commonly between 0.66 to 0.81 the prior wave. Here minute wave ii is 0.61 the length of minute wave i, just a little shorter than the common length, slightly reducing the probability of this wave count. Minute wave iv is 0.66 the length of minute wave iii, just within the common length.
Leading diagonals in first wave positions are normally followed by very deep second wave corrections. Minor wave 2 is deep at 65% the length of minor wave 1, but this is not “very” deep. This again very slightly reduces the probability of this wave count.
The biggest problem I have with this wave count and the main reason for it still being an alternate is the leading diagonal following the end of the triangle for primary wave 4. When triangles end the first piece of movement out of the triangle is almost always very strong and swift. Diagonals are not strong and swift movements. To see a first wave out of a triangle subdividing as a diagonal is highly unusual and does not at all fit with typical behaviour.
Also, today price is finding strong support at the (B)-(D) trend line, which should have ceased to provide any support or resistance if the triangle was over. This is unusual.
Within minor wave 3 no second wave correction may move beyond the start of its first wave above 1,322.83.
A clear breach of the lower (B)-(D) trend line of the primary wave 4 triangle would provide full and final confirmation of this alternate. A full daily candlestick below that trend line would provide me with 100% confidence in this wave count.
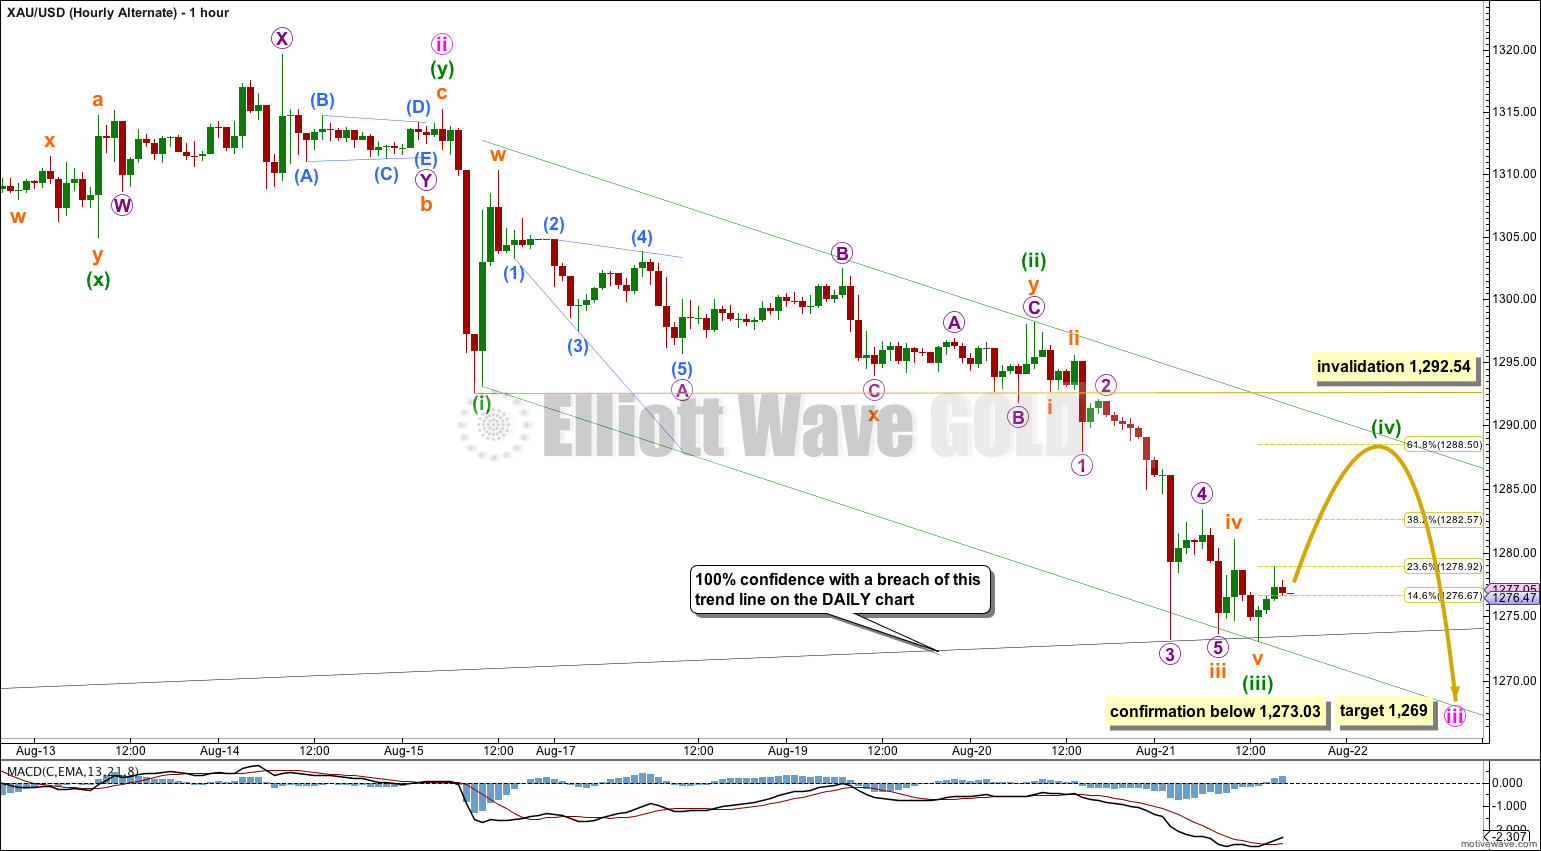
With an increase in downwards momentum over the last 24 hours, a third wave has clearly unfolded. Divergence between price and MACD disappeared.
Minuette wave (iii) is 2.96 longer than equality with minuette wave (i).
Minuette wave (ii) was a shallow sideways combination. Given the guideline of alternation minuette wave (iv) may be expected to be a relatively deep zigzag or zigzag multiple. It may reach up to the 0.618 Fibonacci ratio of minuette wave (iii) about 1,288.50. Minuette wave (iv) may find resistance at the upper edge of this channel, which is drawn in the same way as on the main hourly chart.
At 1,269 minute wave iii would be 2.618 the length of minute wave i. This price point should bring price below the (B)-(D) trend line which is again copied over here from the daily chart.
In conclusion: Wave behaviour is important, but it is like all grey areas of more traditional technical analysis which describe tendencies not certainties. I cannot give you certainty today and can only do that once the (B)-(D) trend line is breached. Wave behaviour (and structure) is indicating to me that primary wave 4 is not over. If we expect Gold to follow most common behaviour then it would have one final upwards wave. But it may not do this, because we may be seeing some slightly unusual behaviour from Gold at this time.
This analysis is published about 06:32 p.m. EST.
Thx Lara….really enjoying your thorough reports.