
I have an increased confidence in the main Elliott wave count today with a breach of the orange channel on the hourly chart.
Summary: In the short term I expect the next wave up may be about $26.81 in length, which should see a further increase in upwards momentum. A new high above 1,305.27 would provide strong confidence in the target at 1,346. That target may be met in another 10 trading days. Alternatively, a new low below 1,273.03 would indicate a new primary degree trend to the downside. Full confidence in a new primary degree trend to the downside would come with one full daily candlestick below the (B)-(D) trend line.
Click on charts to enlarge.
Main Wave Count.
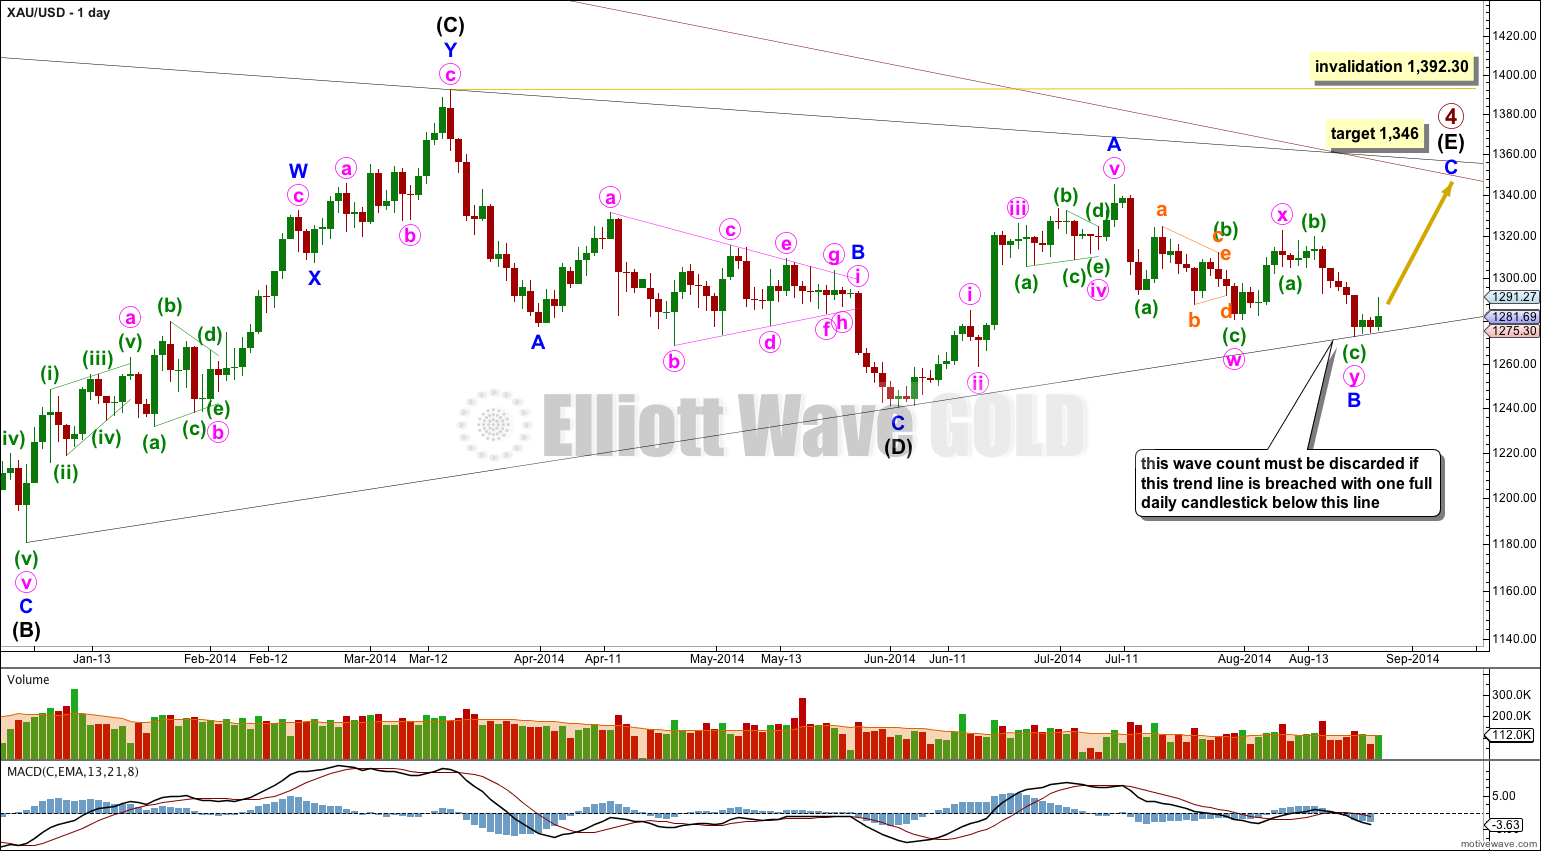
Primary wave 4 is an incomplete regular contracting triangle. Primary wave 2 was a deep 68% running flat correction. Primary wave 4 is showing alternation in depth and some alternation in structure.
Within the triangle of primary wave 4 intermediate wave (E) is unfolding as a zigzag: minor wave A is a five wave impulse and minor wave B downwards now fits as a completed double zigzag.
There are four nice examples of completed triangles on this daily chart. When triangles are complete the first movement out of them is most often quite swift and sharp. Importantly, this first movement does not hesitate at the B-D trend line and will plough straight through the trend line, which ceases to provide support or resistance. It is significant that at this stage the (B)-(D) trend line is still providing support to downwards movement. This is one reason why I consider this main wave count to have a higher probability.
If minor wave C is to avoid a truncation it should move above the end of minor wave A at 1,345.22. At 1,346 it would do this, and may end when price comes to touch the upper edge of the maroon channel copied over here from the weekly chart. This may see minor wave C last a Fibonacci 13 days in total.
The four examples of completed triangles here on the daily chart also show that the final subwave of a triangle most often ends comfortably short of the A-C trend line. The target at 1,346 would see this happen for primary wave 4.
Intermediate wave (E) may not move beyond the end of intermediate wave (C) above 1,392.30.
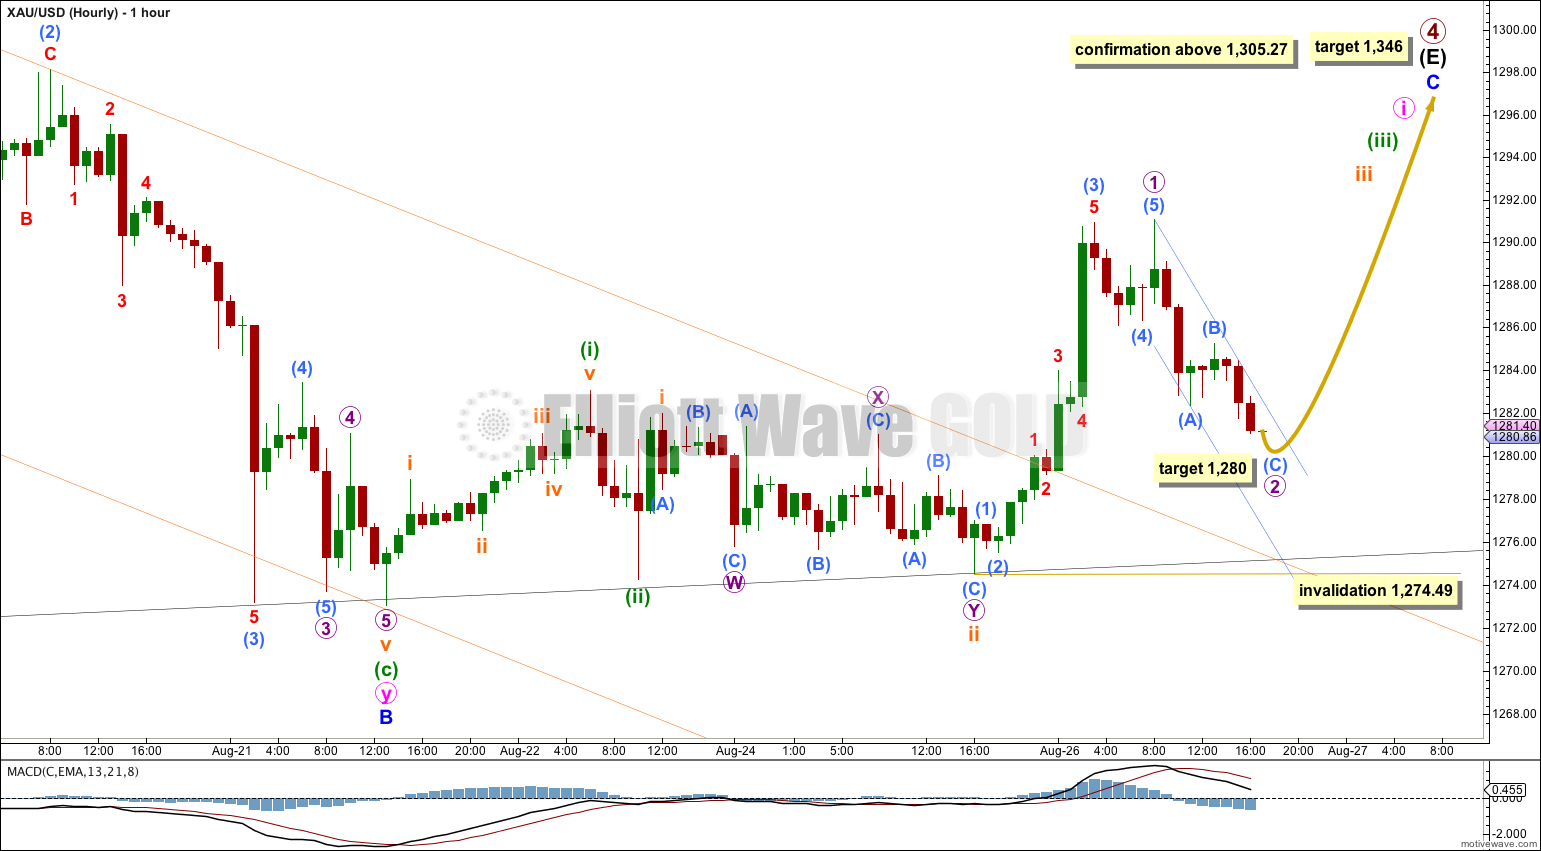
A clear breach of the upper edge of the orange best fit channel drawn about minuette wave (c) downwards provides trend channel confirmation that minuette wave (c) is complete and the next wave is underway. I have increased confidence in this main wave count today for this reason.
I am labeling this upwards movement with the most likely / most common situation, expecting an extended third wave is beginning. Depending on the next few days movement I may reconsider what degree of labeling to give this upwards movement (I may move it all up one degree). This makes no difference at this stage to target calculation or expected direction.
Within impulses third waves are the most commonly extended waves of the three actionary waves, 1, 3 and 5. When third waves extend they necessarily begin with a series of overlapping first and second waves. So far I expect there are three first and second waves complete. This indicates a further increase in upwards momentum should come in the next 24 hours.
Micro wave 2 is almost complete, from the five minute chart it looks like the final fifth wave within submicro wave (C) is incomplete. At 1,280 submicro wave (C) would reach 0.618 the length of submicro wave (A).
I cannot yet calculate a target for the next wave up for you, because I do not know where it will begin. I would expect the next wave up to be micro wave 3 and it is most likely to be $26.81 in length, 1.618 the length of micro wave 1.
Draw a small best fit channel about micro wave 2 as shown. When this small blue channel is clearly breached by upwards movement I would have confidence that micro wave 3 has begun. I would then calculate a target for it $26.81 from its start.
Within minor wave C no second wave correction may move beyond the start of its first wave below 1,273.03.
Alternate Daily Wave Count
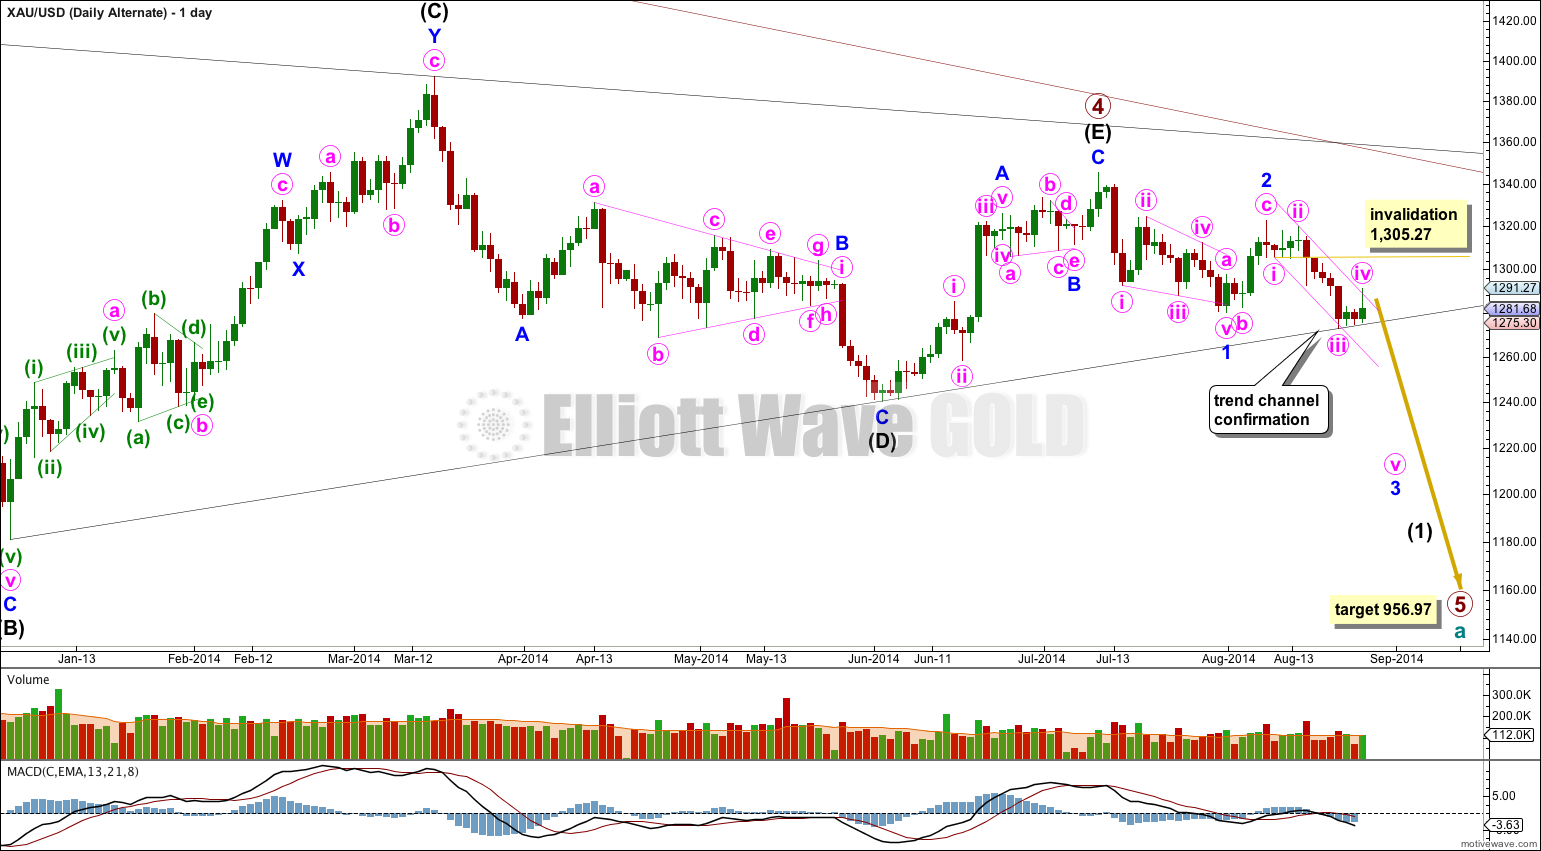
It is possible that primary wave 4 is over at the high of 1,345.22. This wave count still requires confirmation with a clear breach of the (B)-(D) trend line on this daily chart.
If primary wave 4 is over then primary wave 5 downwards would reach equality in length with primary wave 1 at 956.97. Primary wave 1 was a remarkably brief 3 weeks duration. I would expect primary wave 5 to last some months, and is already longer than one month.
The only structure which fits for minor wave 1 is a leading contracting diagonal. While leading diagonals are not rare, they are not very common either. This slightly reduces the probability of this wave count.
Within diagonals the second and fourth waves are commonly between 0.66 to 0.81 the prior wave. Here minute wave ii is 0.61 the length of minute wave i, just a little shorter than the common length, slightly reducing the probability of this wave count. Minute wave iv is 0.66 the length of minute wave iii, just within the common length.
Leading diagonals in first wave positions are normally followed by very deep second wave corrections. Minor wave 2 is deep at 65% the length of minor wave 1, but this is not “very” deep. This again very slightly reduces the probability of this wave count.
The biggest problem I have with this wave count and the main reason for it still being an alternate is the leading diagonal following the end of the triangle for primary wave 4. When triangles end the first piece of movement out of the triangle is almost always very strong and swift. Diagonals are not strong and swift movements. To see a first wave out of a triangle subdividing as a diagonal is highly unusual and does not at all fit with typical behaviour.
Also, price continues to find strong support at the (B)-(D) trend line, which should have ceased to provide any support or resistance if the triangle was over. This is unusual and further reduces the probability of this alternate wave count.
Within minor wave 3 minute wave iv may not move into minute wave i price territory above 1,305.27.
A clear breach of the lower (B)-(D) trend line of the primary wave 4 triangle would provide full and final confirmation of this alternate. A full daily candlestick below that trend line would provide me with 100% confidence in this wave count.
Draw a channel about minor wave 3 here on the daily chart using Elliott’s first technique and copy it over to the hourly chart: draw the first trend line from the lows labeled minute waves i to iii, then place a parallel copy on the high labeled minute wave ii.
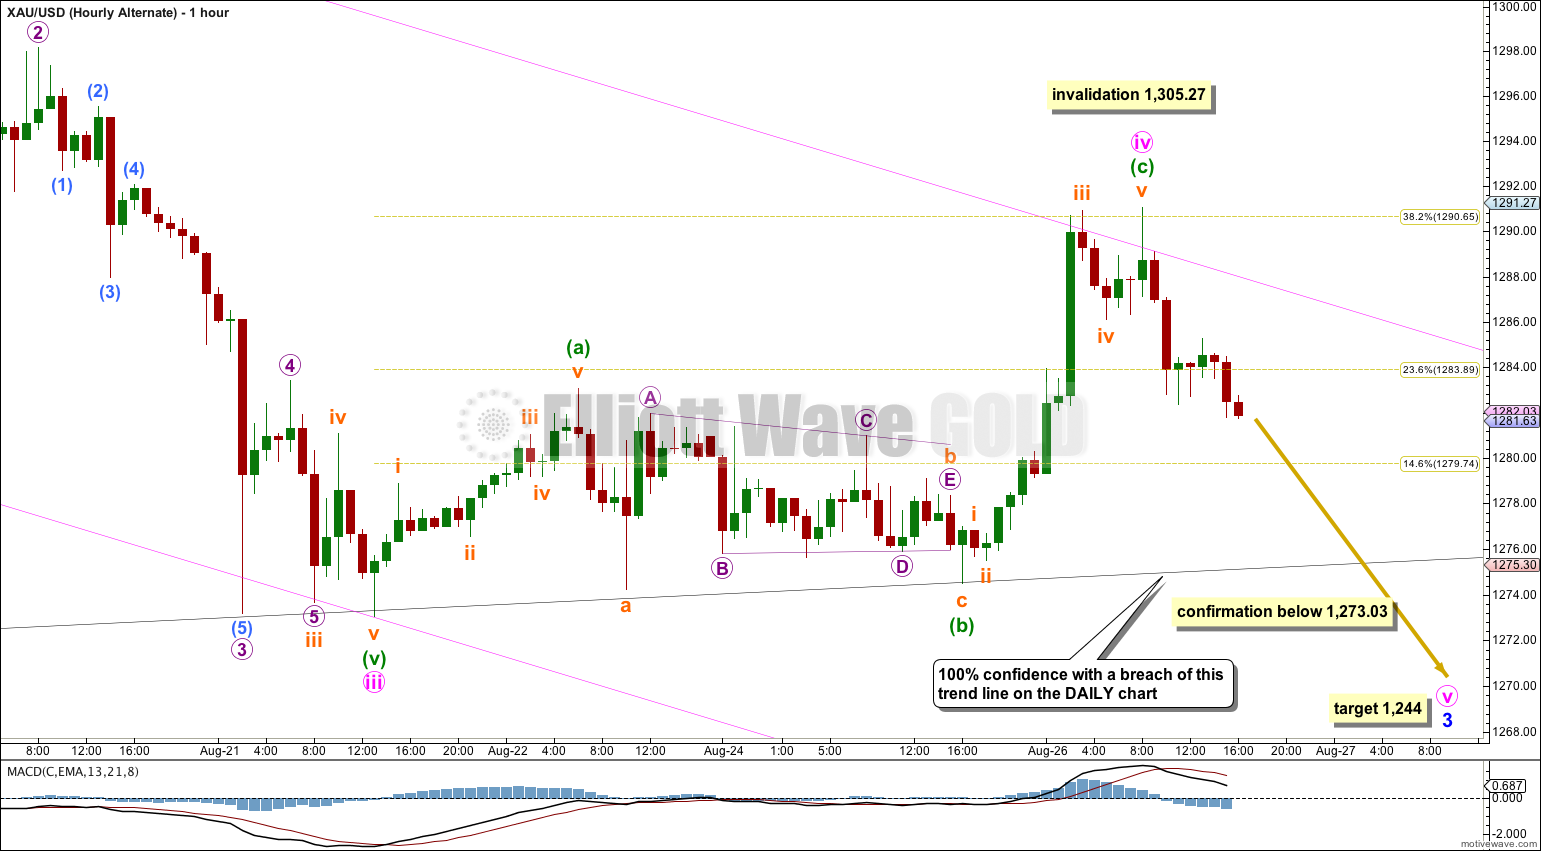
Minute wave iv did not form a triangle. It may have formed a zigzag, which shows structural alternation with the double combination of minute wave ii.
Minute wave ii was a deep 82% correction. Minute wave iv would most likely be shallow and so would most likely be over here close to the 0.382 Fibonacci ratio of minute wave iii.
Minute wave iv may find resistance at the upper edge of the channel drawn about minor wave 3 downwards on the daily chart and copied over here. There is a slight overshoot, which may indicate an overthrow on the opposite side for minute wave v.
At 1,244 minute wave v would reach equality in length with minute wave iii. Both minute waves iii and v would be extended.
This wave count requires confirmation initially with a new low below 1,273.03. Thereafter, I would wait for one full daily candlestick below the black (B)-(D) trend line on the daily chart before I would have full confidence in the idea that primary wave 5 has begun.
I would only take this wave count seriously with some confirmation.
This analysis is published about 05:36 p.m. EST.
Lara, I agreed with your assessment even 2 weeks ago about hitting the upper weekly trendline from 2011. However it’s now looking more and more likely if it kisses this weekly trendline, it may be under $1345 causing a truncation. This is OK, but not exactly how I envisioned it. I know the hourly channel was breached, but I’m staying neutral until a solid close above 200 dma or $1289ish. Thanks!