
Another downwards day and another red candlestick was expected. The short term target was not met with price $2.73 short of the target.
The Elliott wave count remains the same.
Summary: We may see a small fourth wave correction begin here to last a day or two, or price could move down a little more first to 1,238. The mid term target remains the same at 1,231, with a second lower possibility at 1,221 – 1,218.
Click on charts to enlarge.
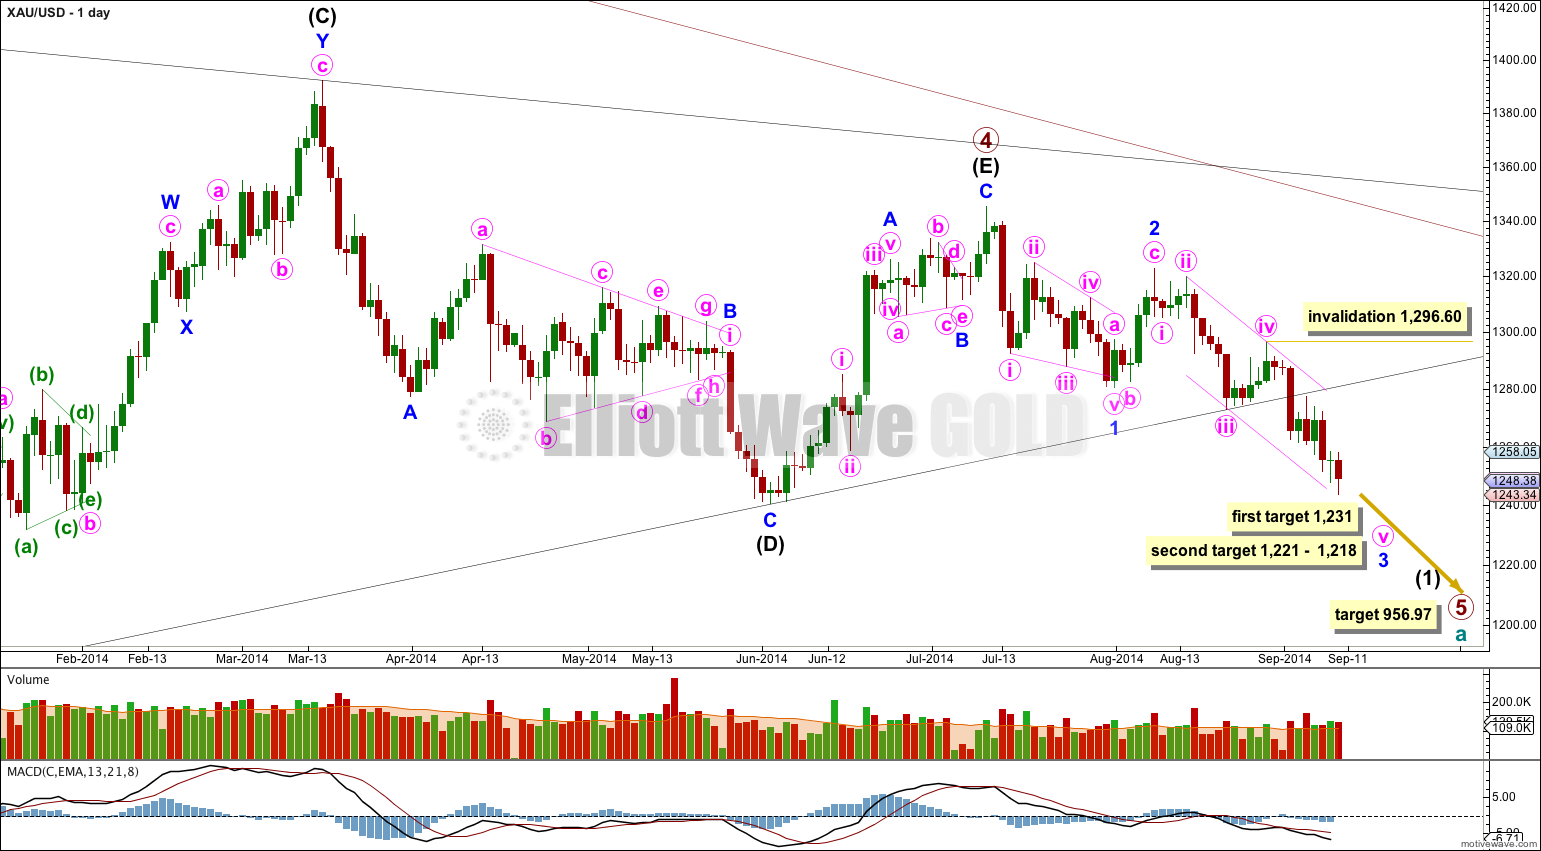
The black (B)-(D) trend line is clearly breached. I have confidence that primary wave 5 has begun. The black (B)-(D) trend line is now also clearly breached on the weekly chart. This is significant.
In the last few trading days it is downwards days which have mostly higher volume. From a traditional technical analysis point of view this indicates the main trend is most likely down.
At 956.97 primary wave 5 would reach equality in length with primary wave 1. Primary wave 3 is $12.54 short of 1.618 the length of primary wave 1, and equality between primary waves 5 and 1 would give a perfect Elliott relationship for this downwards movement.
However, when triangles take their time and move close to the apex of the triangle, as primary wave 4 has (looking at this on a weekly chart is clearer) the movement following the triangle is often shorter and weaker than expected. If the target at 956.97 is wrong it may be too low. In the first instance I expect it is extremely likely that primary wave 5 will move at least below the end of primary wave 3 at 1,180.40 to avoid a truncation. When intermediate waves (1) through to (4) within primary wave 5 are complete I will recalculate the target at intermediate degree because this would have a higher accuracy. I cannot do that yet; I can only calculate it at primary degree.
On a weekly chart extend the triangle trend lines of primary wave 4 outwards. The point in time at which they cross over may be the point in time at which primary wave 5 ends. This does not always work, but it works often enough to look out for. It is a rough guideline only and not definitive. A trend line placed from the end of primary wave 4 to the target of primary wave 5 at this point in time shows primary wave 5 would take a total 26 weeks to reach that point, and that is what I will expect. So far it is in its ninth week.
Minor wave 1 is a leading contracting diagonal. This was followed by a somewhat deep correction, a zigzag for minor wave 2.
Within minute wave v no second wave correction may move beyond its start above 1,296.60.
Draw a channel about minor wave 3 on the daily chart and copy it over carefully to the hourly chart: draw the first trend line from the highs labeled minute waves ii to iv, then place a parallel copy on the low labeled minute wave iii. Expect downwards movement for minute wave v to find support, and maybe end, at this lower pink trend line.
First Hourly Wave Count.
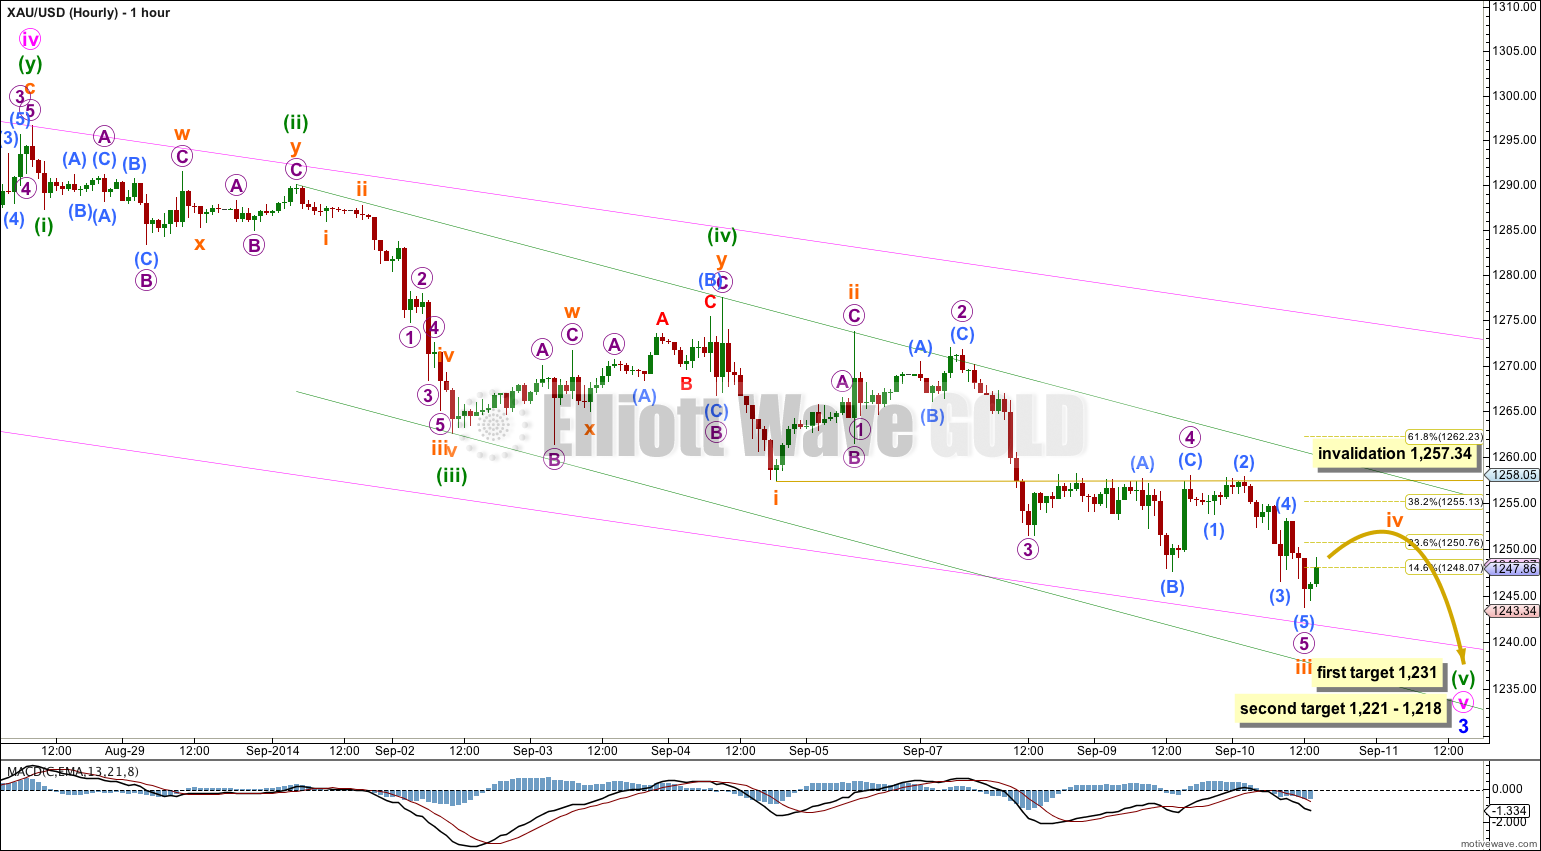
Downwards movement continues to remain contained within the green channel drawn about minute wave v, which is extending. Draw this channel using Elliott’s second technique: from the highs labeled minuette waves (ii) to (iv), then a parallel copy placed on the low labeled minuette wave (iii). Use this channel, and the pink channel copied over from the daily chart, to see where price is most likely to find support and resistance along the way down.
Subminuette wave iii may be over, and is 2.46 short of 1.618 the length of subminuette wave i.
If subminuette wave iii is over then I would expect subminuette wave iv to be highly likely to show up on the daily chart as one or two green candelsticks or doji, because subminuette wave ii is clear on the daily chart as a green candlestick.
Subminuette wave ii was a very deep 82% zigzag. I would expect subminuette wave iv to be shallow, maybe even as shallow as 0.146 or 0.236, and very choppy and sideways. It is most likely to be a flat, triangle or combination. Within those most likely possibilities are included expanded flats and running triangles which have price extremes beyond the start. Within subminuette wave iv we may see a new low below 1,243.72 as part of the correction.
Subminuette wave iv may not move into subminuette wave i price territory above 1,257.34.
Second Hourly Wave Count.
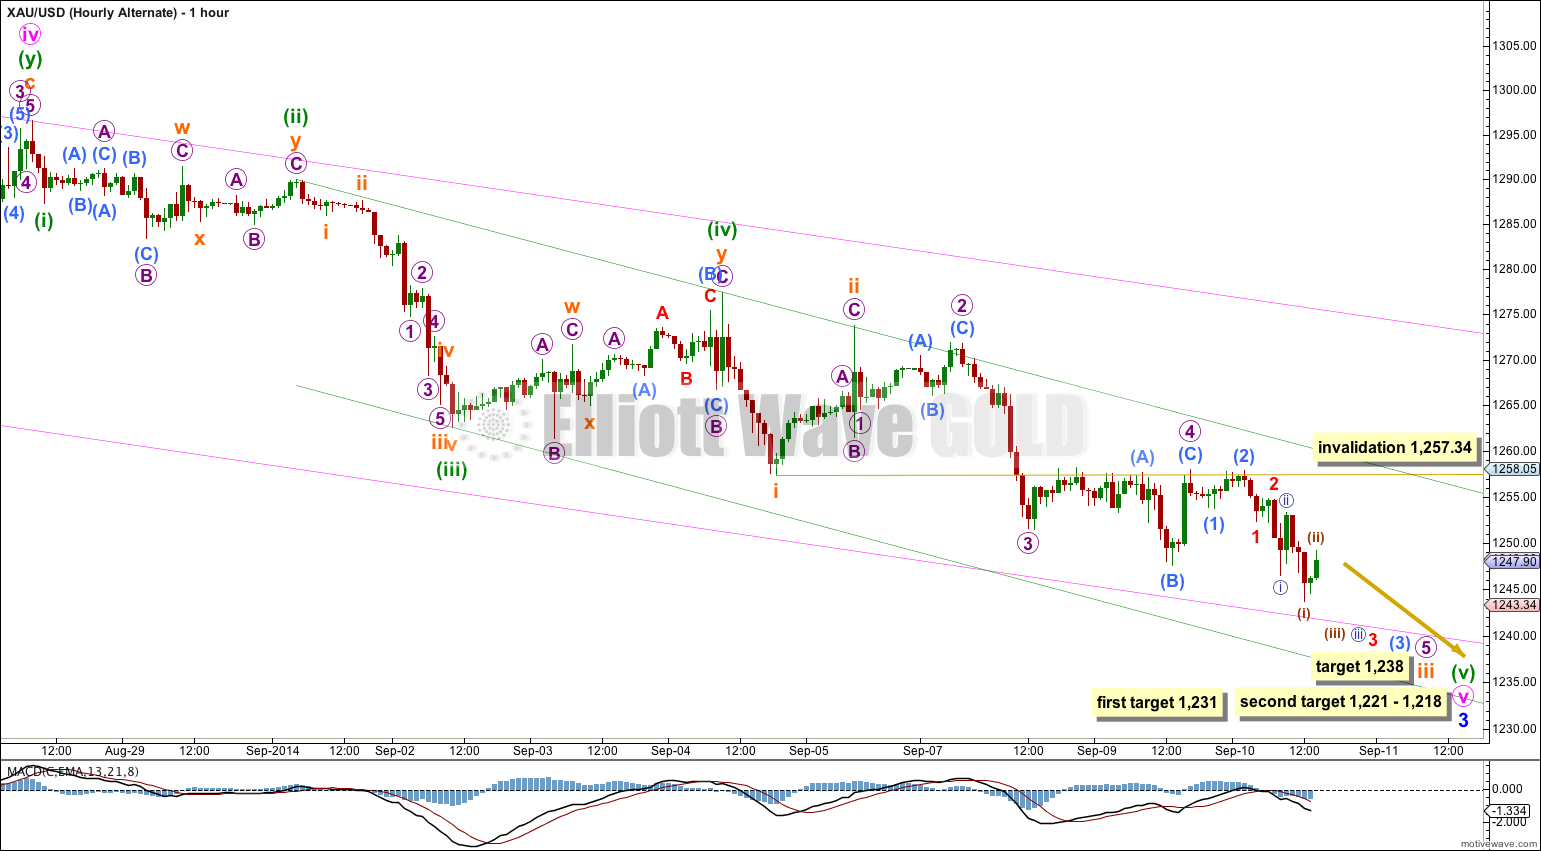
Within micro wave 5 (the last downwards wave) there is a lot of overlapping. It must be considered that micro wave 5 is extending also and this overlapping is a series of first and second waves. This alternate would expect to see a short burst of downwards movement with increased momentum as the middle of a small third wave unfolds, to be followed by more overlapping fourth wave corrections to complete an impulse for micro wave 5.
At 1,238 micro wave 5 would reach equality in length with micro wave 3. At this target subminuette wave iii would have no Fibonacci ratio to subminuette wave i. If this target is wrong for this wave count it may be too high.
This wave count expects subminuette wave iv to show up in another one day or so. When it arrives it may not move into subminuette wave i price territory above 1,257.34.
I am having difficulty today in judging the probability of these two hourly wave counts. If I go by structure alone I would have to say this alternate may be more likely, but a judgement from experience and a consideration of Fibonacci ratios would see the main wave count more likely.
This analysis is published about 03:35 p.m. EST.
Extending outward main wave 4 triangle trend line on the weekly chart. Point in time, the point in time they may span the 5 ‘end of the main wave. This is not always effective, but it works often enough to look out for. This is a rough guideline, is not clear. A graph from the main wave on wave four small five goals at this point in time of the last, the main wave 5 will take a total of 26 weeks in order to achieve this, and that is what I would expect. So far, it is in its ninth week.
Will the 26 weeks of the time is how to calculate out