
I had expected 18.335 to be met by 19th September, but price target was too high. Price made a low at 17.347 on 22nd September, and I expect that a second wave correction began there for Silver.
Click on charts to enlarge.
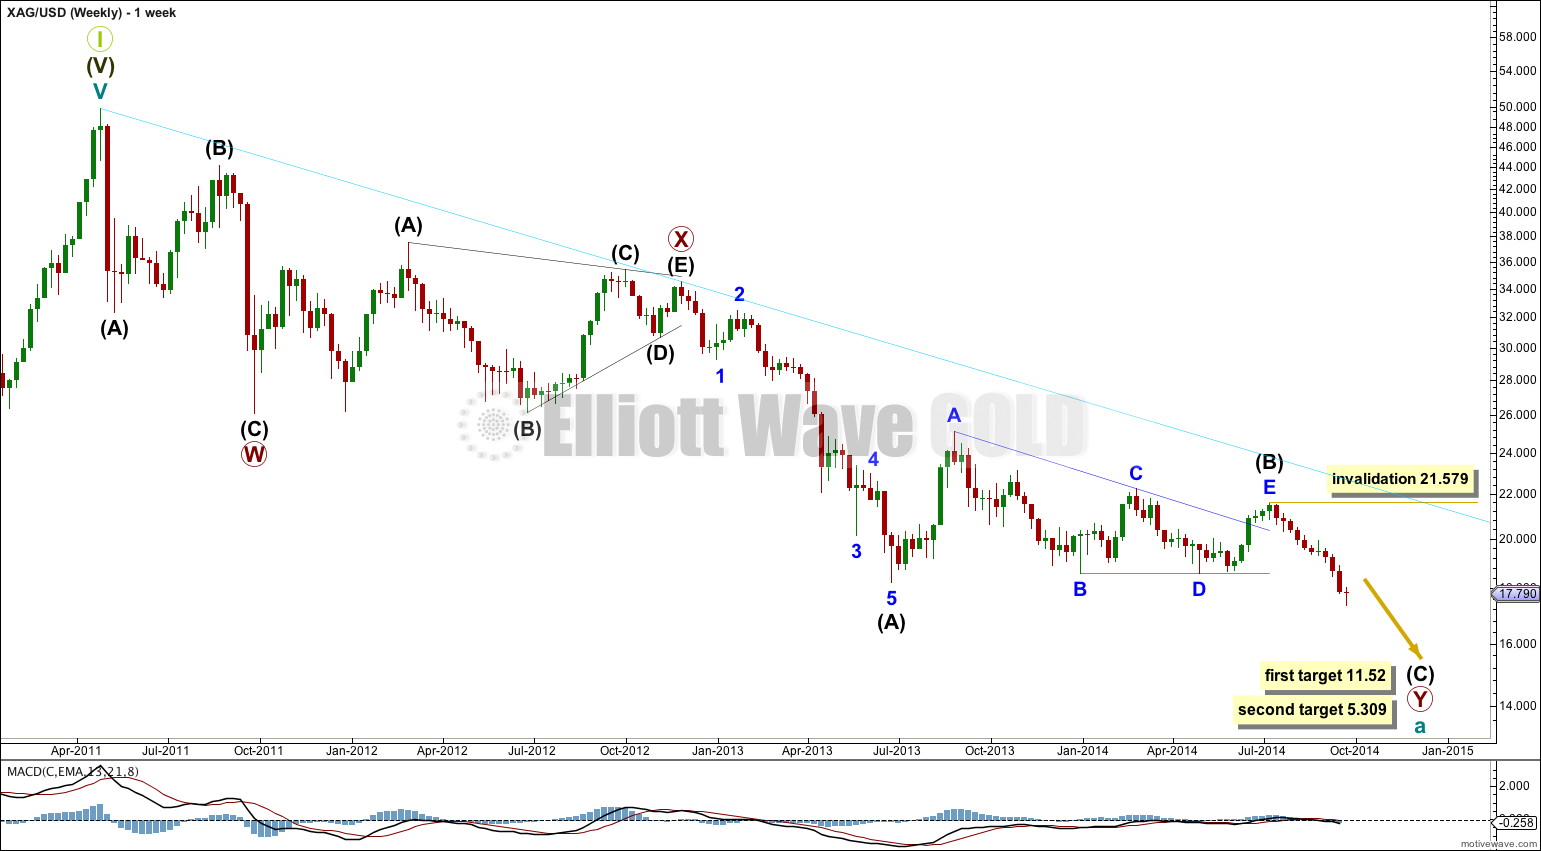
Downwards movement subdivides so far as an incomplete double zigzag. This cannot be an impulse if the movement which I have labeled primary wave X is correct as a triangle because a triangle may not be the sole structure in a second wave position.
The first zigzag in the double is labeled primary wave W. The double is joined by a “three”, a triangle, in the opposite direction labeled primary wave X.
The second zigzag for primary wave Y is moving price lower to deepen the correction, and so this structure has a typical double zigzag look in that it has a clear slope against the main trend.
Within primary wave Y the triangle for intermediate wave (B) is now a complete barrier triangle. Movements following triangles, and particularly barrier triangles, have a tendency to be relatively short and brief (more common), or sometimes they are a very long extension. The higher target has a higher probability for this reason.
Within primary wave Y at 11.52 intermediate wave (C) would reach 0.618 the length of intermediate wave (A). At 5.309 intermediate wave (C) would reach equality in length with intermediate wave (A).
Within primary wave Y intermediate wave (A) lasted 30 weeks, and intermediate wave (B) lasted exactly a Fibonacci 54 weeks. I would expect intermediate wave (C) to end in a total 21 or 34 weeks. So far it has lasted 11 weeks and may yet continue towards the target for a further 10 or 23 weeks, if it exhibits a Fibonacci duration. However, please note, Silver does not reliably exhibit Fibonacci durations nor do its waves reliably exhibit Fibonacci ratios to each other in terms of duration.
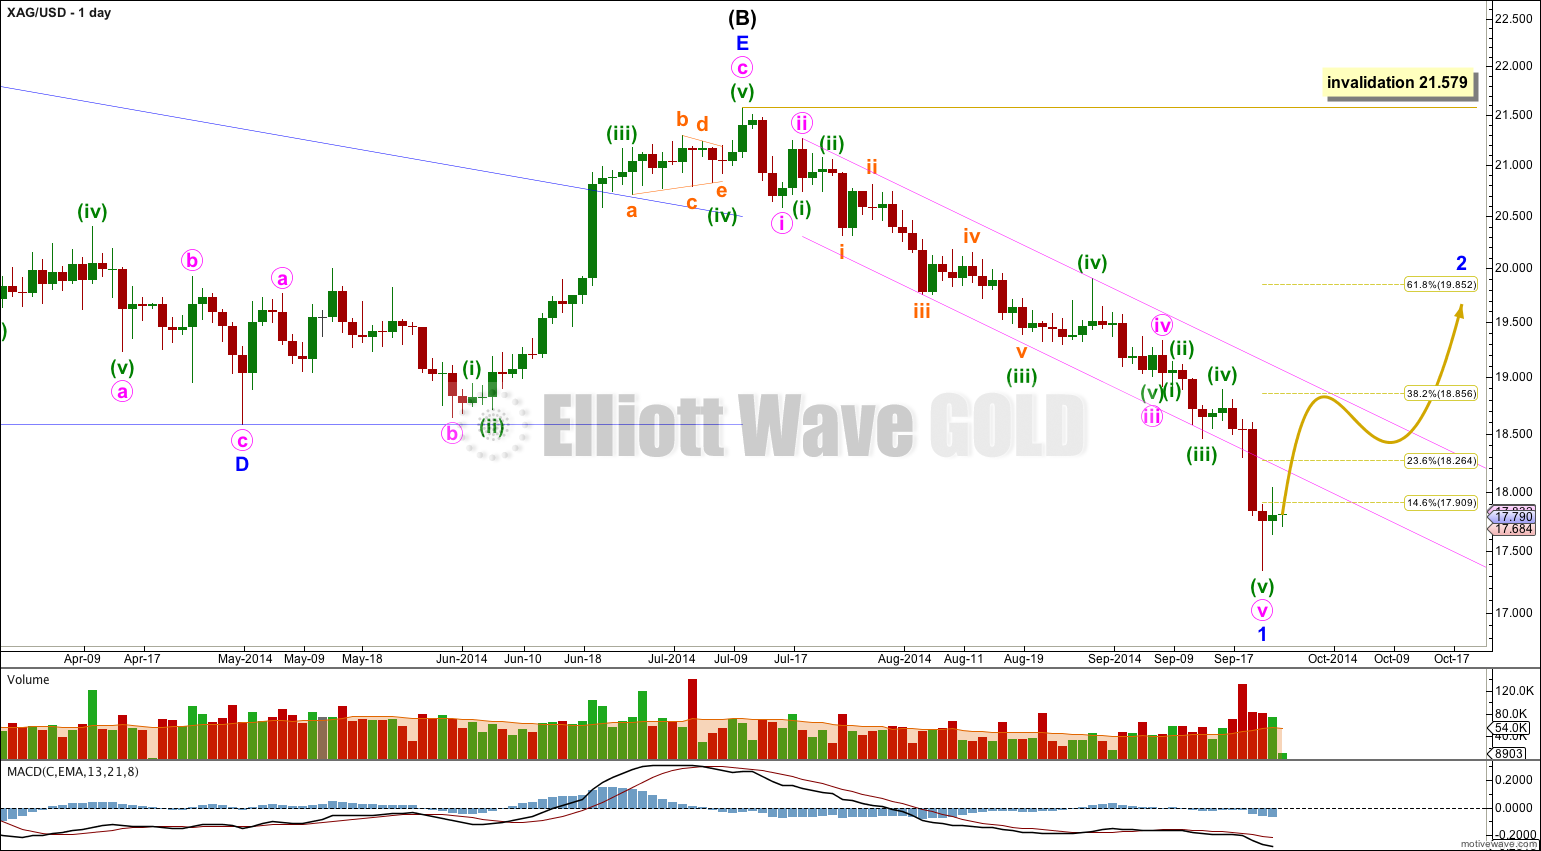
Minor wave 1 is now a complete impulse with a strong fifth wave typical of commodities.
Minor wave 1 does not fit nicely into a channel drawn using either of Elliott’s techniques so I have drawn a best fit channel instead. A breach of this trend channel on the upside would provide trend channel confirmation and confidence in this wave count.
Minor wave 2 should last at least one week, and most likely will be longer. If minor wave 2 is a deep zigzag it may be sharp and quick. If minor wave 2 is a more time consuming flat or combination it may last longer. Minor wave 2 is most likely to reach up to the 0.618 Fibonacci ratio at 19.852, but it does not have to be this deep. The 0.382 Fibonacci ratio should be the first expectation. When price reaches up there the development of the structure within minor wave 2 may illuminate whether or not it will continue higher.
Minor wave 2 is most likely to be a single or double zigzag. It may also be a flat or combination, and these structures allow for a new low as part of minor wave 2. For this reason there can be no lower invalidation point for this wave count at this stage. It is impossible to tell which corrective structure will unfold at the start of a correction, only to say which is more likely.
Minor wave 2 may not move beyond the start of minor wave 1 above 21.579.
Lara, thanks for silver chart. Good to see silver and gold daily chart side-by-side on same day.