
As expected GDX has moved lower. The target for minute wave iii to end was 22.32 and I expected it to be met one to two weeks after last analysis. It looks like it may have ended at 22.02 one and a half weeks after last analysis.
I expect a little sideways movement to end about 22.78, followed by more downwards movement to new lows.
Click charts to enlarge.
The clearest piece of movement is the downwards movement from the high. This looks most like a first, second and third wave. This may be the start of a larger correction.
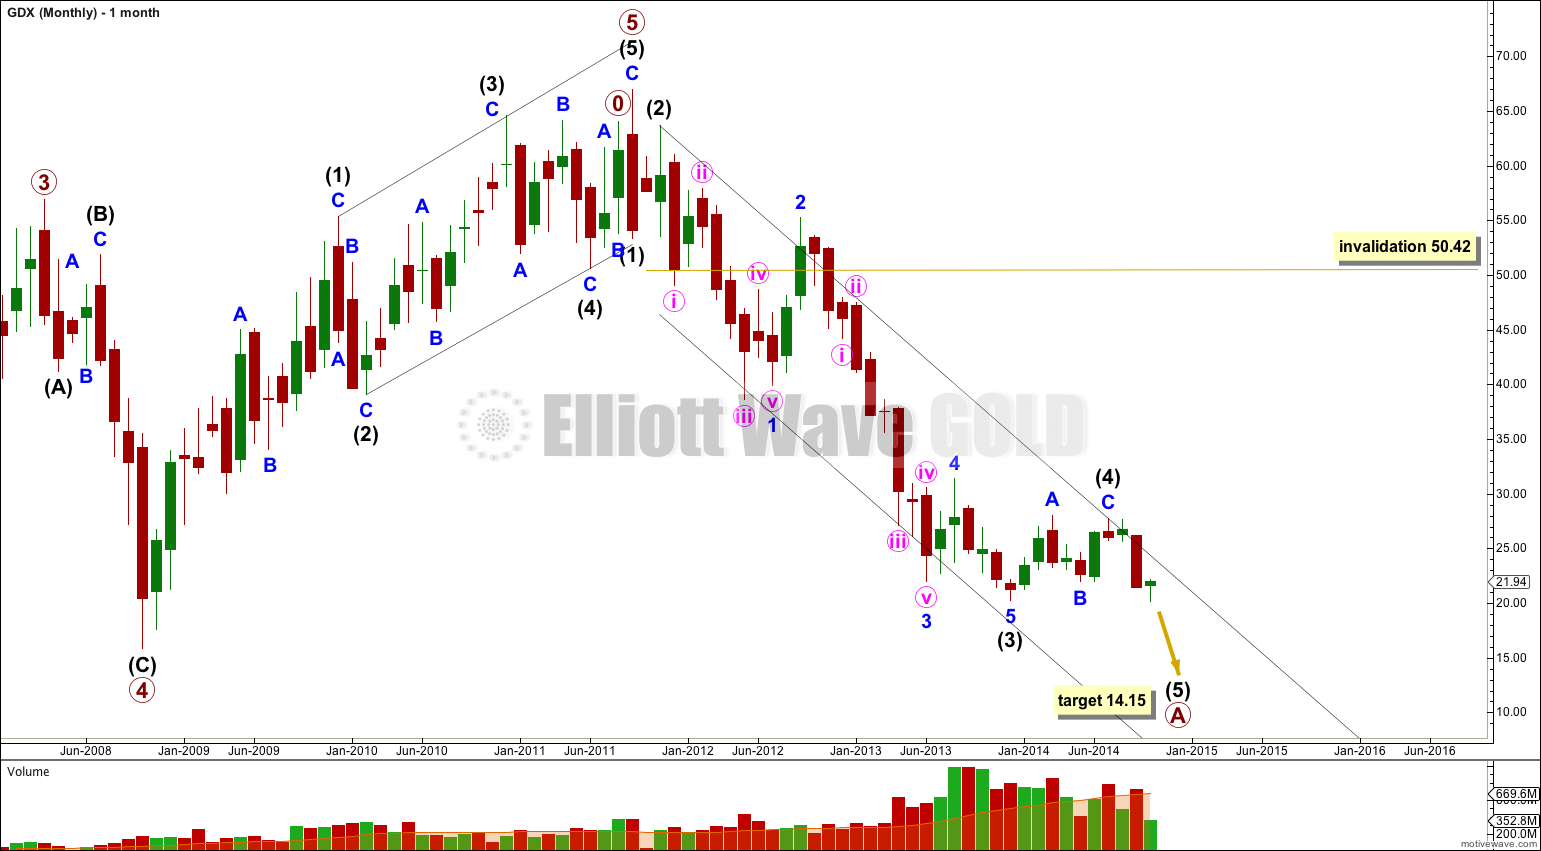
Intermediate wave (3) is $1.06 longer than 2.618 the length of intermediate wave (1).
Within intermediate wave (3) there are no Fibonacci ratios between minor waves 1, 3 and 5.
Ratios within minor wave 1 of intermediate wave (3) are: minute wave iii has no Fibonacci ratio to minute wave i, and minute wave v is $2.19 longer than 0.618 the length of minute wave i.
Ratios within minor wave 3 of intermediate wave (3) are: minute wave iii has no Fibonacci ratio to minute wave i, and minute wave v is $0.63 longer than 0.382 the length of minute wave iii.
I have played with how to best draw a channel about this downwards movement, which does not fit perfectly into a channel drawn using either of Elliott’s techniques but does fit best if his first technique is used: draw the first trend line from the lows of intermediate waves (1) to (3), then place a parallel copy on the high of intermediate wave (2).

Minor wave 1 is now most likely complete. In making this judgement I am relying on three things:
1. The wave count for the Gold cash market sees an intermediate degree trend change at this point.
2. The subdivisions within minor wave 1 are complete.
3. Proportions between second and fourth wave corrections within GDX sometimes differ by multiples up to 5.33.
Within minor wave 1 downwards minute wave iv lasted only 4 days while minute wave ii lasted 21 days. This is a multiple of 5.25.
I have looked back at recent movements which are completed within GDX to see the difference between prior second and fourth waves in terms of duration. For example:
– On this daily chart within minor wave A minute wave iv lasted 16 days, while minute wave ii lasted 3 days, a multiple of 5.33.
– Within intermediate wave (3) minor wave 4 lasted 101 days while minor wave 2 lasted 42 days, a multiple of 2.4.
– Within minor wave 3 there minute wave iv lasted 35 days while minute wave ii lasted 7 days, a multiple of 5.
So it is not unusual for GDX to not exhibit good proportions. Or my entire wave count is wrong. I do not think GDX has enough volume to exhibit typical looking Elliott Wave structures, and so this does make Elliott wave analysis of this market prone to error and poor probability. I am also learning after analysing this market now for about one year that it does not regularly exhibit close Fibonacci ratios between its waves, and this makes target calculation very much hit and miss (with more miss than hit).
Because of the nature of this market I strongly advise members to always use their own technical analysis tools in conjunction with my Elliott wave analysis of this market. I will also let the wave count for the Gold cash market lead the wave count for GDX.
At 14.15 intermediate wave (5) would reach equality in length with intermediate wave (1). This target is likely to be several weeks away.
Thanks for the update Lara!
Thanks for the update Lara! I trade this market regularly, so having your insight is extremely valuable. I agree that it looks like minor wave 1 has ended, with the biggest green candlestick we’ve seen in this entire down move. Cheers!