I had expected a little more upwards movement to 1,185 before price turned down. This is not what happened. Downwards movement does fit the Elliott wave count nicely.
Summary: Minor wave 2 is most likely incomplete. I expect downwards movement to at least 1,141.95 as very likely. Thereafter, a new high above 1,178.83 is extremely likely. Minor wave 2 may end in another two or five days if it exhibits a Fibonacci duration.
Click on charts to enlarge.
Main Wave Count
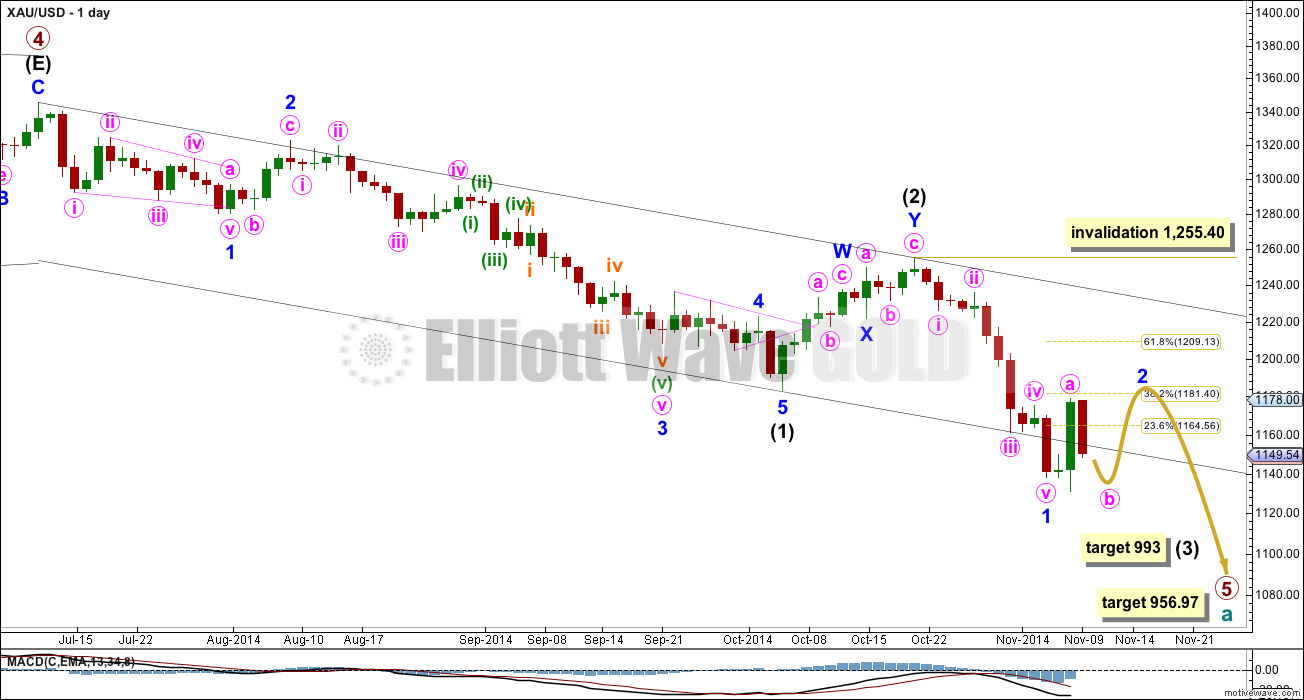
Primary wave 4 is complete and primary wave 5 is unfolding. Primary wave 5 may only subdivide as an impulse or an ending diagonal. So far it looks most likely to be an impulse.
Within primary wave 5 intermediate wave (1) fits perfectly as an impulse. Intermediate wave (2) is a relatively shallow 45% double zigzag correction.
Intermediate wave (3) may only subdivide as an impulse, and at 993 it would reach 1.618 the length of intermediate wave (1).
The target for primary wave 5 at this stage remains the same. At 956.97 it would reach equality in length with primary wave 1. However, if this target is wrong it may be too low. When intermediate waves (1) through to (4) within it are complete I will calculate the target at intermediate degree and if it changes it may move upwards. This is because waves following triangles tend to be more brief and weak than otherwise expected. A perfect example is on this chart: minor wave 5 to end intermediate wave (1) was particularly short and brief after the triangle of minor wave 4.
Intermediate wave (3) must move far enough below the end of intermediate wave (1) to allow room for upwards movement for intermediate wave (4) which may not move into intermediate wave (1) price territory.
Minor wave 2 may not move beyond the start of minor wave 1 above 1,255.40.
Because this is a second wave correction within a third wave one degree higher it may be more quick and shallow than second waves normally are. When minute wave b within it is complete I will calculate a target upwards for minute wave c to end. It may not be as high as the 0.618 Fibonacci ratio.
If minor wave 2 exhibits a Fibonacci duration it may last another two or five days to total a Fibonacci five or eight.
The black channel is a base channel about intermediate waves (1) and (2): draw the first trend line from the start of intermediate wave (1) to the end of intermediate wave (2), then place a parallel copy on the end of intermediate wave (1). Intermediate wave (3) has breached the lower edge of the base channel which is expected.
Main Hourly Wave Count
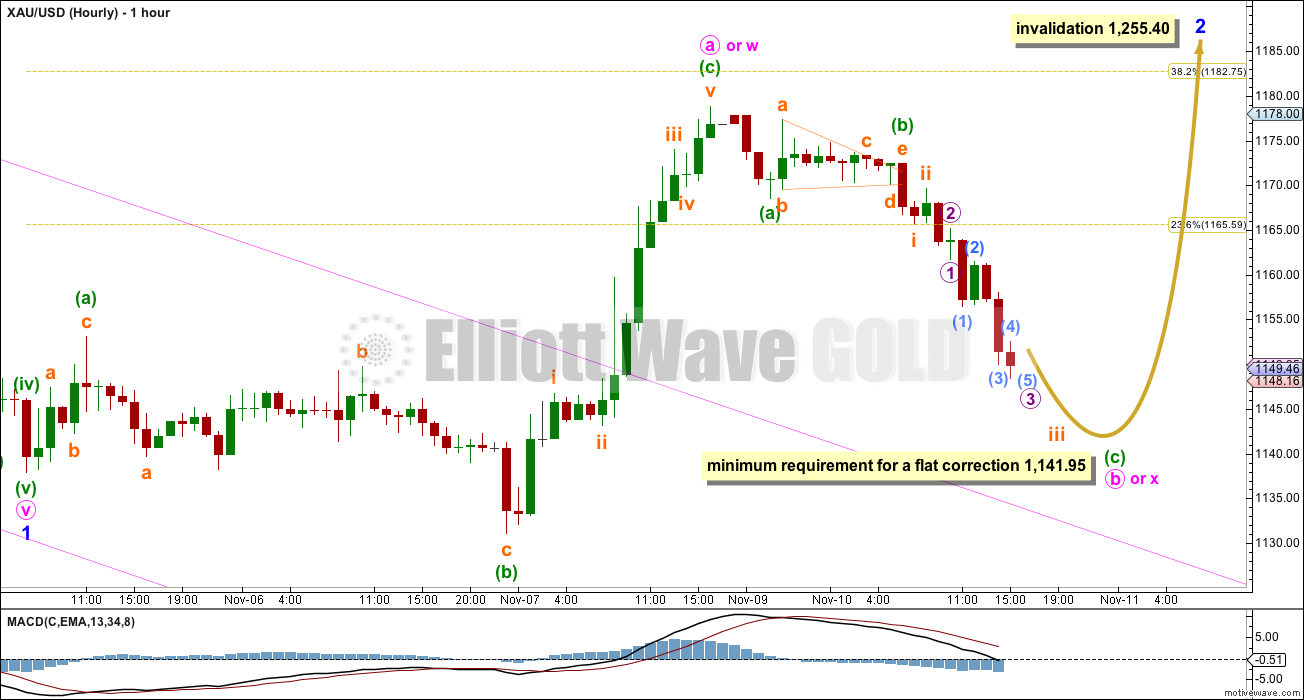
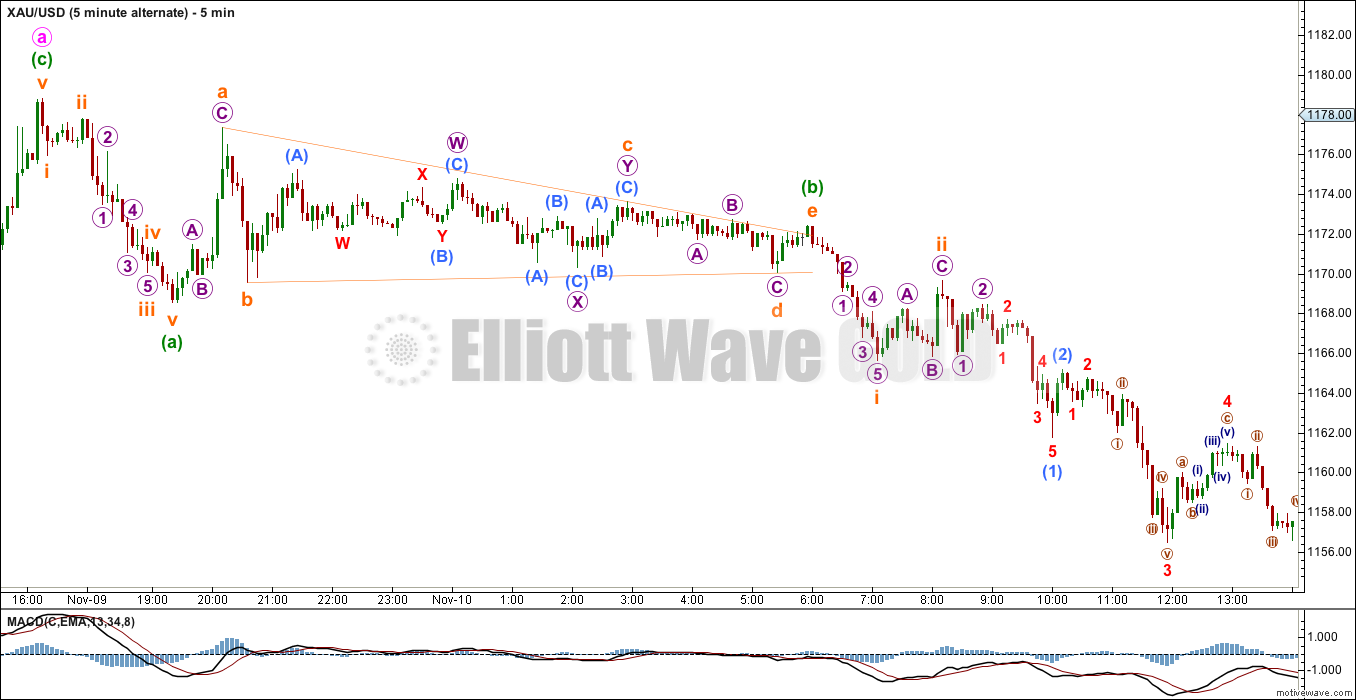
I am swapping over my prior main and alternate hourly wave counts because of the triangle I can see which is labelled here minuette wave (b). A triangle may not be the sole corrective structure for a second wave, so this piece of movement is most likely to be a B wave triangle. This means minor wave 2 is unlikely to be over. Because this piece of movement is crucial to the wave count I have provided the five minute chart for you below.
Minor wave 2 may be continuing as a flat, double combination or double flat. If it is a flat correction then within it minute wave b must reach back down to a minimum 90% length of minute wave a at 1,141.95 or below. An expanded flat may see minute wave b make a new low below the start of minute wave a at 1,137.85.
If minor wave 2 is continuing as a double flat or combination then there is no minimum downwards requirement for minute wave x.
This wave count expects to see another red candlestick for Tuesday’s session most likely to 1,141.95 or below. Thereafter, this wave count expects to see one or four days of upwards movement to above 1,178.83.
Alternate Hourly Wave Count
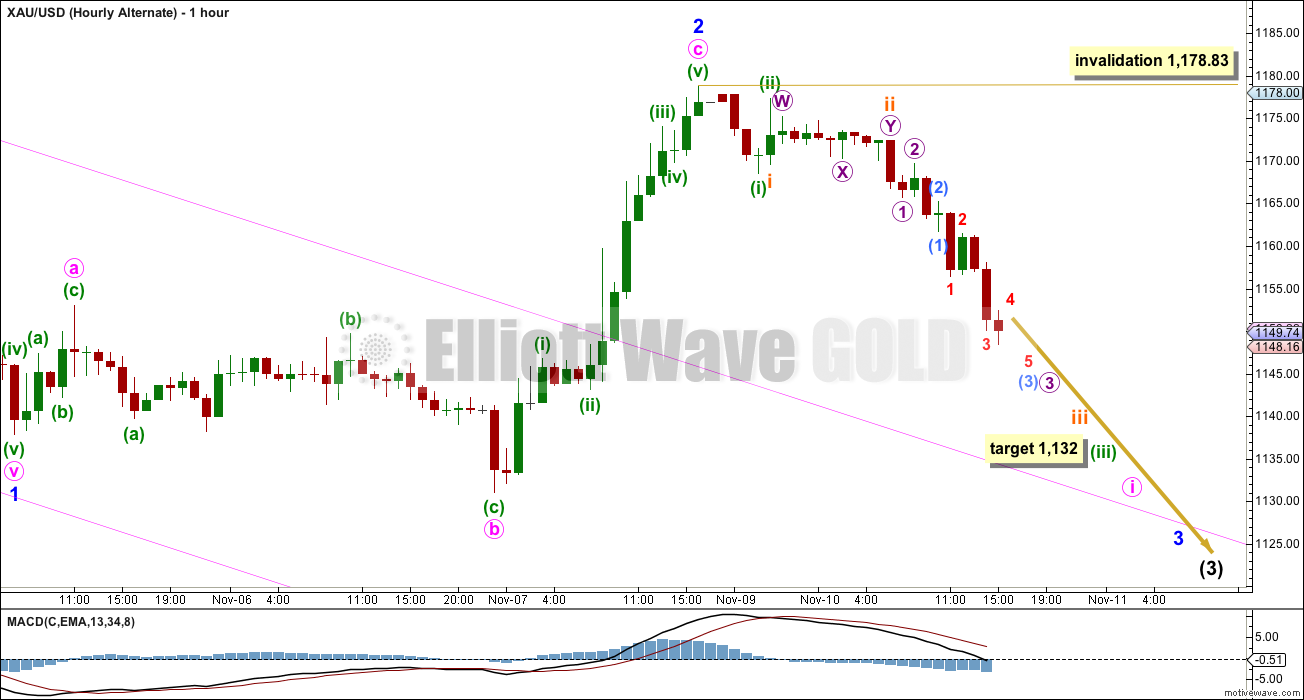
If minor wave 2 is over then in the very early stages down of minor wave 3 the subdivisions do not have a good fit on the five minute chart. It is possible that subminuette wave ii is a double combination.
At 1,132 minuette wave (iii) would reach 4.236 the length of minuette wave (i).
When minute wave i is complete (it may be over within the next 24 hours) then minute wave ii may not move beyond the start of minute wave i above 1,178.83.
I would look for downwards movement to find some support at the upper edge of the pink channel drawn about minor wave 1 downwards. If this alternate wave count is correct downwards movement should show a clear strong increase in momentum, and price should quickly break through the upper pink trend line.
This analysis is published about 04:02 p.m. EST.


The minimum was only required for a flat correction.
The alternate labelling of w-x-y does not require a minimum length for x.
So now we can narrow down the options for minor wave 2 to either a double flat or double combination.
Yes, it should go higher. My target is 1,179 – 1,183. If it ends in just one more session it will last a Fibonacci five sessions / days.
Gold has been correcting upwards today and didnt reach the 1141.95 minimum, if gold doesnt go down to 1,141.95 today, is there any other scenario where wave 2 could still go higher? Or is it 1141.95 minimum or its going down to the alternate?