Downwards movement was expected and a red candlestick fits the Elliott wave count nicely.
Summary: This consolidation phase may continue for another two days, possibly a little longer. Before it is over we should see a false breakout upwards to 1,179 – 1,183. When the consolidation phase ends the eventual breakout will be downwards and very strong.
Click on charts to enlarge.
Main Wave Count
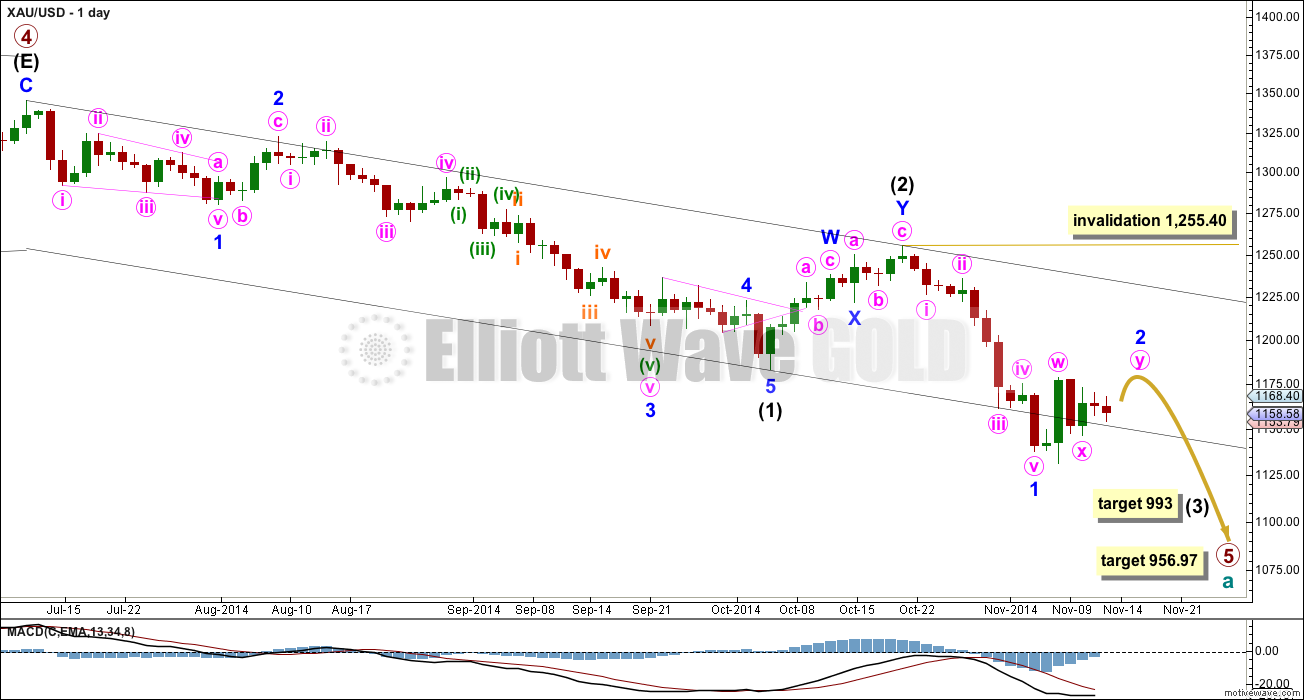
Primary wave 4 is complete and primary wave 5 is unfolding. Primary wave 5 may only subdivide as an impulse or an ending diagonal. So far it looks most likely to be an impulse.
Within primary wave 5 intermediate wave (1) fits perfectly as an impulse. Intermediate wave (2) is a relatively shallow 45% double zigzag correction.
Intermediate wave (1) lasted a Fibonacci 13 weeks. I would expect intermediate wave (3) to be extended in both price and duration. If it lasts a Fibonacci 21 weeks it would be 1.618 the duration of intermediate wave (1). So far intermediate wave (3) is in its third week.
Intermediate wave (3) may only subdivide as an impulse, and at 993 it would reach 1.618 the length of intermediate wave (1).
The target for primary wave 5 at this stage remains the same. At 956.97 it would reach equality in length with primary wave 1. However, if this target is wrong it may be too low. When intermediate waves (1) through to (4) within it are complete I will calculate the target at intermediate degree and if it changes it may move upwards. This is because waves following triangles tend to be more brief and weak than otherwise expected. A perfect example is on this chart: minor wave 5 to end intermediate wave (1) was particularly short and brief after the triangle of minor wave 4.
Intermediate wave (3) must move far enough below the end of intermediate wave (1) to allow room for upwards movement for intermediate wave (4) which may not move into intermediate wave (1) price territory.
Minor wave 2 may not move beyond the start of minor wave 1 above 1,255.40.
Because this is a second wave correction within a third wave one degree higher it may be more quick and shallow than second waves normally are. At this stage I expect minor wave 2 to only reach up to about the 0.382 Fibonacci ratio at 1,182.75.
If minor wave 2 exhibits a Fibonacci duration it may end in another two days to total a Fibonacci eight.
The black channel is a base channel about intermediate waves (1) and (2): draw the first trend line from the start of intermediate wave (1) to the end of intermediate wave (2), then place a parallel copy on the end of intermediate wave (1). Intermediate wave (3) has breached the lower edge of the base channel which is expected.
Main Hourly Wave Count
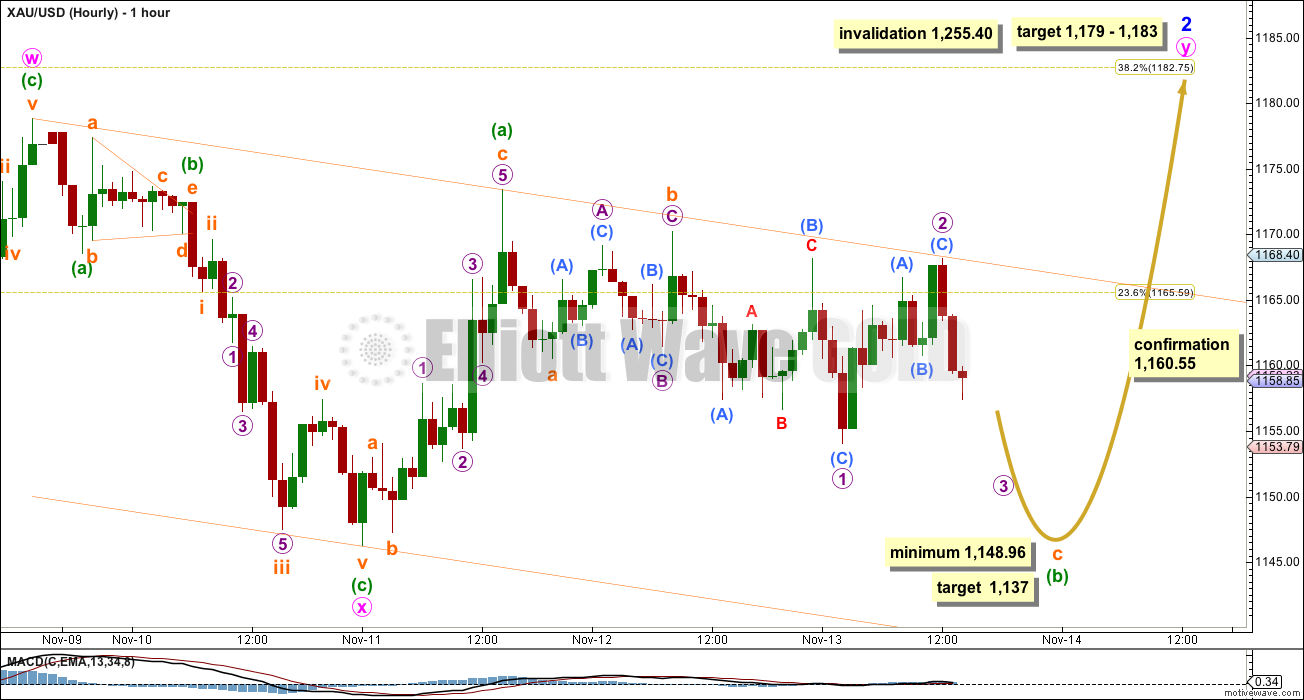
Minor wave 2 is most likely unfolding as a double flat correction, but it may also be a double combination.
This first main hourly wave count and the first alternate below I judge today to have a close to even probability.
The first structure in this double is an expanded flat labeled minute wave w. The double is joined by a three in the opposite direction, a zigzag labeled minute wave x.
Because the downwards zigzag of minute wave x is only 80% the length of minute wave w, I am ruling out a bigger flat correction for minor wave 2. Within a flat correction the B wave must be a minimum 90% length of the A wave, and here this minimum was not met.
The second structure in the double is incomplete. It is labelled minute wave y.
Within minute wave y the first wave up is a zigzag labelled minuette wave (a). Because this subdivides best as a zigzag (it is almost impossible to see this as a five) I have ruled out a zigzag unfolding for minute wave y because a zigzag requires its A wave to subdivide as a five.
Minute wave y may be either a flat correction (most likely) or a triangle (less likely). Only if the minimum downwards requirement for a flat at 1,148.96 is not met would I consider a triangle for minute wave y.
If minute wave y completes as a more likely flat correction then within it minuette wave (b) must reach a minimum 90% length of minuette wave (a) at 1,148.96. Minuette wave (b) may move beyond the start of minuette wave (a) at 1,146.25, and is in fact reasonably likely to do so as an expanded flat where B is 105% or more of A is the most common type.
At 1,137 subminuette wave c would reach 2.618 the length of subminuette wave a.
The most common length for minuette wave (b) is between 100% to 138% the length of minuette wave (a), between 1,146.25 to 1,136.
Subminuette wave c looks like it is unfolding as an ending diagonal because it is subdividing as lower moving zigzags. Ending diagonals require all their subwaves to subdivide as zigzags. Micro wave 3 must move beyond the end of micro wave 1, and thereafter micro wave 4 should overlap back into micro wave 1 price territory. The diagonal is more likely to be contracting because they are more common.
Diagonals are slow moving structures. This indicates that minor wave 2 may need a little longer than just two more sessions to complete.
Minute wave y is likely to end about the same level as minute wave w, at 1,179, because the purpose of double combinations and double flats is to move price sideways and take up time. To achieve this purpose the second structure in the double normally ends close to the same level as the first. This is close to the 0.382 Fibonacci ratio about 1,183.
In more traditional technical analysis jargon, overall at this stage I am confident that Gold remains within a correction and the consolidation phase will continue for at least two more days. Eventually the break out, when it comes, will be to the downside, and it will be remarkably strong. But there may be a “false” upwards “breakout” first.
First Alternate Hourly Wave Count
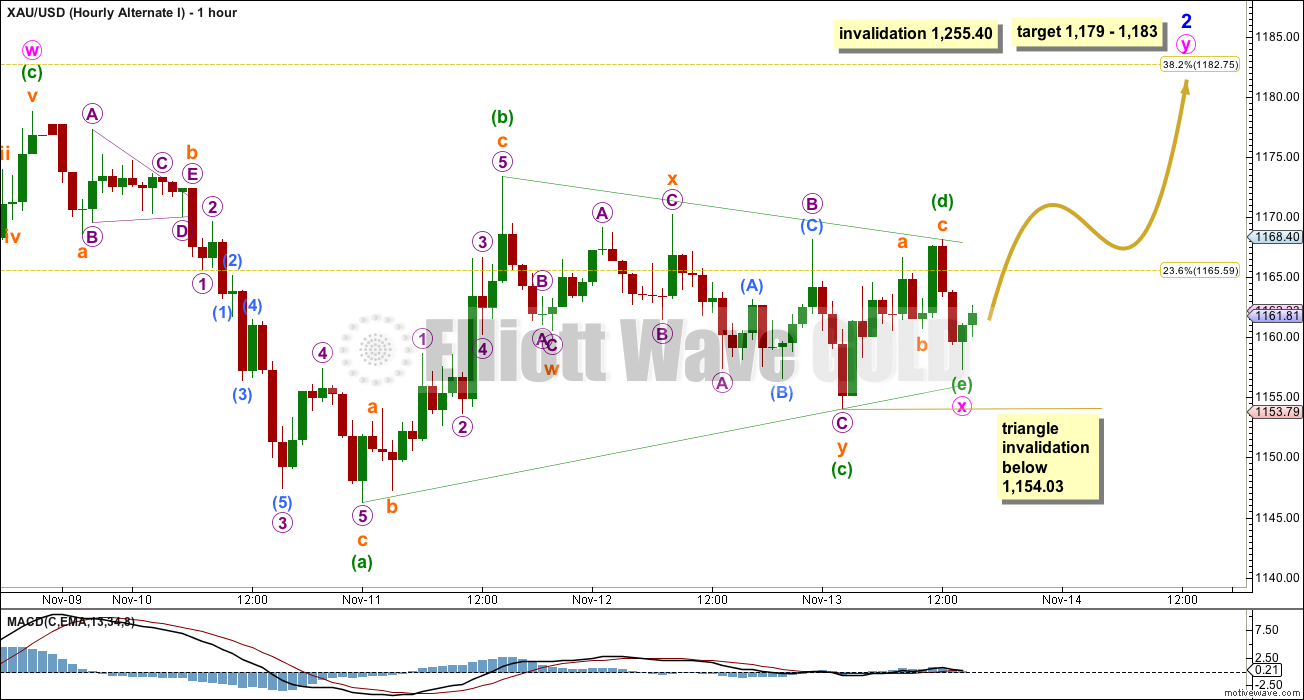
It is also now possible that minor wave 2 is an incomplete double combination or double flat, with minute wave x within the double a just or almost complete triangle.
In the short term this wave count expects upwards movement, where the first main wave count expects downwards movement. The final target is the same for the same reason.
For the triangle to remain valid minuette wave (e) may not move beyond the end of minuette wave (c) below 1,154.03.
Minute wave y would most likely be a zigzag, but it may also be a flat correction. If it completes in just two more days minor wave 2 could total a Fibonacci eight days.
In more traditional technical analysis jargon, this first alternate expects the consolidation phase to end more quickly, but still to see a false breakout upwards before the true breakout to the downside arrives.
Second Alternate Hourly Wave Count
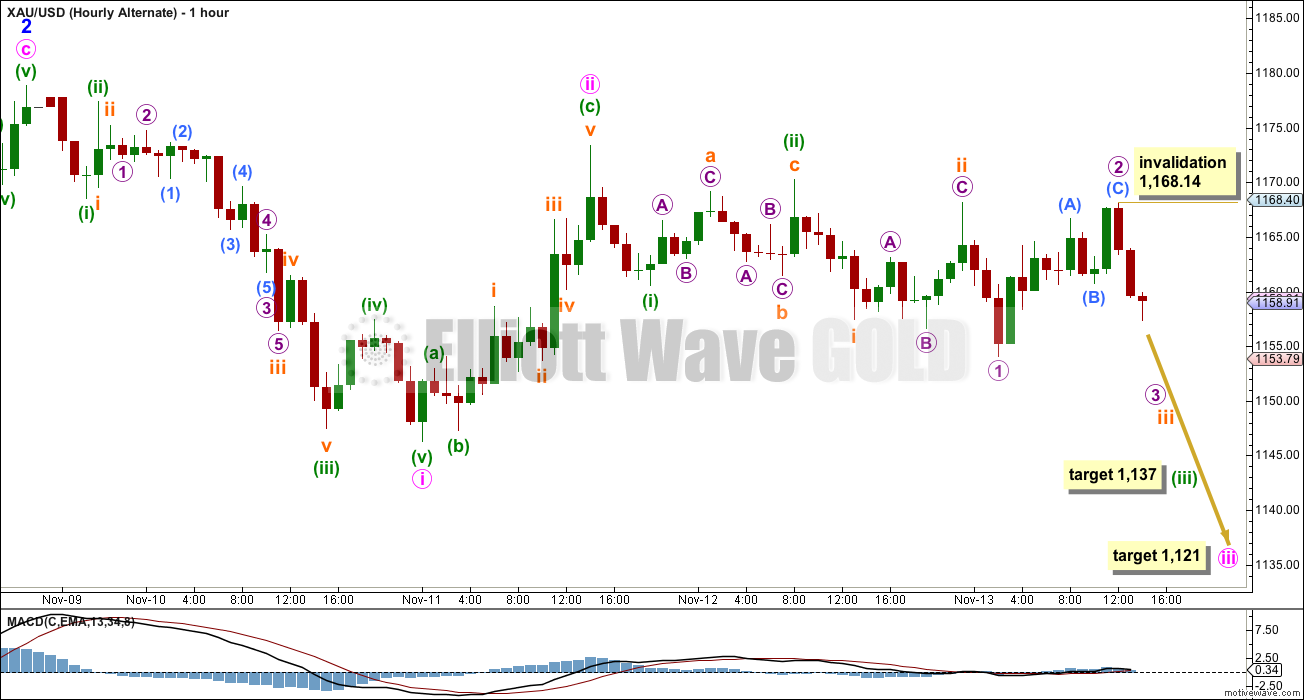
I would almost not publish this alternate today, except it remains technically valid. I would judge it to have a very low probability, maybe only 1%.
The middle portion of third waves are remarkably strong. This wave count sees Gold as within a third wave at micro degree, within a third wave at subminuette degree, within a third wave at minuette degree, within a third wave at minute degree, within a third wave at minor degree, within a third wave at intermediate degree. If that is the case then downwards momentum should be increasing clearly and strongly.
This wave count does not have the right look.
Only if downwards movement breaks below 1,136 (the maximum common length for downwards movement for the main wave count) and momentum increases strongly would I take this wave count seriously.
The fact that this wave count looks so wrong gives me more confidence today in the main wave count. This is my second main reason for publishing this alternate today.
This analysis is published about 03:56 p.m. EST.


I do not know. Maybe some other members can share where they get this data from?
Try posting your question again in today’s analysis Bernard. Now you have a comment approved you should automatically have subsequent comments approved.
Why is nobody looking at investor sentiment? Commitment of small traders shorting gold was at 3 per cent recently. This is the lowest it has been in fifteen years. This indicates wave 5 is completed very likely already.
Where to see the COT data of Gold..? Do you have specific website to share ?
This breakout is looking pretty legit…
Lara, I’d rather see your 2nd alternate show gold in Int 2 correction. My only concern is there are 5 clear waves down on the daily chart. There are 5 clear waves up on the USD chart. The correlation is perfect and maybe too perfect and obvious.
I’m not seeing that five down on the daily chart that you see though. I think you’re referring to the alternate I had and last published 6th November? Where intermediate (2) was a single zigzag and intermediate (4) a double?
I guess that could work… if you moved it all down one degree (as you suggest). But then that would be a very long minor degree wave.
And I still have a problem with that lack of alternation.
I’m looking at US Dollar and I’m seeing an almost complete 5-3-5 up from the low in July. But the second five is much shorter than the first, so that means its unlikely to be a third wave (they’re usually longer) so its probably only a first wave within a third, so US Dollar should be ready to shoot up strongly.
30 year chart of USD from Rambus. Plenty of room for more up with corrections along the way.
Thanks Lara! The move today looks like it’s not moving price sideways and may be confirming what I said earlier in that this looks more like int 2. It looks like we will easily close above key resistance at $1180ish.
Yep. And it did.
Chapstick_jr
I think you have too many concerns.
When I have concerns, I meditate.
When I analysed Lara’s update last night I was at ease as usual as she is the best. My motto is when in doubt, trust in Lara. LOL
Richard, you are crazy about having too many concerns! I’m only using other TA tools to confirm my thesis as any other good trader would do. See my post on Nov 14th for details. By the way, there are very good EW and TA guys suggesting P5 is over at $1131. I’m not in that camp yet. Lara is very good, but isn’t right 100% percent of the time. I simply presented an alt view and gave a reason why. I present it to help others so they can decide.
I wouldn’t go as far as Chapstick… But you know that I’m not always right. I always strongly advise members to do their own due diligence, to use their own preferred TA methods to assist you in your decisions.
The reason why members pay me to do the EW analysis is EW is more complicated and takes more time. I save you time and you ensure you get the best EW analysis of which I am capable.
I would not recommend anyone rely solely on my EW analysis though.
If your analysis is in agreement with my expected directions and targets, then you may have more confidence in your decisions. If your analysis disagrees with mine, then it is up to you to judge who you think is correct, and whether to wait or make a trade based on your analysis or mine.
There is simply no way I can always be right.
As for the end of week analysis, I have stated that I don’t have confidence that minor 2 is over until the confidence points are passed. Thats a really important distinction that I hope all members get; this is why I provide price points beyond which my analysis has a better probability.
Lara, well done summary, highlights in concise clear terms what is happening and what to expect.
You’re welcome.