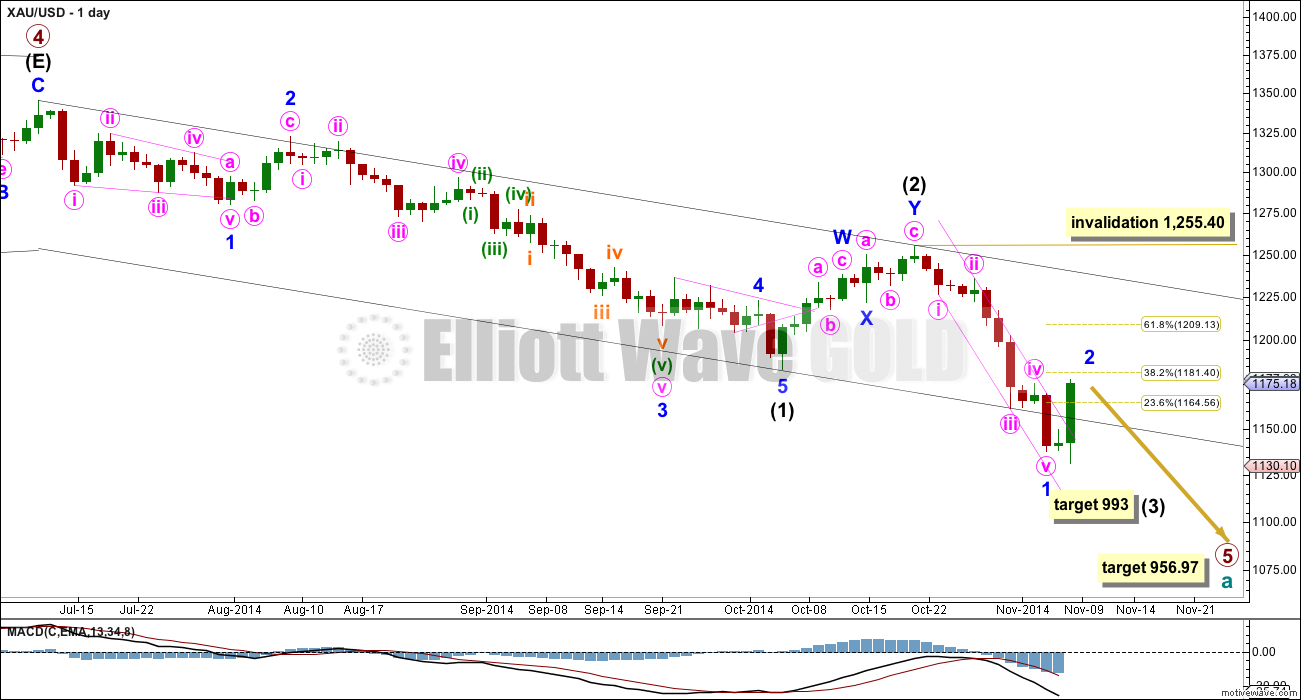
Although the short term expectation of upwards movement first was not played out, overall a new low followed by upwards movement fits the Elliott wave count nicely.
Summary: Minor wave 2 may be close to completion and could end in just one more day at about 1,185. Alternatively, minor wave 2 may last another three days.
Click on charts to enlarge.
Main Wave Count
Primary wave 4 is complete and primary wave 5 is unfolding. Primary wave 5 may only subdivide as an impulse or an ending diagonal. So far it looks most likely to be an impulse.
Within primary wave 5 intermediate wave (1) fits perfectly as an impulse. Intermediate wave (2) is a relatively shallow 45% double zigzag correction.
Intermediate wave (3) may only subdivide as an impulse, and at 993 it would reach 1.618 the length of intermediate wave (1).
The target for primary wave 5 at this stage remains the same. At 956.97 it would reach equality in length with primary wave 1. However, if this target is wrong it may be too low. When intermediate waves (1) through to (4) within it are complete I will calculate the target at intermediate degree and if it changes it may move upwards. This is because waves following triangles tend to be more brief and weak than otherwise expected. A perfect example is on this chart: minor wave 5 to end intermediate wave (1) was particularly short and brief after the triangle of minor wave 4.
Intermediate wave (3) must move far enough below the end of intermediate wave (1) to allow room for upwards movement for intermediate wave (4) which may not move into intermediate wave (1) price territory. Although a five wave structure downwards can now be seen complete within intermediate wave (3) it has not moved low enough. Only minor wave 1 within it is complete.
Minor wave 2 may not move beyond the start of minor wave 1 above 1,255.40.
Because this is a second wave correction within a third wave one degree higher it may be more quick and shallow than second waves normally are. At this stage it looks like it may only reach up to about the 0.236 Fibonacci ratio most likely about 1,164.56. It may find resistance at the lower edge of the base channel which previously provided support. It may last a Fiboancci 5 or 8 days in total.
The black channel is a base channel about intermediate waves (1) and (2): draw the first trend line from the start of intermediate wave (1) to the end of intermediate wave (2), then place a parallel copy on the end of intermediate wave (1). Intermediate wave (3) has breached the lower edge of the base channel which is expected.
Draw a channel about minor wave 1 on the daily chart and copy it over to the hourly chart. Draw the first trend line from the lows labelled minute waves i to iii, then place a parallel copy on the high labelled minute wave ii.
Main Hourly Wave Count
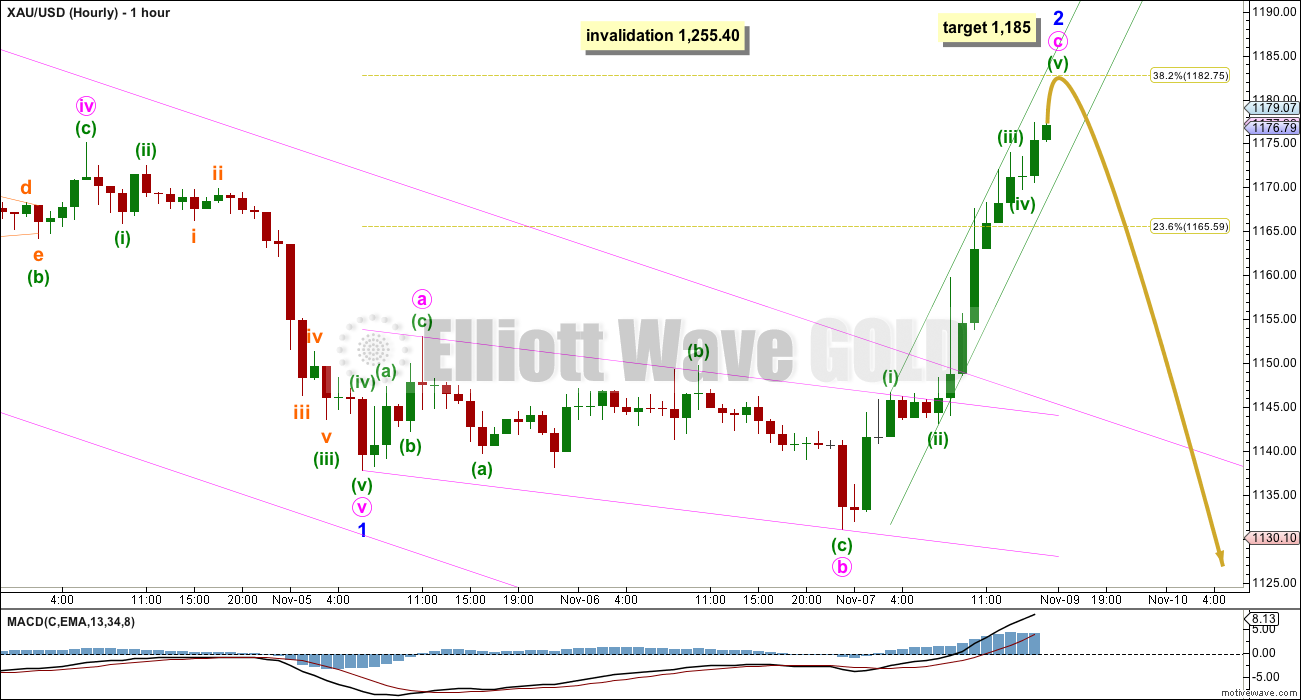
Because this is a second wave correction within a third wave at intermediate degree, it is likely to be more shallow and brief than second waves normally are. Because it is getting close to the 0.382 Fibonacci ratio of intermediate wave (1) it looks like it may be very close to completion.
Minor wave 2 may be unfolding as a single expanded flat correction. Within it minute wave b is a 144% correction of minute wave a, and minute wave c is over 2.618 the length of minute wave a. Minute waves a and c probably will not exhibit a Fibonacci ratio to each other.
Within minute wave c minuette wave (iii) exhibits no Fibonacci ratio to minuette wave (i). This makes it very likely that minuette wave (v) will exhibit a Fibonacci ratio to either of waves (i) or (iii). At 1,185 minuette wave (v) would reach equality in length with minuette wave (i).
Expanded flats do not fit into parallel channels. Draw a channel using Ellliott’s first technique about minute wave c: draw the first trend line from the ends of minuette waves (i) to (iii), then place a parallel copy on the end of minuette wave (ii). Minuette wave (v) may end about the upper green trend line. When this channel is very clearly breached by downwards (not sideways) movement that shall provide trend channel confirmation that this expanded flat correction is complete.
If minor wave 2 ends in just one more day it may total a Fibonacci 3 days.
The structure of the next wave down will indicate which hourly wave count is correct. Both hourly wave counts expect exactly the same movement next.
This main wave count expects the next wave down to be a clear five wave structure, as the only allowable structure for minor wave 3 is a simple impulse.
Minor wave 3 must move below the end of minor wave 1 at 1,137.85.
Alternate Hourly Wave Count
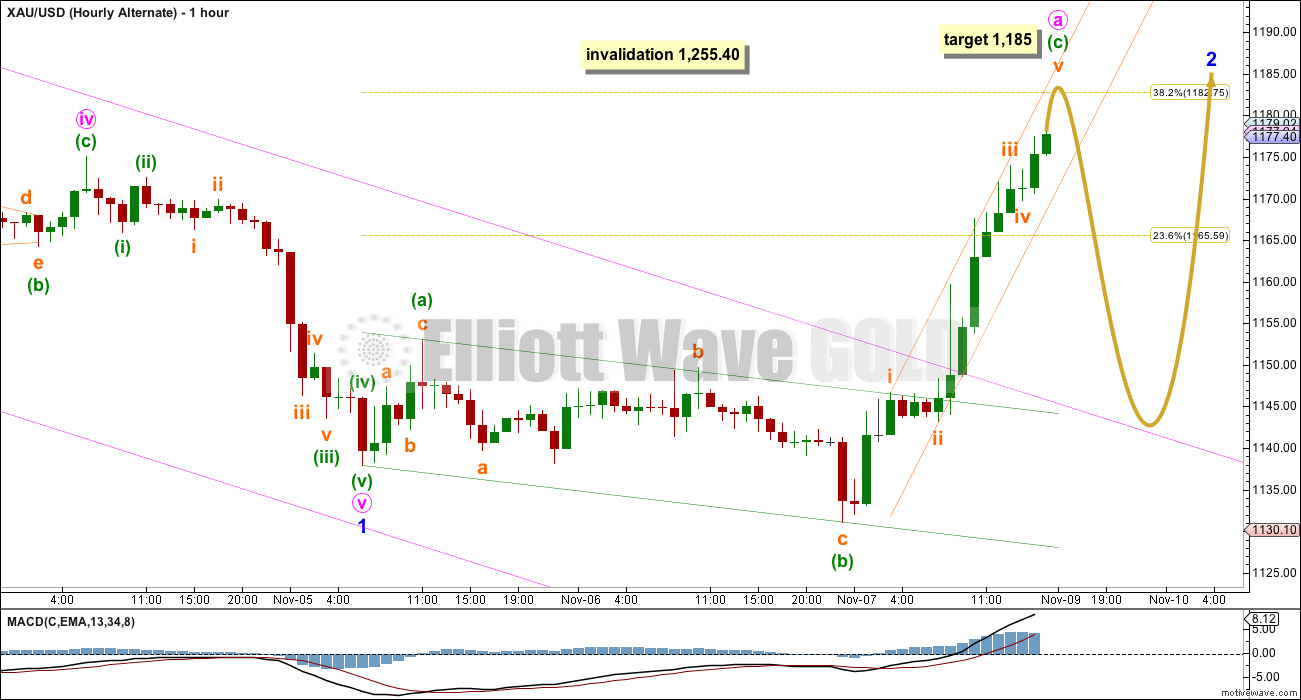
By simply moving the degree of labelling within minor wave 2 all back down one degree it is possible that only minute wave a (or w) of a larger flat correction, combination or double flat, is almost complete.
This alternate wave count expects the next wave down to be a three wave structure for minute wave b of a bigger flat correction, or minute wave x of a double flat or double combination. It may find support at the upper edge of the pink channel copied over from the daily chart, or it may make a new low below the start of minute wave a at 1,137.85 and is actually quite likely to do so.
If minor wave 2 continues for another three days it may total a Fibonacci five days.
This analysis is published about 06:29 p.m. EST.


Lara your description under the main wave count Nov 7th reads. “Because this is a second wave correction within a third wave one degree higher it may be more quick and shallow than second waves normally are. At this stage it looks like it may only reach up to about the 0.236 Fibonacci ratio most likely about 1,164.56.”
I believe those numbers applied to Nov 6th and the November 7th main wave count, should be changed to second wave, reach up to about the 0.382 Fibonacci ratio most likely about 1,181.40.
Thank you.
ah yes, sorry! thank you Richard!
Every Gold trader should be aware of November 30th.
http://www.kitco.com/news/2014-11-07/Commerzbank-Gold-Would-Get-Pronounced-Boost-If-Swiss-Referendum-Passes.html
Lara, similar to the question from Danil, what do you make of this long weekly tail bouncing off of the long term trend line? Should a bullish alternate be considered? Thanks,
Lara, this is what I was referring to yesterday. It sure looks like five waves down from the July top. You always said the target could be too low and movement out of triangles are usually fast & swift. With everyone looking for $1000 gold, this would be an ideal spot to bottom.
The upwards move was too strong? I would have thought it fitted quite nicely as its pretty shallow.
That chart with the trend line… I have tried to replicate it. When I do that on an arithmetic scale the current low has not touched the trend line, when I do it on a semi-log scale price has broken through the trend line.
I’ll show you at the end of today’s video what I mean. I just can’t get it to work like that! Maybe we’re using different data feeds…. I don’t know.
Hello Lara,
Have you completely ruled out the alternate count that sees primary wave 5 over?
you have found more reasons for that?
Regards,
Danil
Yes, I am ruling it out. Because the final fifth wave no longer subdivides as a clear five wave structure after the new low on 7th November.
To keep that count alive we would have to see the final fifth wave as extending, ready to move into its third wave.
which has the same expected direction as the main wave count, and the main wave count has a far better look, so I’ll leave it at that.