I have a new alternate for GDX for you. It fits perfectly with Gold’s Elliott wave analysis today.
Click charts to enlarge.
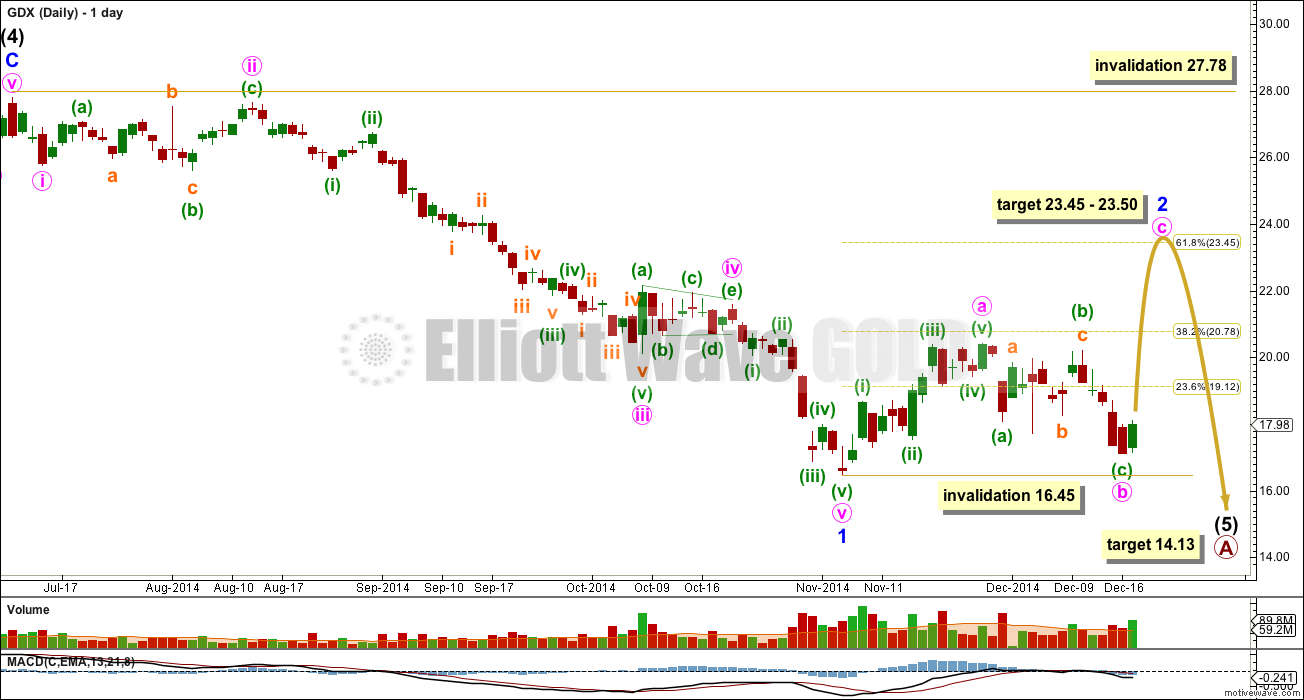
Main Wave Count
This main wave count has an even probability with the alternate below.
Both wave counts are identical to the end of minor wave 1. Thereafter, they see minor wave 2 differently.
This main wave count sees the first wave up within minor wave 2 as a five wave structure. Within minute wave a there is a truncation at the end of minuette wave (ii), or this structure could be a combination. It would be most likely that minuette wave (iv) is a triangle, so there is no truncation there.
For this main wave count minor wave 2 is a zigzag which subdivides 5-3-5.
This possible truncation at the end of minuette wave (ii) has meant that I have considered the alternate. I do not know how readily this market exhibits truncations, but from my experience with GDX so far it does seem to sometimes exhibit truncations. I have noticed so far that its waves do not seem to be as textbook perfect as Gold, and maybe this is because it does not have as high a volume as Gold.
If minute wave a subdivides as a five then minute wave b may not move beyond its start below 16.45. This means that it is very likely that minute wave b would be over now, and has almost no room for downwards movement left. At 23.50 minute wave c would reach 1.618 the length of minute wave a, and minor wave 2 would reach up to the 0.618 Fibonacci ratio of minor wave 1 at 23.45.
Minor wave 2 may not move beyond the start of minor wave 1 at 27.78.
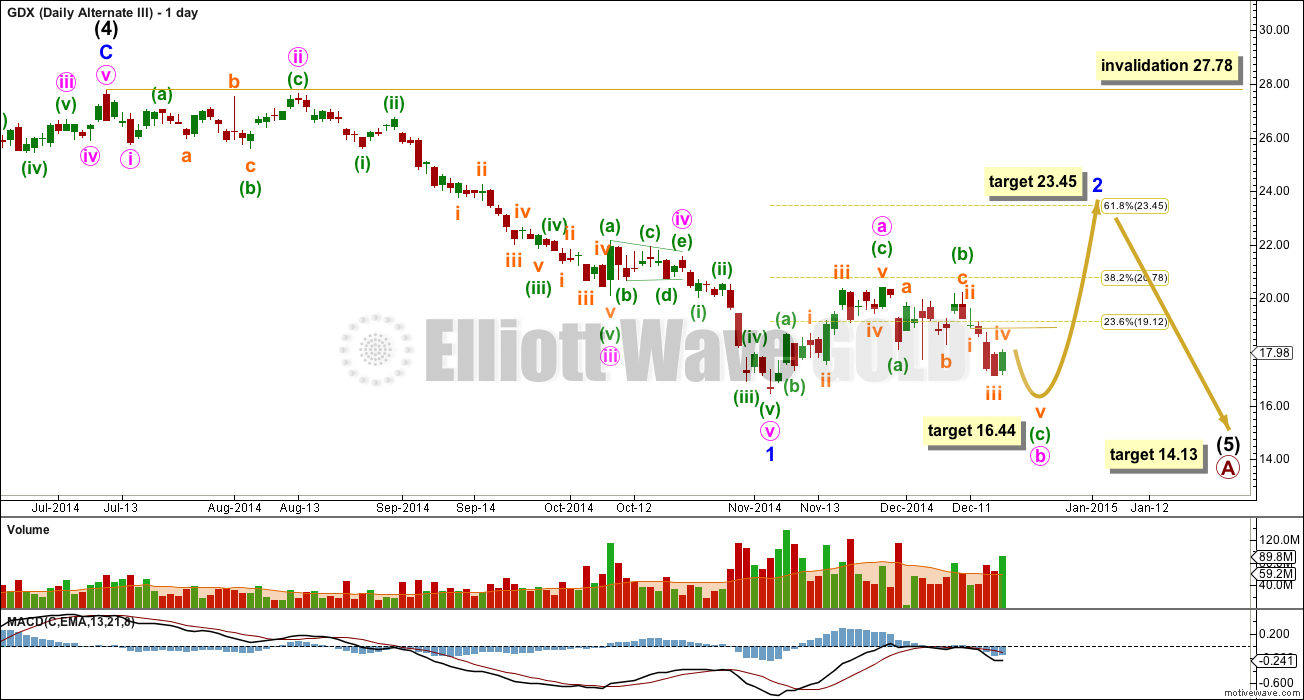
Alternate Wave Count
It is also possible to see minute wave a as a three wave structure. Now the truncation is avoided. There is no Fibonacci ratio between minuette waves (a) and (c) within minute wave a, but then so far I have noticed that GDX does not exhibit reliable Fibonacci ratios. This does make target calculation more difficult.
For this alternate wave count minor wave 2 is a flat correction which subdivides 3-3-5.
If minute wave a subdivides as a three, then minute wave b may move beyond its start. The lower invalidation point does not apply for this idea. In fact, minute wave b is very likely to move below the start of minute wave a at 16.45 as in an expanded flat correction, because those are very common structures indeed.
Within minute wave b minuette wave (c) will reach 1.618 the length of minuette wave (a) at 16.44.
Within minuette wave (c) the structure must be a five wave structure. So far it looks like subminuette waves i through to iv would be complete within an impulse. Subminuette wave iv may not move into subminuette wave i price territory above 18.86.
If we see a new high above 18.86 and we do not see a new low below 16.45, then the main wave count will be most likely and I would expect that GDX is in an upwards trend to the target about 23.45.
Alternatively, if price does not break above 18.76 in the next day or so and we see a new low then I would expect this alternate wave count is most likely. There is no downwards invalidation point for this wave count; minute wave b can move substantially below 16.45.
The overall picture is still the same though: the structure of minor wave 2 for both wave counts is incomplete and the final target is mostly the same.
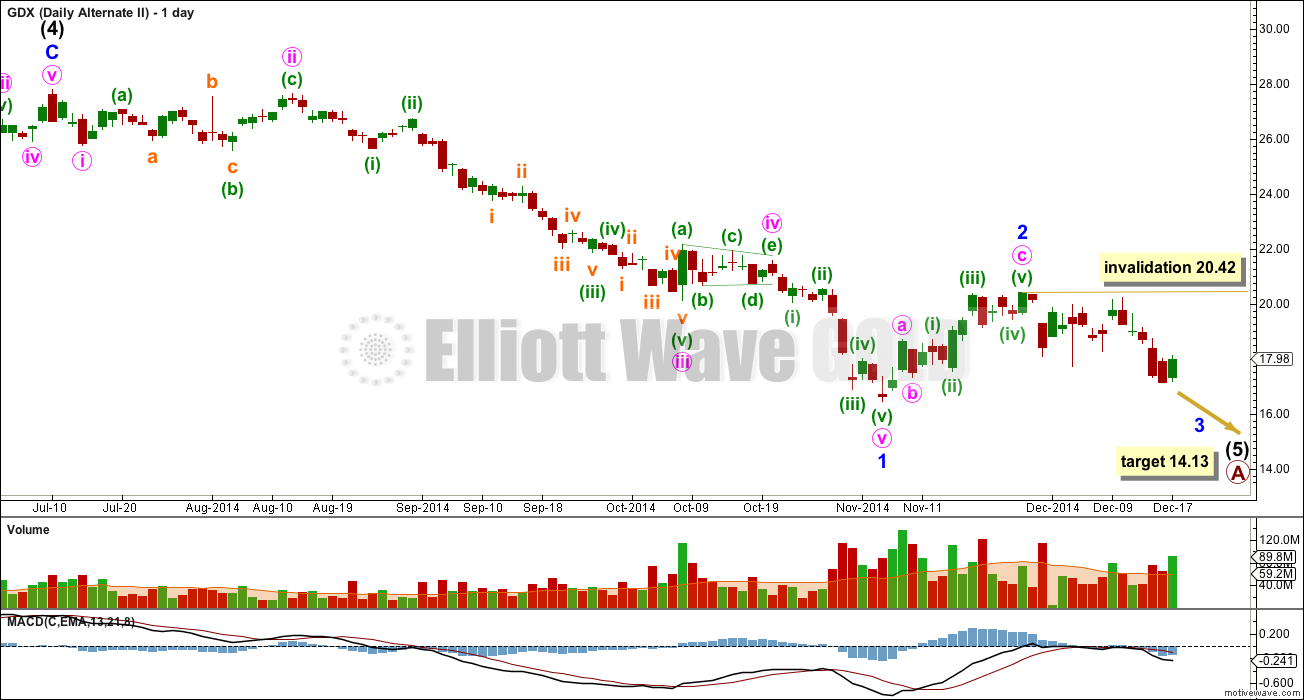
Second Alternate Wave Count
This is the other alternate wave count which remains viable for GDX and Gold, but it is invalidated for Silver. Because of that, I consider this to have a very low probability. I probably will not publish this idea again.
For Gold this idea has a horrible look, so much so I don’t want to publish the equivalent wave count for Gold.
Any movement at all at any stage above 20.42 would invalidate this wave count for GDX. I expect this wave count will be invalidated within one or two weeks.
Minor wave 2 is far too brief and shallow to be complete.


Hi Lara,
Are we now in wave i of green (iii) of 2?
thanks!
Lara forgot to add-
GDX may move beyond the price pt. to low level and generate a bearish divergence .
Form price and volume and chart analysis it appears GDX has room move down further.
In thet case would wave count still remain same?
Lara as of yesterday did wave b changed for GDX?
Wave ii still may not move beyond 16.45. That may happen today as double bottom at 16.97 ????????
The alternate wave count allows for a new low below 16.45. It is still part of a correction though.
Hi Lara
On GDX, is it just me or do you see 5 clean impulsive waves off the Tuesdays low of 17.11 with a clearly defined iii of 3?
Look to me like both GLD and GDX are now in a b of 2 consolidation prior to a launch this week.
Thoughts?
THANKS!
It’s just you. I can’t see subdivisions on any time frame below daily.
Gold managed to keep GDX MACD above water to end the weekly chart! That was close…
Jaf
Correct me if I am wrong. You are saying gdx has hit bottom, that gold will hit bottom about 1170 then both gdx and gold will move up ?
Yes, this is my opinion because I believe GDX will lead gold as it has in the past. But it’s only an idea based on whatever information we have. As Lara stated, we can only receive daily data for gdx, and the expanded flat idea has issues.
Here is the same chart only a few days ago…
looks like the 1st ALT is already invalid…
Probably depends on data source. Yahoo says close was 18.85 with after hours bid at 18.87. Hard to see gdx not following gold if gold takes a strong dip as projected.
The Yahoo finance data I’m using has the low for subminuette wave i at 18.86. The high so far is at 18.85.
Its close for sure, but not invalidated yet.
There is actually another possibility I’ve just realised, minuette wave (c) could be an ending diagonal.
I cannot see the subdivisions of these waves on a time frame below daily. So I cannot see if subminuette waves i and iii are impulses or zigzags. So I cannot know if minuette wave (c) is an impulse or an ending diagonal.
Which is really annoying, and not useful to you all I know.
I should have put the invalidation point up at the end of subminuette wave ii at 19.64 to allow for both possibilities.
Lara thanks for that update. 19.64 allows GDX room to move and still conform to gold’s path. And always helpful to have gold, silver and gdx charts to compare.
Hope in the future you may find a good data source for GDX, I bet more and more subscribers follow your GDX chart because they want to trade 3X GDX up or down NUGT and DUST.
You might know that leveraged ETF commodity funds are relatively inefficient derivatives (read expensive) and so they track far from perfectly (i.e., the rise in a 3X ETF is actually something less than 3X of the underlying asset).
If one wants leveraged exposure on a commodity, IMO one ought to instead play in leverages futures because it has much lower fees/expense and more efficiency than a fund, plus many futures trade round-the-clock with higher volumes (superior liquidity). Also tends to exhibit better technical action than a fund.
FWIW, just my .02
If you look closely, I think green C is complete. We are now in pink C/ wave 1 orange, and looking for a fib retrace for wave 2 orange. We should get it when gold retraces to complete green ii.
Jaf, would you clarify “when gold retraces to complete green ii” ? Is not green ii already complete?
Pink 2
Appologies
Green ii when I go by my expanded flat idea that I posted on the 17th. I still have that concept alive because I like how neatly the subdivisions fit ( especially if you look at the ratio between orange C and orange A…). Of course it does look a little odd on the daily chart as Lara stated. Nevertheless, I think investors are scratching their heads today… They can’t decide what to do…
Cheers.
Jaf
Lara, thanks for gdx chart.
Is dividing line 18.86 or 18.76 ?
“If we see a new high above 18.86 and we do not see a new low below 16.45, then the main wave count will be most likely”
“Alternatively, if price does not break above 18.76 in the next day or so and we see a new low then I would expect this alternate wave count is most likely”
That should be 18.86, the low for 11th December which is the end of subminuette wave i.
BUT… I’ve just realised another possibility. What if minuette wave (c) is an ending diagonal? Because I can’t see the subdivisions of these small waves at a time frame below daily I should consider both possibilities.
The invalidation / confirmation point should really be at 19.62; the end of subminuette wave ii which is the high for the day of 11th December.