Downwards movement was not expected and has invalidated the hourly Elliott wave count. The Elliott wave count is changed slightly, but the mid term picture and target remains the same.
Summary: The short term target is at 1,250. I expect to see an increase in upwards momentum towards this target. The mid term target remains the same at 1,278 and it may be met in 10 trading days.
Click on charts to enlarge
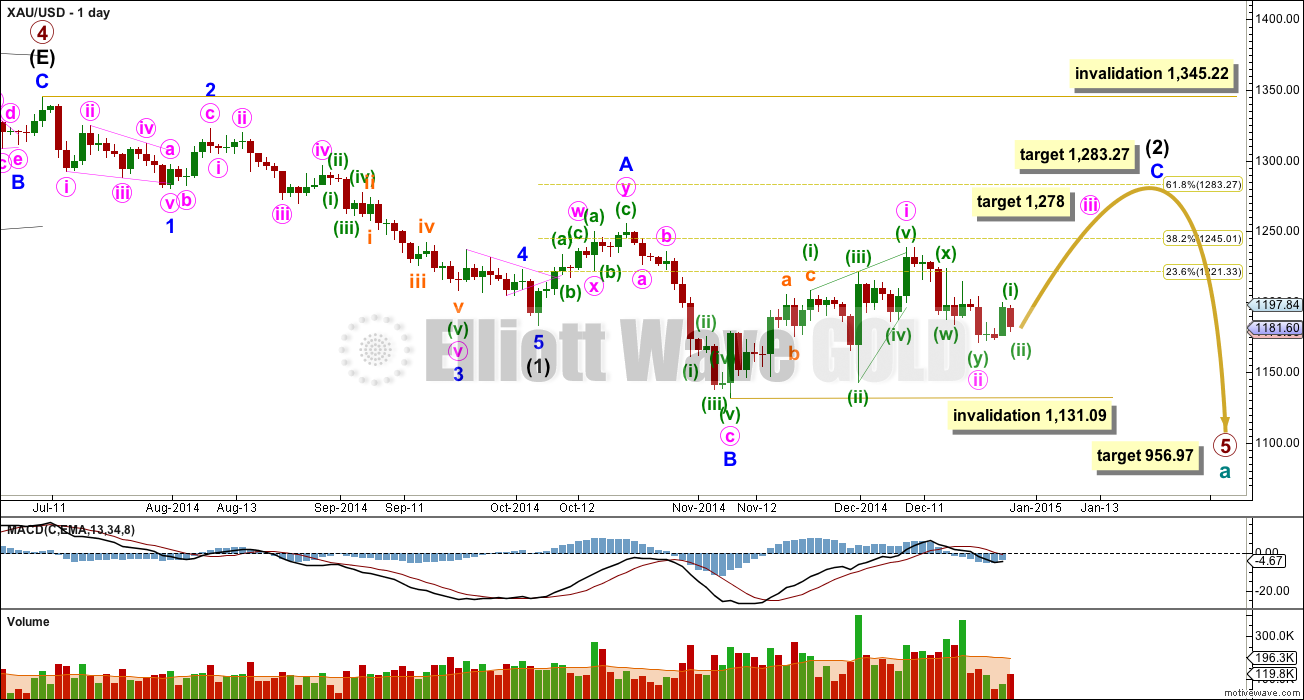
Primary wave 4 is complete and primary wave 5 is unfolding. Primary wave 5 may only subdivide as an impulse or an ending diagonal. So far it looks most likely to be an impulse.
Within primary wave 5 intermediate wave (1) fits perfectly as an impulse. There is perfect alternation within intermediate wave (1): minor wave 2 is a deep zigzag lasting a Fibonacci five days and minor wave 4 is a shallow triangle lasting a Fibonacci eight days, 1.618 the duration of minor wave 2. Minor wave 3 is 9.65 longer than 1.618 the length of minor wave 1, and minor wave 5 is just 0.51 short of 0.618 the length of minor wave 1. I am confident this movement is one complete impulse.
Intermediate wave (2) is an incomplete expanded flat correction. Within it minor wave A is a double zigzag. The downwards wave labelled minor wave B has a corrective count of seven and subdivides perfectly as a zigzag. Minor wave B is a 172% correction of minor wave A. This is longer than the maximum common length for a B wave within a flat correction at 138%, but within the allowable range of twice the length of minor wave A. Minor wave C may not exhibit a Fibonacci ratio to minor wave A, and I think the target for it to end would best be calculated at minute degree. At this stage I would expect intermediate wave (2) to end close to the 0.618 Fibonacci ratio of intermediate wave (1) at 1,283.27.
Intermediate wave (1) lasted a Fibonacci 13 weeks. If intermediate wave (2) exhibits a Fibonacci duration it may be 13 weeks to be even with intermediate wave (1). Intermediate wave (2) is beginning its twelfth week. If it continues for one more week it may have an even duration with intermediate wave (1). It may be able to do this, but at this stage it is looking like it might need a little longer.
So far within minor wave C minute wave i lasted 22 days, one longer than a Fibonacci 21. Minute wave ii lasted 9 days, one longer than a Fibonacci 8. If minute wave iii lasts 13 days it would have a Fibonacci ratio to the duration of minute waves i and ii. This may see the target at 1,278 where minute wave iii would reach equality in length with minute wave i, reached in another 10 days.
So far within minor wave C the highest volume is on three up days. This supports the idea that at this stage the trend remains up.
See the most recent Historic Analysis to see the long term channel about this whole downwards movement. The channel does not copy over to the daily chart when I put the daily chart on an arithmetic scale, so this channel must be drawn on a weekly chart on a semi log scale. The upper edge of that channel may be where intermediate wave (2) finally ends. I would not expect the upper edge of this channel to be breached.
The target for primary wave 5 at this stage remains the same. At 956.97 it would reach equality in length with primary wave 1. At this stage because primary wave 5 is taking its time it may not be a typical short brief fifth wave following a triangle, and so I have a little more confidence in this target.
Within minor wave C minute wave i subdivides perfectly as a leading contracting diagonal. When leading diagonals unfold in first wave positions they are normally followed by very deep second wave corrections. There is a nice example here on the daily chart: at the top left of the chart minor wave 1 was a leading contracting diagonal and it was followed by a deep 65% zigzag for minor wave 2. Minute wave ii is now deep, just below the 0.618 Fibonacci ratio of minute wave i. Minute wave iii has most likely now begun.
I do not think that minor wave C is complete at the high of 1,238 as an ending contracting diagonal for three reasons:
1. Intermediate wave (2) would be a very rare running flat correction.
2. Minor wave C would be substantially truncated, by $17.
3. This structure does not subdivide well as an ending diagonal because the third and fifth waves do not fit well as zigzags. Within an ending diagonal all the sub waves must be zigzags.
Minute wave ii may not move beyond the start of minute wave i below 1,131.09. *edit: this was incorrectly noted as 1,138.09
Intermediate wave (2) may not move beyond the start of intermediate wave (1) above 1,345.22. I have confidence this price point will not be passed because the structure of primary wave 5 is incomplete because downwards movement from the end of the triangle of primary wave 4 does not fit well as either a complete impulse nor an ending diagonal.
To see a prior example of an expanded flat correction for Gold on the daily chart, and an explanation of this structure, go here.
I do not want to publish a wave count which sees primary wave 5 complete at the low of 1,131.09. This downwards movement does not fit well at all as a complete five wave impulse. There would be inadequate alternation between the single zigzag of the second wave and the double zigzag of the fourth wave correction, and there would be no Fibonacci ratios between the first, third and fifth waves within it.
Main Hourly Wave Count
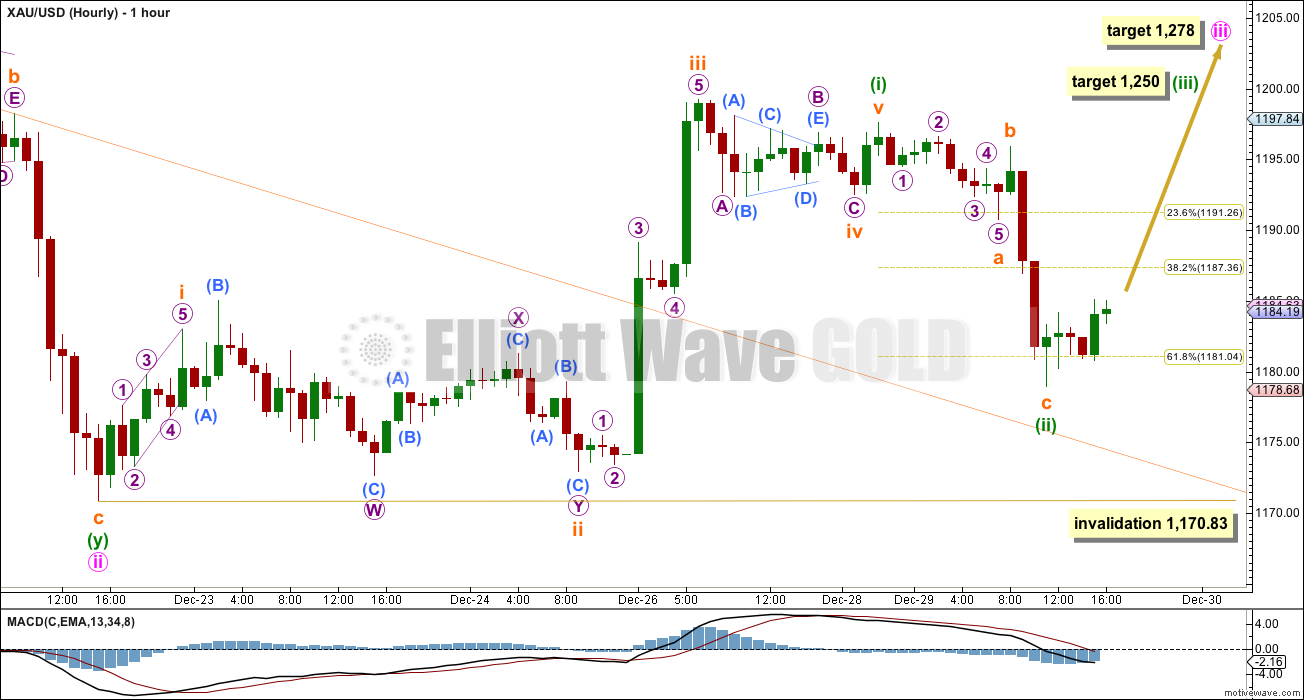
Downwards movement which invalidated the last hourly wave count cannot be a fourth wave correction and must be a deep second wave correction. Third waves usually show their subdivisions nice and clearly on the daily chart, so I would expect minute wave (ii) to show up on the daily chart as at least one red candlestick or doji.
If minuette wave (i) is over sooner than expected then it must have ended with a truncated fifth wave. Because of this truncation I am considering the alternate below.
Within minuette wave (i) there is good alternation between subminuette waves ii and iv: subminuette wave ii is a deep double combination, and subminuette wave iv is a shallow zigzag.
Ratios within minuette wave (i) are: there is no Fibonacci ratio between subminuette waves i and iii, and subminuette wave v is 0.38 longer than 0.382 the length of subminuette wave i.
Minuette wave (ii) would be very likely to be over here. Alternatively, it could continue slightly lower (I can see another way to label its subdivisions, and one final fifth wave down may be required). If it does continue slightly lower it may not move beyond the start of minuette wave (i) at 1,170.83.
At 1,250 minuette wave (iii) would reach 2.618 the length of minuette wave (i). Because minuette wave (ii) is very deep this indicates that minuette wave (iv) to come should be very shallow.
If this wave count is invalidated with downwards movement below 1,170.83 then it could only be minute wave ii continuing lower. At this stage, if I have the structure within minute wave ii labelled correctly as a double zigzag, then the only way it could continue would be as a very rare triple zigzag. The rarity of triples means this idea has an extremely low probability, and so I am not charting it for you. I will only consider it if it shows itself to be true.
Alternate Hourly Wave Count
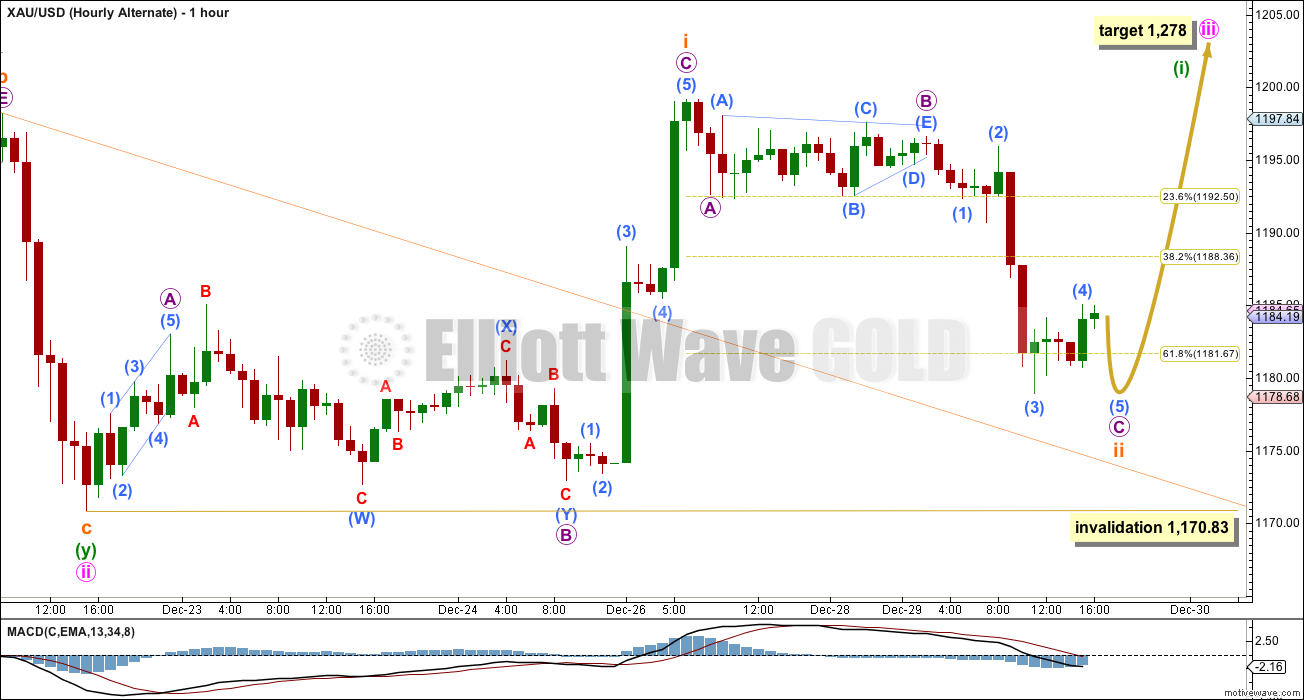
The first upwards movement looks more like a three than a five, if there is no truncated fifth wave. This alternate considers the possibility that minuette wave (i) is incomplete and is unfolding as another diagonal.
The invalidation point is the same. Subminuette wave ii may not move beyond the start of subminuette wave i below 1,170.83.
Although this alternate avoids the truncation seen in the main hourly wave count, it still has a lower probability. Leading diagonals are not rare, but they are not as common as impulses for first waves. This alternate also would see minuette wave (i) to be very time consuming. It would be an unusual start to the middle of a third wave.
The mid term target is also the same. If the next wave up looks like a clear three and most importantly does not exhibit a strong increase in momentum, then this alternate may be correct.
This analysis is published about 5:17 p.m. EST.


Lara, everything you do is terrific. Every daily update impresses me with your diverse communication skills and Top Notch Elliott Wave knowledge. For me you are the most important key that makes my trading Gold possible. Thanks a MIllion$
You’re welcome 🙂
I hope I can continue to get it right more often than wrong, and you can continue to profit.
Hi lara, can you address my comment from last evening? I think it’s extremely important to the target.
Done.
Boy that rise from $1180-$1210 looks like a 3. That is concerning and it still doesn’t seem to acting like a third wave.
I agree. Looking for Lara to clarify if it is a zigzag wave iii and we drop way down or it isn’t and maybe 1200 area holds as support.
Thats how I see it for the alternate. It does look like a zigzag, doesn’t it!
That was my concern too. I have a really good looking alternate for you today which explains it.
I’m still confident we will see price move at least above 1,255.40 before intermediate wave (2) is over.
I bought GDX in after hours last night when got Lara’s report and already sold at a profit. I expect gold is going with Alternate hourly wave count as after close gold finished at 1180.85 @7:30 pm wave (5) down to complete C circle, subminuette wave ii. Then subminuette wave iii just completed up in a zigzag at 1210.78 @ 9:56 am today. Now subminuette wave iv down has began possibly with an invalidation of 1170.83?
Interested in other interpretations of gold action and Lara’s count?
I thought Lara wrote{ once price is above 1200 invalidation can move higher 1197.
May be this was in Friday’s report.
Summary above states 1278 in 19 days????
Lara mentioned in video last night that if we got the main hourly count then invalidation point would move up around 1,200, however she mentioned that with alternate gold would finish subminuette wave iii up then subminuette wave iv would move back down into wave 1 territory and was pointing around invalidation of 1170.83.
Lara above has this, “This may see the target at 1,278 where minute wave iii would reach equality in length with minute wave i, reached in another 10 days.”
Did you read her last line: most importantly does not exhibit a strong increase in momentum, then this alternate may be correct.
Today gold has increased momentum.
Why you are considering Alt wave?
Gold closed at 1183 Monday and main hourly had gold going up and alternate had gold going down first then up. Gold went down first from close to 1180.85 @ 7:30 pm, which I believe was Lara said alternate had to finish wave (5) down first to complete C cicle, wave ii. “Minuette wave (ii) would be very likely to be over here. Alternatively, it could continue slightly lower (I can see another way to label its subdivisions, and one final fifth wave down may be required).” Then gold moved slowly and 12 hours later hit 1182.62 at 7:40 am. So was 2 dollars up in 12 hours an increase in momentum, NO. Then Gold woke up and moved up.
I’m using the drop to finish wave (5) down as why we are now in Alternate, and overriding that gold woke up 12 hours later. Also alternate had a 3 count zigzag next and I believe we got that today. Unless I got today’s count wrong?
I watched video again and the main hourly was supposed to start SWIFT and strong and it took until 7:40 am for SWIFT to begin. That speed sounds more like alternate hourly.
Richard
I always look forward to reading your comments.
I am wondering, what brokerage service do you use as you are buying GDX after hours?
Thanks
I am in Canada and use TD Waterhouse who offers after hour trades up to 7:00 pm EST. However there is an extra brokerage fee as a live broker is required. Some who have deluxe account might be able to do trade them self. I find they don’t know much quote details after hours, however I can use google or yahoo finance for after hour price.
Thanks
davey
You are kind. Thanks a lot.
I suggest you get Think or Swim (TOS) platform and the TTM indicators by John Carter on it. TD Ameritrade and TD Waterhouse and a few others have it and combine that with Elliott Wave.
Good job.
Fantastic! Can anyone confirm, is the expectation (or the main probability) that wave (iii) (aiming for a possible 1250) completes today? Thanks
I would expect zero chance wave (iii) completes at 1,250 today. There is a possibility by the weekend. Lara may clarify tonight.
Thanks
WOW!!! Is it true or what. Gold increased momentum in few minutes ago and breached 1200.
Finally the EW showing its hand.
Great LARA!!!
It might be a typo and 1138.09 should be 1131.09.
yes, sorry, fixed now.
Lara, I think this is no longer valid?
“Minute wave ii may not move beyond the start of minute wave i below 1,138.09.”
Lara – Is confirmation 1204 for both main and alt wave counts same?
Great job!!
Minuette wave (i) has already happened for the main wave count but not for the alternate and 1,204 may still be target as noted on alternate chart.
I didn’t give a confirmation point on todays analysis?
If I remove it from one day to the next, there will be a good reason. It no longer applies.