
GDX continues higher as expected.
Click charts to enlarge.
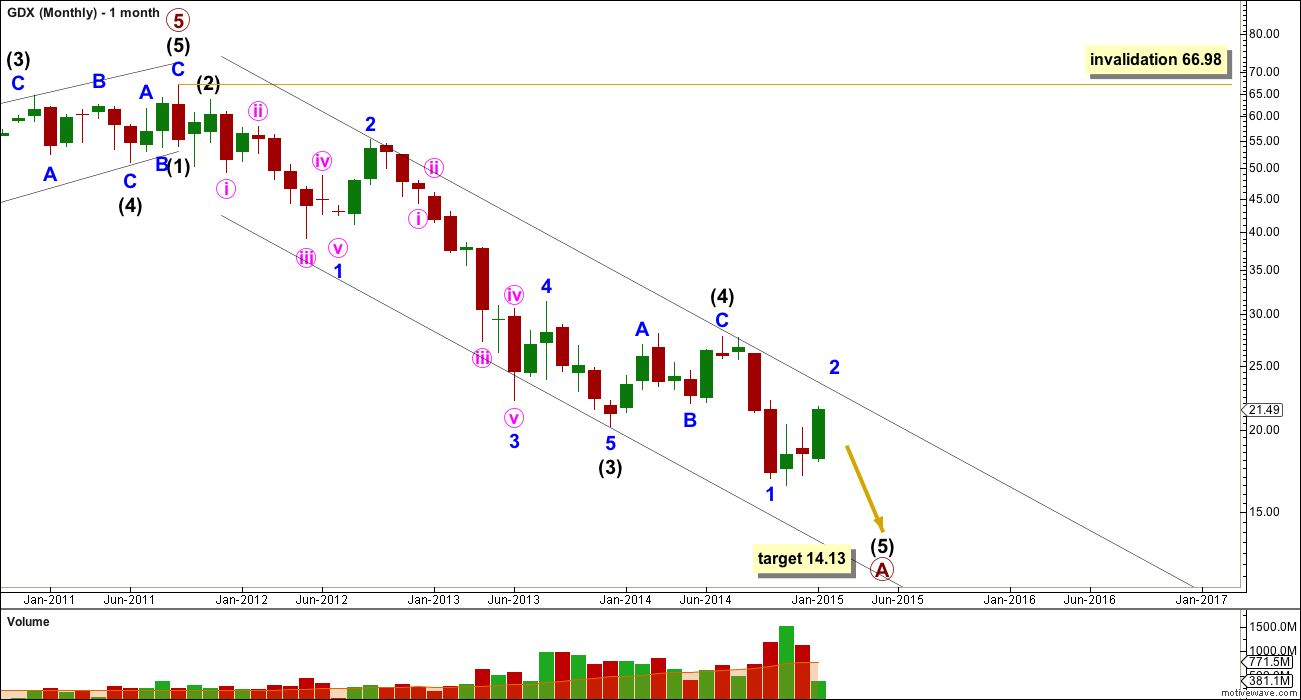
I see an incomplete five wave structure downwards. The final fifth wave for intermediate wave (5) is unfolding. At 14.13 intermediate wave (5) would reach equality in length with intermediate wave (1).
I have changed this monthly chart to a semi log scale to try and get the channel right, and have redrawn it today. This channel is a best fit and may show where minor wave 2 upwards finds resistance. This indicates that the target for minor wave 2 to end may be too high.
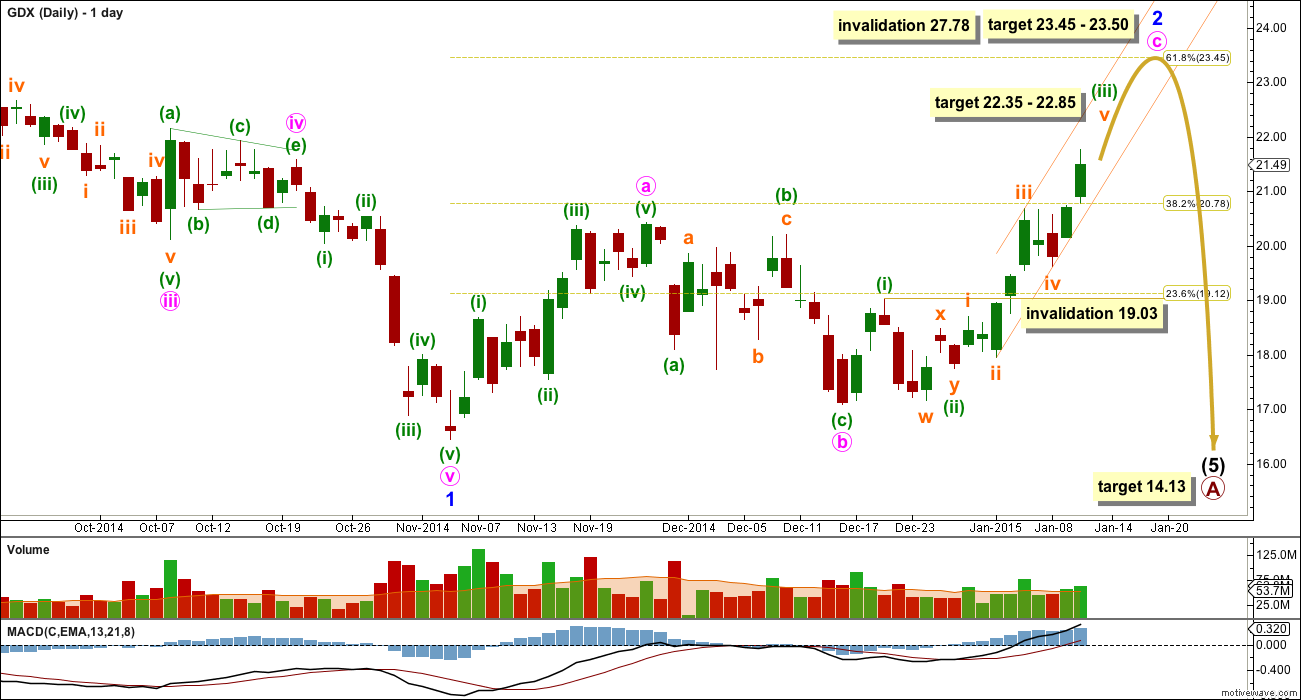
I do not think minuette wave (iii) is over yet. I am labelling minuette wave (ii) as a sideways combination. I have noticed so far that GDX tends to exhibit truncations quite frequently; although this is not technically a truncation (that refers to fifth and C waves only, this is a Y wave) the behaviour is like a truncation, and this would be typical of GDX. It fits in terms of proportion.
Only when the narrow orange channel about minuette wave (iii) is breached to the downside would I expect that minuette wave (iii) is over and minuette wave (iv) has begun. While price remains within this channel we should expect that the trend remains upwards.
At 22.35 subminuette wave v would reach equality in length with subminuette wave i. At 22.85 minuette wave (iii) would reach 2.618 the length of minuette wave (i).
When the small orange channel about minuette wave (iii) is breached then redraw the channel using Elliott’s technique about minute wave c: draw the first trend line from the highs labelled minuette waves (i) to (iii), then place a parallel copy on the low labelled minuette wave (ii). Expect minuette wave (iv) to be very likely to find support about the lower end of that channel, and the following final fifth wave up to end about the upper edge of that channel.
Minuette wave (iv) may not move back down into minuette wave (i) price territory below 19.03. Minuette wave (iv) is most likely to be a shallow correction and it should show on the daily chart. It may last a Fibonacci 3 or 5 days.
At 23.50 minute wave c would reach 1.618 the length of minute wave a, and minor wave 2 would reach up to the 0.618 Fibonacci ratio of minor wave 1 at 23.45.
Minor wave 2 may not move beyond the start of minor wave 1 at 27.78.
Lara, first thanks for GDX charts, especially hard to do given you are traveling on vacation.
Question: Would you clarify GDX wave (2) targets?
Under monthly chart you say: “the target for minor wave 2 to end may be too high” and visually it appears GDX at current price is pushing against or moving up outside it’s channel. So based on monthly chart and narrative I would expect GDX is topped out.
But….daily chart and narrative text support GDX targets at 22 and 23.
GDX chart from thewavetrading.