
Last Elliott wave analysis stated the situation was unclear. It is still unclear, but we have more information today to assist a decision either way.
Summary: Downwards movement with strong momentum favours the two alternates. Price is finding support at the upper edge of the maroon channel on the daily and weekly charts. If this trend line is breached and momentum builds downwards I will strongly favour the alternates. If price finds support here to make one more high I will favour the main wave count.
Click on charts to enlarge.
Main Daily Wave Count
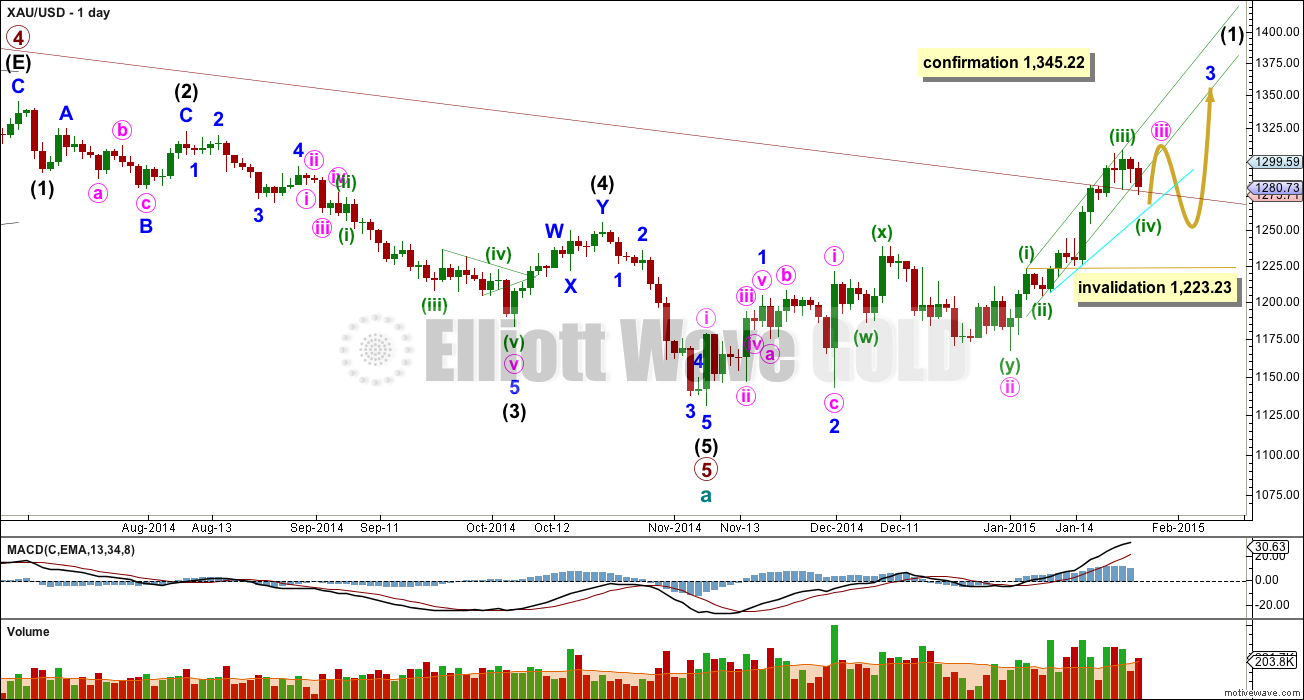
This wave count now has a close to even probability with the two alternates. Depending on what happens over the next few days I may swap them over again. The situation is unclear. Normally I have only one wave count, with occasional less likely alternates. Sometimes I have to present alternates to you with an even probability and wait for the market to tell us which is correct, and this is one of those times. Use your own technical analysis and judgement to determine which you see as more likely.
This wave count sees a five wave impulse down for cycle wave a complete, and primary wave 5 within it a completed five wave impulse. The new upwards trend at cycle degree should last one to several years and must begin on the daily chart with a clear five up. The first five up is most likely to be an impulse which is what this wave count looks at.
My biggest problem with this wave count, and the reason I will retain the second alternate, is the structure of intermediate wave (2) within primary wave 5. This is a rare running flat but the subdivisions don’t fit well. Minor wave C should be a five wave structure, but it looks like a clear three on the daily chart. If you’re going to label a running flat then its vital the subdivisions fit perfectly and this one does not. I still have a big concern with this wave count for this reason.
Intermediate wave (5) still looks like a zigzag rather than an impulse, and has a corrective wave count. This is also a problem I have with this wave count.
This wave count fits with momentum at the daily chart level. The middle of a third wave may have recently passed, and now a series of two more fourth wave corrections and fifth waves up may be required to complete minor wave 3.
For this wave count minuette waves (i), (ii) and (iii) are seen with exactly the same subdivisions as minute waves a, b and c for the first alternate (and one degree lower for the second alternate) because they both subdivide 5-3-5. If we have one more high then this upwards movement from the last low at 1,167 for minute wave ii will be a complete impulse. If we do not have one more high then the upwards movement from minute wave ii would be a correction, not an impulse. This is the core of the lack of clarity: is this movement finished yet or not?
The green channel about minute wave iii is drawn using Elliott’s technique: draw the first trend line from the highs labelled minuette waves (i) to (iii), then place a parallel copy on the low labelled minuette wave (ii). Minuette wave (iv) has now breached this channel. Sometimes fourth waves are not contained within these channels, and that is why Elliott developed a second technique to use when they are not. Minuette wave (iv) may find support about the aqua blue trend line drawn as shown on this daily chart.
Minuette wave (iv) may not move into minuette wave (i) price territory below 1,223.23.
So far to the downside minuette wave (iv) may be completing a shallow 33% double zigzag, which would provide some alternation with the single deep zigzag of minuette wave (ii). There should be alternation in depth and / or structure.
Minuette wave (ii) lasted 43 hours. So far minuette wave (iv) has lasted 50 hours so they are still in proportion. Minuette wave (ii) lasted 2 days on the daily chart, and minuette wave (iv) could be longer and still be close enough for the wave count to have the right look on the daily chart.
The next area for support may be the aqua blue trend line copied over from the daily chart.
Minuette wave (iv) may not move into minuette wave (i) price territory below 1,223.23.
Alternate Daily Wave Count
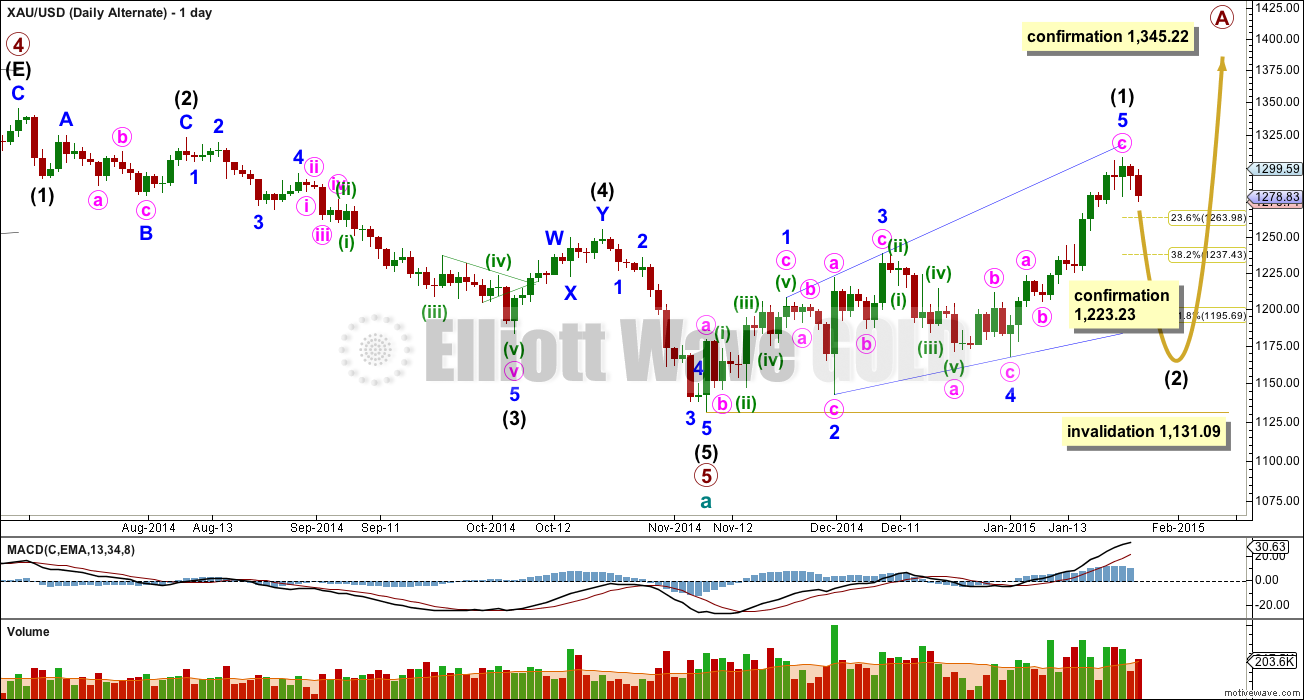
It is entirely possible that there was a leading expanding diagonal as the first five up within primary wave A. For diagonals, the contracting variety is more common than expanding and ending diagonals are more common than leading. While a leading expanding diagonal is not rare, it is not very common either. This reduces the probability of this wave count to less than the probability of the main wave count above.
Within leading diagonals the second and fourth waves must subdivide as zigzags. The first, third and fifth waves are most commonly zigzags but they may also be impulses. This wave count sees minor waves 1, 3 and 5 as zigzags.
Because minor wave 5 is a zigzag it would be over here. A-B-C and 1-2-3 (how the main wave count sees this movement) have exactly the same subdivisions. Because I am reasonably confident I have this movement for minute wave c labelled correctly on the hourly chart as a complete five wave impulse this is where the main wave count now diverges from this alternate and the second alternate below. If this upwards wave is a zigzag it must end here. If it is an impulse it needs a final fifth wave up.
Leading diagonals are almost always followed by very deep second wave corrections, often deeper than the 0.618 Fibonacci ratio. This wave count expects a big deep correction downwards, and should subdivide as a clear three on the daily chart (the second alternate below expects a clear five down).
Intermediate wave (2) may not move beyond the start of intermediate wave (1) below 1,131.09.
Second Alternate Daily Wave Count
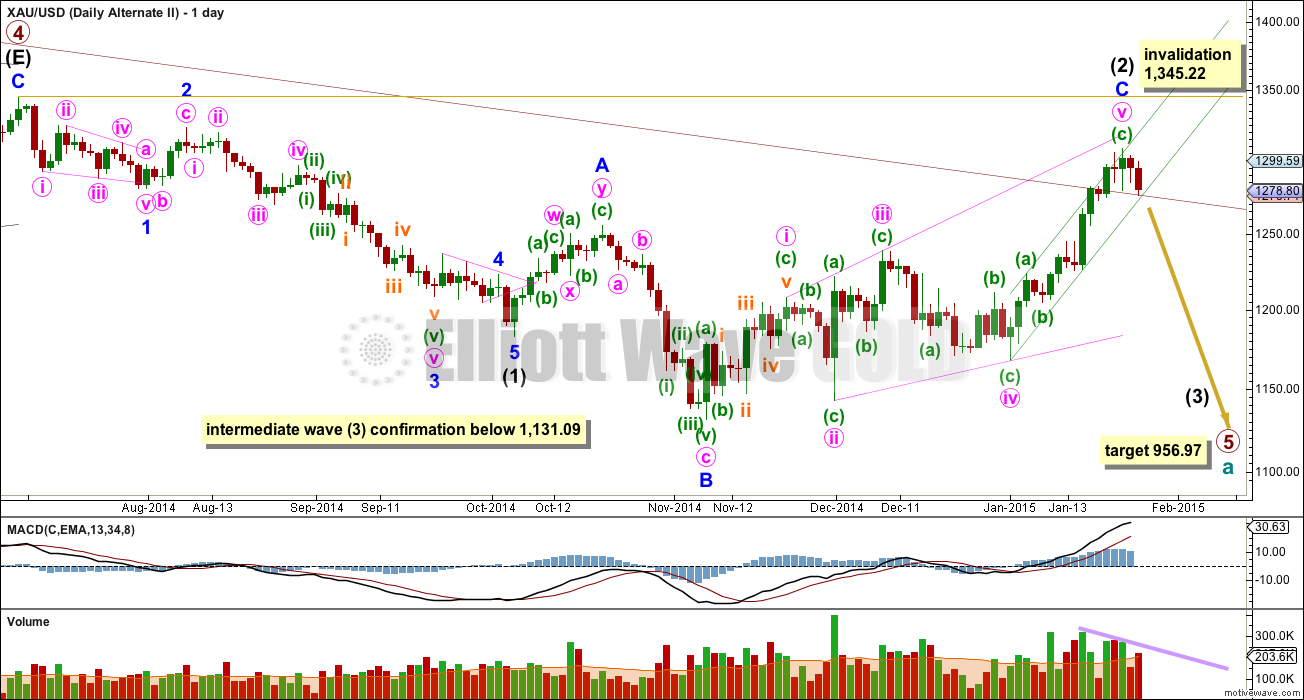
The maroon channel about cycle wave a from the weekly chart is now breached by three daily candlesticks, and is now also breached on the weekly chart by one weekly candlestick. If cycle wave a is incomplete this channel should not be breached. For this reason this wave count, despite having the best fit in terms of subdivisions, must now be relegated to a less likely alternate. It now has to prove itself if it is to be considered with any weight again.
Draw the maroon trend line on a weekly chart on a semi-log scale, and copy it over to a daily chart also on a semi-log scale (see this analysis for a weekly chart).
Within primary wave 5 intermediate wave (1) fits perfectly as an impulse. There is perfect alternation within intermediate wave (1): minor wave 2 is a deep zigzag lasting a Fibonacci five days and minor wave 4 is a shallow triangle lasting a Fibonacci eight days, 1.618 the duration of minor wave 2. Minor wave 3 is 9.65 longer than 1.618 the length of minor wave 1, and minor wave 5 is just 0.51 short of 0.618 the length of minor wave 1.
Intermediate wave (2) may not move beyond the start of intermediate wave (1) above 1,345.22. If this invalidation point is passed this wave count would be invalidated.
Intermediate wave (2) is now a complete expanded flat correction. Minor wave C is longer than 1.618 the length of minor wave A, and there is no Fibonacci ratio between them. Minor wave C is now a complete expanding ending diagonal.
Within an ending diagonal all the sub waves must subdivide as zigzags. The fourth wave should overlap first wave price territory. The rule for the end of a fourth wave of a diagonal is it may not move beyond the end of the second wave.
A-B-C and 1-2-3 subdivide exactly the same. For this idea the final zigzag of the ending diagonal must now be complete. If a new high is seen then minute wave v will not be a zigzag and I may discard both the alternate wave counts. But if we see a larger correction develop from here this wave count will remain valid. I will continue to publish it because the implications are important; a third wave down at intermediate degree may be beginning.
Although Gold almost always adheres perfectly to trend channels, almost always is not the same as always. This wave count is still possible. If we see a clear five down begin from here and momentum builds, we may be seeing the beginning of a third wave down.
A new low below 1,131.09 would confirm that a third wave down is underway.
At 956.97 primary wave 5 would reach equality in length with primary wave 1.
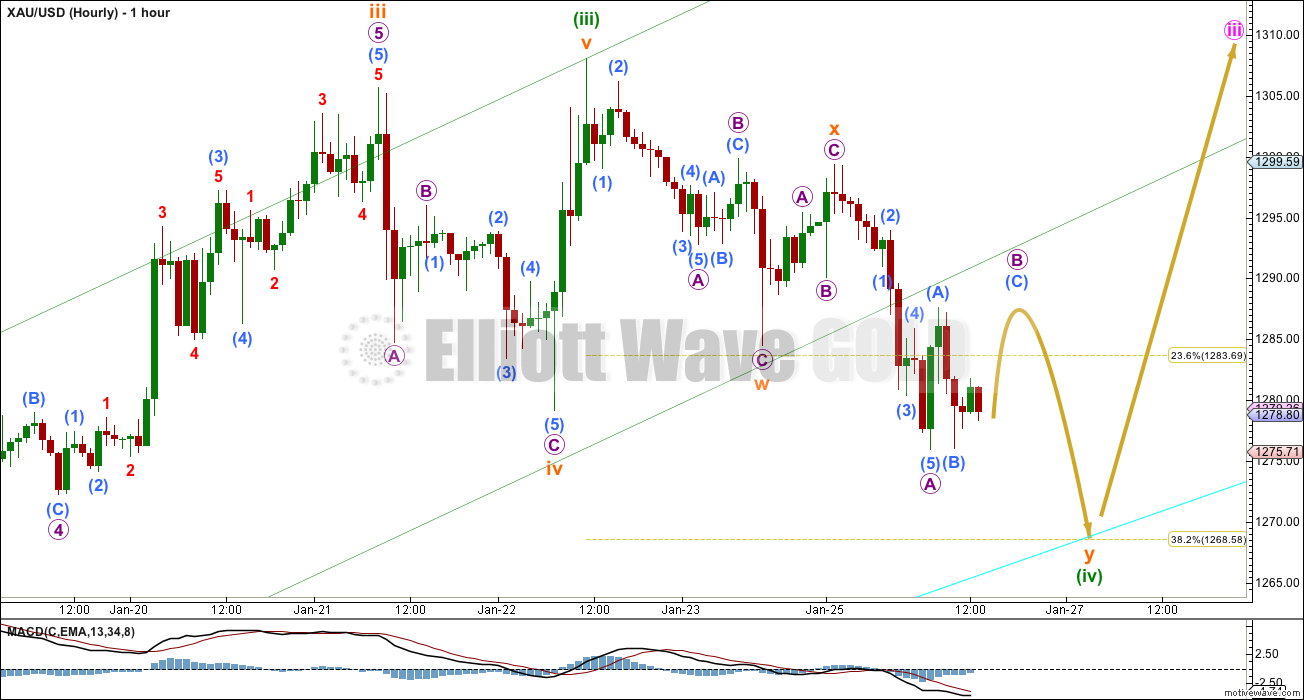
It is important to see if the subdivisions and momentum at the hourly chart level favour the main wave count or the alternates. So far, if downwards movement is the beginning of a new intermediate degree trend (whether it be a second wave correction or a third wave down), we should see a very clear five develop on the hourly chart.
So far there may be a series of three overlapping first and second waves. This wave count would now expect a further increase in downwards momentum. If this happens along with a clear impulse down on the hourly chart I will discard the main wave count.
Momentum is increasing strongly downwards, and is now more strongly downwards than at any point within the prior upwards wave. This indicates a trend change greater than minuette degree, and favours the two alternate wave counts.
At this stage downwards movement is finding some support about the lower edge of this green best fit channel copied over from the daily chart, and also at the maroon trend line on the daily chart. If price breaks through this support we may see a build of downwards momentum. The next 24 to 48 hours should provide a strong indication of which wave count is correct.
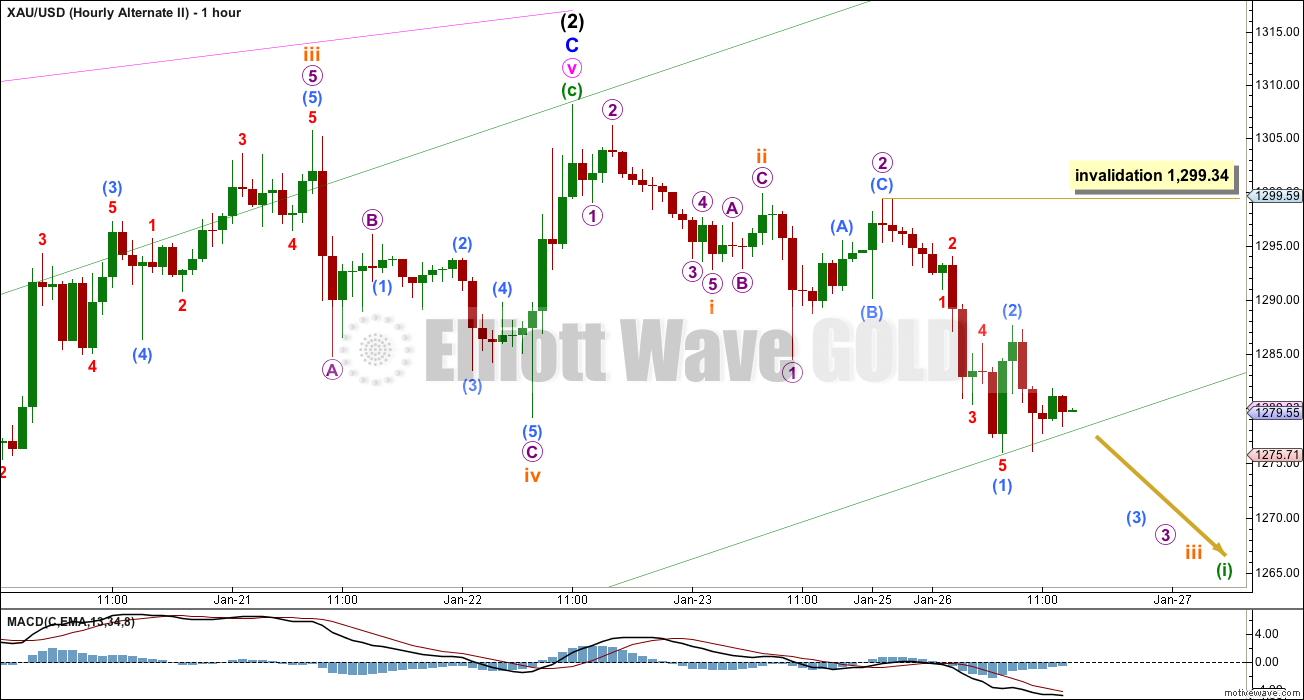
Within micro wave 3 submicro wave (2) may not move beyond the start of submicro wave (1) above 1,299.34.
This analysis is published about 03:07 p.m. EST.
Lara, could the first wave of intermediate 3 be an expanding diagonal? Thanks.
I’m looking at that possibility…. or a complete leading contracting diagonal. That fits, but it doesn’t look right. Working on it now…
It’s gold options expiration today also, so added volatility is expected.
Need to see if Gold price can break above 1299.20 high for possible 1305-07…. A break above 1307-08 will likely negate the downside risk 1172. Lets see.
Daily alternate II would be invalidated above 1,299.34.
Then left with main and Daily alternate count.
I’m not seeing any of your other numbers as noted on the charts as target, etc.?
I see the 1,307.71 as January 22nd high and if breached than, “If price finds support here to make one more high I will favour the main wave count.”
That means gold has bottomed and a multi year bull has started.
Hi Richard: The daily wave target from 1272 low is 1316 subject to break above 1299xx high, the previous 1307-08 high, a down trending resistance at around 1313…. We just have to be patient to see where gold price goes from CMP having dropped to 1291 from 1298xx high.
Is the chart we are using the bottom one, Hourly alternate II ?
Will the wave up today end at 1295 or 1307 area?
Then we move down in a third wave?
Lara wrote one more day and waves will be clearer.
Waiting for today’s report.
Lara bottom of her analysis said, “The next 24 to 48 hours should provide a strong indication of which wave count is correct.”
Yeah… except this downwards movement is really confusing. I can’t see it as a completed five, but it doesn’t fit nicely as a completed three either….
Working on it, but I’m not much more enlightened today than I was yesterday. I think we need a break above 1,308.10 now before I would be confident saying that the main wave count is correct and Gold is in a new multi-year bull market.
That’s a big call to make, and that price point isn’t too far away now.
I’m thinking we saw a 5 wave movement down on the hourly chart, which ended at 1273. That completed a first wave and now gold is in a second wave up to end in the range of 1294-5 (0.618 retracement).
Not possible since 4th wave moved into 1st wave price territory.
Closed out my JNUG position afterhours for a $3/sh gain, bought back some of the $9.30 JDST I sold this morning for $8.25 this afternoon. I am about 2/3’s positioned right now. Thanks to Lara and some TA, I gave it a try…I had a buy order in for JNUG at $31.95 this morning that missed by $0.02.
I am thrilled! Monday’s bearish key reversal saw gold price a tad lower than anticipated 1277/76…. With a low range close, further downside continuation and drop to 1272 already seen today and has quite eloquently done enough damage to open up downside risk 1172~!…. Upside risk for now remains limited to 1281-85 (pivot), 1291-95 (5dma) with 1306-08 on the outside…. Upside move is expecting today (gold price remains bullish). THANKS TO LARA’s GREAT ANALYSIS, REALLY RE-INFORCES MY VIEWS!
Thanks for the second alt hour chart. Just like when Lara looks at any chart waves are recognized by expert eyes. When I look at the chart I try to recognize emerging chart patterns.
THE hour chart has already developed big Head and shoulder and a small HnS right at the end of neckline. .If the neckline breaks gold is heading down tonight.
Read comments on the chart. Patterns do not lie so do waves.
I do not get intraday chart for gold from my chart service.So I used Lara’s chart and added the comments.
This was created right after I watched Lara’s video.
I see similarity with gold movement so far tonight fitting the main and both alternate wave counts. Gold has already broke the neck line of the chart and hasn’t collapsed yet.
In the chart above small HnS is still in the making. Right shoulder had not made yet. Right shoulder is about around 1284 1285 equal to the left shoulder. Need to wait and then gold must make to the neckline.
Good show but IMO it’s not a valid pattern. The head doesn’t look to be in proper proportion to the shoulders. Also the HnS isn’t as reliable if neckline doesn’t slope up.
More COT charts incl COTDIFF from the fxcm research arm
(but of course all COT charts are now based on 6-day old data; so don’t use COT for short-term)
http://www.dailyfx.com/forex/technical/article/cot/2015/01/26/Gold-Traders-Are-All-in-Again.html
btw, he is an Elliottician and his main most closely matches Lara’s main
http://bit.ly/1zPO480
COT – Technical Chart as of Mon, Jan 26th, 2015
COT – Technical Chart as of Mon, Jan 26th, 2015
http://bit.ly/1zQsNLD
Decoding the Gold COTs: Myth vs Reality By: Dan Norcini | Mon, Jan 26, 2015
http://www.safehaven.com/article/36493/decoding-the-gold-cots-myth-vs-reality
I think it’s a good, accurate article. It’s contrary to the common interpretation, but accurate from what I’ve seen.
JR
Thanks.
Lara, gold on the daily, would you call the action from 10am on the makings of a bear flag?
Nope. I’m not seeing it. I’ve checked in Nison’s book and I’m not seeing a bearish candlestick pattern.
It actually looks so far more like a simple flag pattern, which is a bullish continuation pattern.
Anyone else have a different view on this?
Thanks for the 1HR chart on the 2nd Alt Lara
The channel held up well into the close and could act as a nice support as we launch into v.