The consolidation continues, but I had expected a short term drop within it.
Summary: This correction is incomplete. I expect it to continue with sideways movement for another two days. In the short term I still expect a downwards day for a B wave within this fourth wave correction.
Click on charts to enlarge.
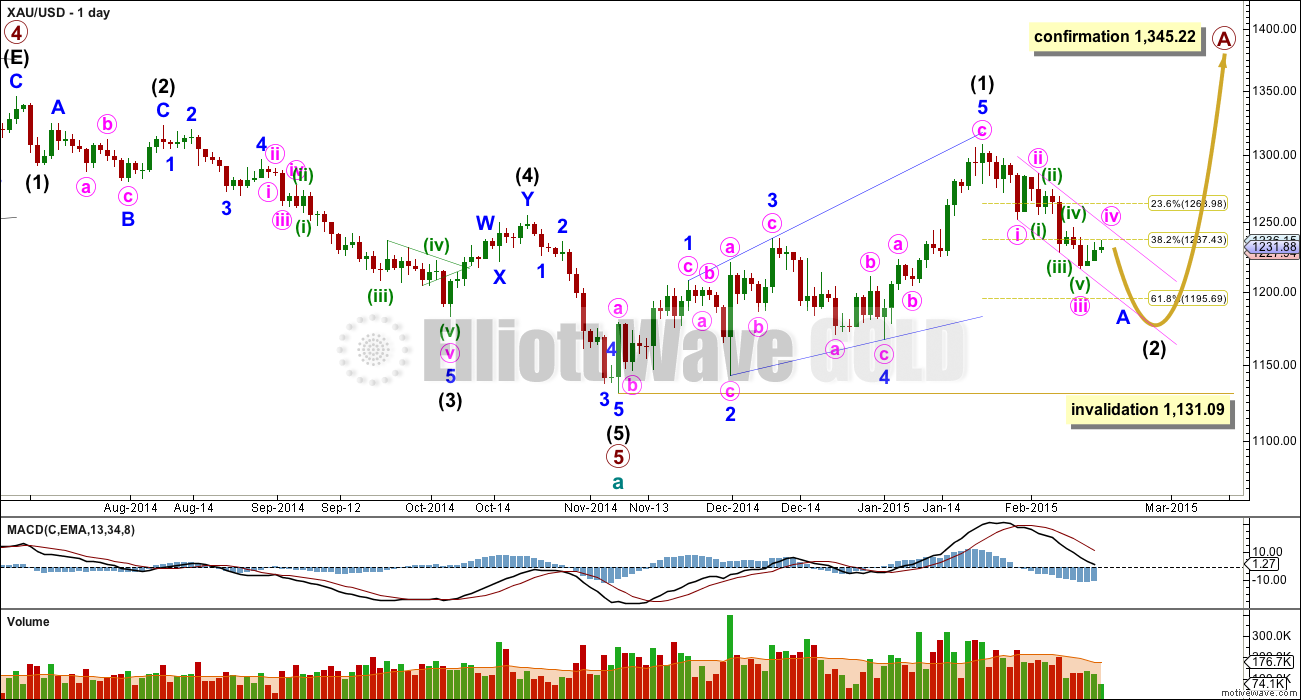
Main Daily Wave Count
At this stage I judge this main wave count to have an even probability with the alternate below. I will let the structure of downwards movement, and momentum, tell us which wave count is correct over the next few weeks. At this stage they both expect more downwards movement so there is no divergence in the expected direction.
This wave count sees a five wave impulse down for cycle wave a complete, and primary wave 5 within it a completed five wave impulse. The new upwards trend at cycle degree should last one to several years and must begin on the daily chart with a clear five up.
The first five up may be a complete leading expanding diagonal. Within leading diagonals the second and fourth waves must subdivide as zigzags. The first, third and fifth waves are most commonly zigzags but they may also be impulses. This wave count sees minor waves 1, 3 and 5 as zigzags.
Leading diagonals are almost always followed by deep second wave corrections, sometimes deeper than the 0.618 Fibonacci ratio. This wave count expects a big deep correction downwards, and it should subdivide as a clear three on the daily chart (the alternate below expects a five down).
My biggest problem with this wave count, and the reason I will retain the alternate, is the structure of intermediate wave (2) within primary wave 5. This is a rare running flat but the subdivisions don’t fit well. Minor wave C should be a five wave structure, but it looks like a clear three on the daily chart. If you’re going to label a running flat then it’s vital the subdivisions fit perfectly and this one does not. This problem is very significant and this is why I judge the two wave counts to be about even in probability.
Intermediate wave (5) looks like a zigzag rather than an impulse, and has a corrective wave count. This is also a problem I have with this wave count.
Intermediate wave (2) is most likely to subdivide as a zigzag, which subdivides 5-3-5 at minor degree. When this 5-3-5 is complete then how high the following movement goes will tell us which wave count is correct.
It is possible to move the degree of labelling within intermediate wave (2) all up one degree and see it as over. However, I will not publish this idea as it is extremely unlikely and publishing it would give it undue weight. That would see intermediate wave (2) as far too brief and too shallow in comparison to intermediate wave (1). Only if price breaks above 1,251.97 will I seriously consider this idea.
Intermediate wave (2) of this new cycle degree trend may not move beyond the start of intermediate wave (1) below 1,131.09.
From January 23rd onwards, since the expected trend change, volume is highest on down days. This supports the idea that we may have seen a trend change and the trend is now down. Volume for Silver is even clearer, with a big spike on the down day there for 29th January. Although Silver has moved strongly higher today, volume for both markets is low for Friday.
At the daily chart level this third wave for minute wave iii looks like a very clear five wave impulse, which is typical for Gold. This wave count has the right look.
Minute wave ii was a double zigzag and 0.61 the depth of minute wave i lasting a Fibonacci three days on the daily chart. I would expect minute wave iv to be a sideways more time consuming structure, and shallow in relation to minute wave iii.
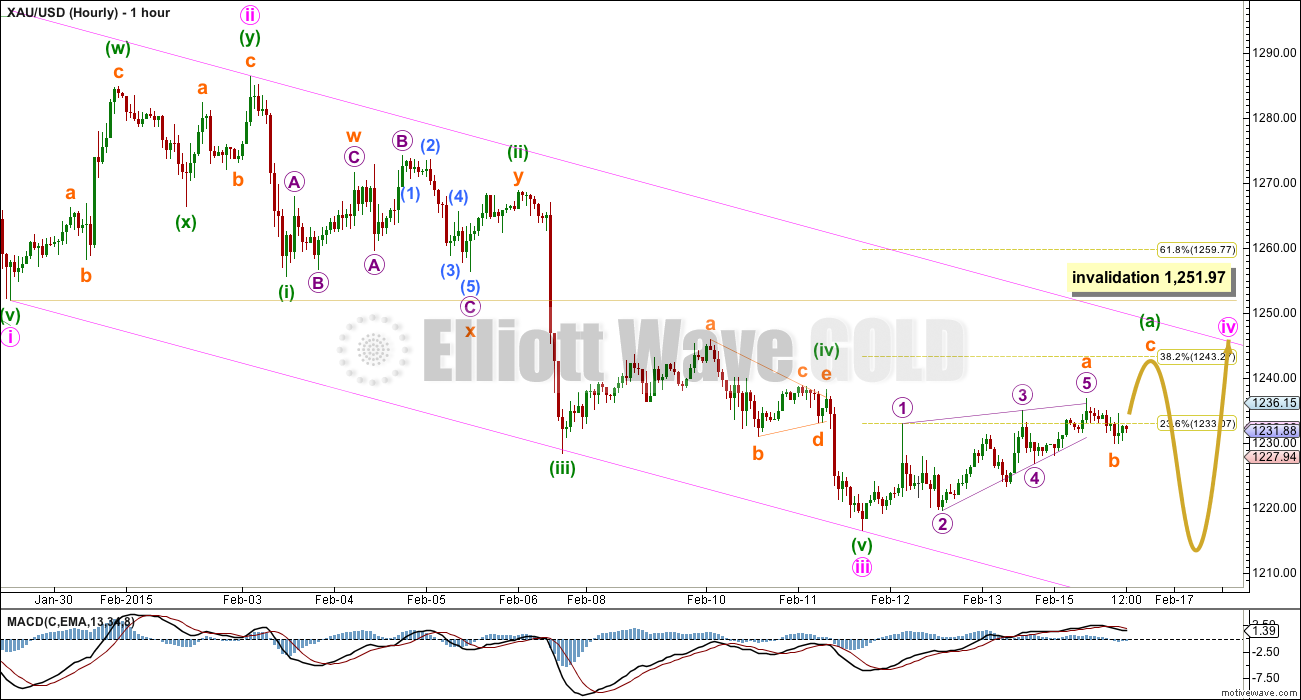
Because minute wave iv is least likely to be a zigzag I do not think that this five wave up movement is minuette wave (a) because minuette wave (a) is least likely to subdivide as a five wave structure. Minuette waves (a) is most likely to be a three wave structure if minute wave iv is a flat, combination or triangle.
Minuette wave (a) may be an incomplete zigzag. An expanded flat or running triangle may include a new low below 1,216.57 for its minuette wave (b).
Draw a channel about this downwards impulse: draw the first trend line from the lows labelled minute waves i to iii, then place a parallel copy on the high labelled minute wave ii. In this case I would expect minute wave iv to find resistance at the upper edge of this channel if it gets that far, and if it does it would be very likely to end there.
Because minute wave iii is shorter than 1.618 the length of minute wave i it is very likely that minute wave v to come may be a strong long fifth wave, typical of commodities. The trend channel will most likely not be redrawn, and minute wave v may have the strength to break below support at the lower trend line.
Minute wave iv may not move into minute wave i price territory above 1,251.97.
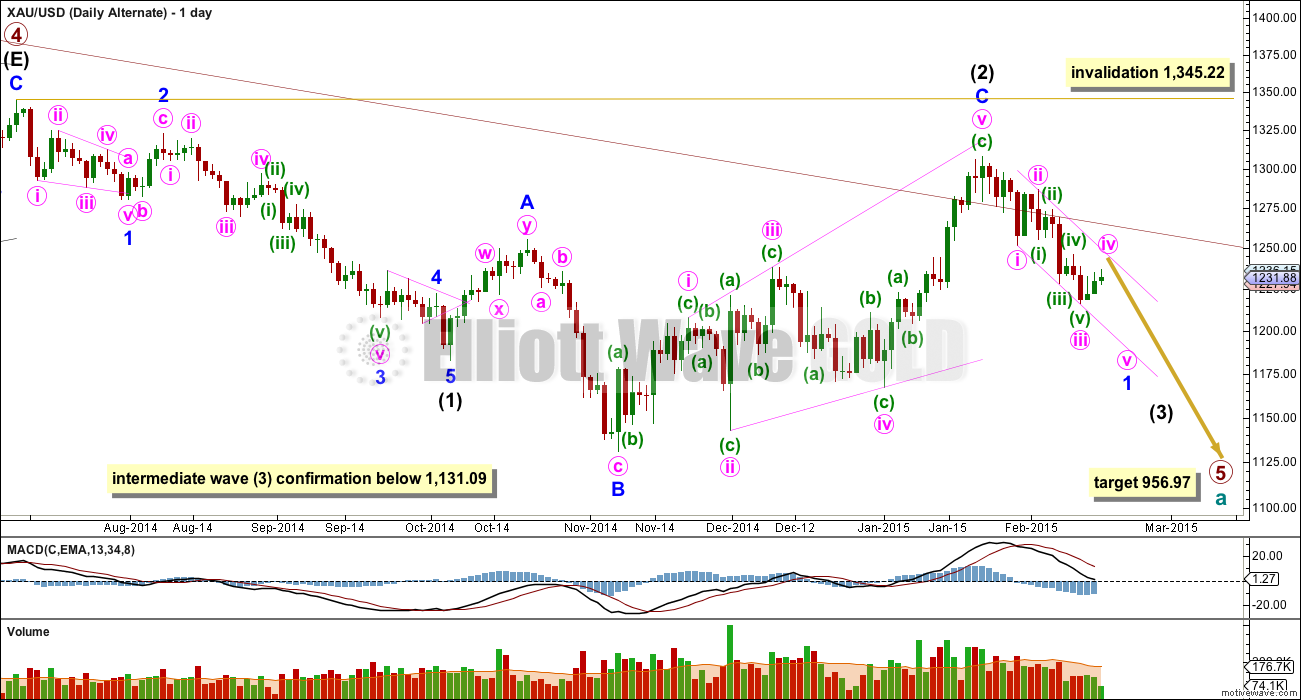
Alternate Daily Wave Count
The maroon channel about cycle wave a from the weekly chart is now breached by a few daily candlesticks, and is now also breached on the weekly chart by one weekly candlestick. If cycle wave a is incomplete this channel should not be breached. For this reason and this reason only this wave count, despite having the best fit in terms of subdivisions, only has an even probability with the main wave count. It will prove itself if we see a clear five down with increasing momentum on the daily chart.
Draw the maroon trend line on a weekly chart on a semi-log scale, and copy it over to a daily chart also on a semi-log scale (see this analysis for a weekly chart).
Within primary wave 5 intermediate wave (1) fits perfectly as an impulse. There is perfect alternation within intermediate wave (1): minor wave 2 is a deep zigzag lasting a Fibonacci five days and minor wave 4 is a shallow triangle lasting a Fibonacci eight days, 1.618 the duration of minor wave 2. Minor wave 3 is 9.65 longer than 1.618 the length of minor wave 1, and minor wave 5 is just 0.51 short of 0.618 the length of minor wave 1.
Intermediate wave (2) is an expanded flat correction. Minor wave C is a complete expanding ending diagonal. Expanded flats are very common structures and ending diagonals are more common than leading diagonals.
This wave count has more common structures than the main wave count, and it has a better fit.
For this alternate wave count the diagonal is an ending diagonal for minor wave C. Within an ending diagonal all the sub waves must subdivide as zigzags. The fourth wave should overlap first wave price territory. The rule for the end of a fourth wave of a diagonal is it may not move beyond the end of the second wave.
Although Gold almost always adheres perfectly to trend channels, almost always is not the same as always. This wave count is still entirely possible. The trend channel breach is a strong warning that this wave count may be wrong and we need to heed that warning with caution at this stage. For this wave count once minor waves 1 and 2 are complete (which would be labelled minor waves A and B for the main wave count) minor wave 3 downwards should be very strong and extended, and would probably take price below 1,131.09.
A new low below 1,131.09 would confirm that a third wave down is underway.
At 956.97 primary wave 5 would reach equality in length with primary wave 1.
Intermediate wave (2) may not move beyond the start of intermediate wave (1) above 1,345.22. If this invalidation point is passed this wave count would be fully invalidated.
The short to mid term outlook for both wave counts is identical. The structure and labelling on the hourly chart is identical, so I will publish only the one hourly chart while the wave counts do not diverge.
This analysis is published about 04:29 p.m. EST.


trade from chart (daily shown)
Lara
Is gold 1203.87 the low for the day and gold heads up from here towards 1,243 potential area staying below 1245 upper trend line?
Or can gold drop still drop below 1203.87 before heading up in the next day or two? I haven’t bought anything as no lower invalidation and have conflicting counts whether gold finished low of b or (b).
My conclusion is that this is the low. I expect an upwards wave from here to 1,243. It should give a green candlestick for Wednesday.
Lara thank you for your clear message.
I did buy some GDX near day low before the close.
Now need FOMC minutes Wed 2 pm to raise gold.
ALT count looking great. Either 1 down is done or a bit more to go, then bounce to ~1250 area before wave 3.
all on track
wavetrack just send me this alt count which I suppose will become primary if the current decline will extend a bit more…
I just charted that idea. It doesn’t work.
Unless…. the third wave in that diagonal is the longest actionary wave, which means re-writing EW rules for diagonals. That is actually something I could consider, and have in the past, but I do think its rather dangerous and one should stick with a wave count which fits the rules in Frost and Prechter.
The problem with that ending diagonal is the fourth wave is shorter than the second, which indicates the diagonal should be contracting. But the third wave is longer than the first by 4.02. Which indicates the diagonal should be expanding.
So the wave lengths of that possible diagonal don’t fit the rules outlined in Frost and Prechter.
EWP is relatively very young science, dont be afraid to experiment, Frost and Prechter, even R.N. have overlooked some details. At least I tend to believe so. But of course, to prove something you need enough samples to confirm that. I am more interested in a basic EW form, so lets wait and see.
Per Lara’s current hour wave count Did gold just completed wave (b)???
Lara wrote above:” Minuette wave (a) may be an incomplete zigzag. An expanded flat or running triangle may include a new low below 1,216.57 for its minuette wave (b).”
The new low 1204.
minuette (a) didn’t complete the zigzag so we are not in minuette (b) .
It might be possible to label minuette (a) as a complete double zigzag, in which case minuette (b) could be over.
I don’t think double zigzag is allowed in 1st wave position of an expanded flat ?
The book says it has to be a 3 and “Wave A is never a triangle”. I think a double zigzag counts as a 3…correct me if you think otherwise.
all i really know is that 1. I finally sold my DUST for profit 2. It’s best to look to the experts (Lara) for wave determination. 3. There are more trading opportunities coming!
Minute wave iv circle has three parts, (a), (b), (c) and began on February 11.
I believe gold is now in the 5th wave of the 5th wave of minuette wave (b) of minute wave iv circle. When the 5th of the 5th of (b) ends today I buy GDX.
Maybe we will get comments from Lara by the time gold is bottoming today?
Kitco did mention today the key 61.8% Fibonacci retracement support drawn off the November-January rally move, which comes in at $1,199.60 and the $1,197-$1,196 area.
By Lara’s count , minuette (a) should have started from a new high . Her analysis was that minuette (a) can’t be a five . So we can’t be in minuette (b) . (a)(b)(c) can’t be an expanded flat because the (a) is a five .
The only thing that makes sense now is that we were in Minuette IV , not Minute IV , and that Minuette IV was some double zigzag .
I agree. Minute IV should start somewhere from 1196-1199. maybe this will make Lara favour the alt.
I am being cautious here. Not totally convinced that the b wave has ended. The only real confirmation that it is over would come with a 200% move of wave a. That marker would be hit around 1196-97. However, IMO movement below 1200 would already be close enough. Unfortunately, there won’t be much time to make a trading decision at that point – once 1200 breaks, the price will drop quickly. Hope gold holds in this area until Lara can weigh in.
Lara’s recent activity demonstrate a move to at least 1243 I believe. We should get a bounce shortly… (person with long position pleads…)
I have confidence in Lara’s wave count and believe this to be a continuation on minuette IV. A rally to 1243 would confirm this and I expect that in the next 24- 36 hours.
forgive my ignorance… i thought we were somewhere in minuette a-b-c (probably b)
How will we tell if this is a b wave or a 5? I think there is no invalidation for the b wave if I remember correctly, meaning it could go as low as it wants to go. Maybe the structure will tell us what it really is???
For an expanded flat, wave b usually retraces 105-138% of wave a. I figure 138% is at about 1209 so we surpassed it. That reduces the probability of an expanded flat somewhat. As I understand Lara’s writings, if we are now in wave 5 then wave 4 would have been a double zigzag which is reduced probability because of similarity to wave 2.
Another angle to consider is that wave b needs to subdivide as a 3, although that 3 could have a first leg that subdivides as a 5.
Thanks Fence for the valuable info, still confused though. Shorted gold with an ave of 1230 and sold my shorts around 1211. Now not sure when to initiate more shorts as I don’t like to go against the trend. Will wait it out for now.
Hi guys. This could still be Minute 4. The wave count so far is 1216.50 – 1236 – 1205, which makes Minute 4 an expanded flat. This would happen if gold turns up from here and target Lara’s 1243.
Gold Plunges, Heading Toward Key “Line In The Sand”
By Kira Brecht of Kitco News Tuesday February 17, 2015 9:32 AM
http://www.kitco.com/news/2015-02-17/Gold-Plunges-Heading-Toward-Key-Line-In-The-Sand.html
The bull trendline support nearly coincides with key 61.8% Fibonacci retracement support drawn off the November-January rally move, which comes in at $1,199.60. The confluence of those two technical support zones creates an added significance at the $1,197-$1,196 area.
this movement is taking too long so I think minuette b is almost complete. It looks like minuette iv will be a zigzag also.
Looks like Wave v down has begun – looks like iii of v right now.
Hi have bought expecting a rise from here as stated by Lara – forgive my novice question. Is this your perception, familiarising myself with the different waves.
Yeah it does not look any more like wave b. I closed on loss. If this is wave b I will wait @ 1243. That would mean the correction was actually not a leading diagonal typical of waves A. Looking forward to see Lara’s comment.
Looks like this wave B (or X) still needs one wave down to be completed. Should be done in a few hours. Looking for the right time to enter L.
From Lara’s hour chart wave b and c of wave (a) just completed and now low below 1216 will complete wave (b) today. Then up to wave (c) to 1243.??? That should complete wave iv.
Am I reading right???
Lara pointed that wave A should not be leading diagonal for minute wave. Wave of this grade is too big (?) to be consisted only from such structure as wave A. That would imply there is more to come. I think picture below depicts what is needed to match Lara’s idea.
Academic question?
Is it required that X or(b) needs to be lower than 1216 in WXY structure?
I don’t think so. I will look for the dip somewhere between 1215-1218.
Piotr will you be buying this dip? I would like to enter JNUG between 1215 and 1240 – is this a view you share?
Now I don’t think it will go any lower.
Wanted to buy @ 1217. Instead I bought @ 1215 because of stops activated and now is the big hmmmm
No.
You have to resolve how your wave W subdivides. It must be either A-B-C or A-B-C-D-E.
It is not a triangle. So you have to try to see it as a completed A-B-C; either a flat or zigzag.
Try to do that and you’ll see my problem today. It won’t fit.
This is the problem I always have had with EW. Sooner or later there appears such a structure I do not understand. I am now so confused I just wait for the market to show whats going on. And for your analysis to shed some light.