
More upwards movement was allowed for and has remained below the invalidation point and trend line on the Elliott wave hourly chart.
Summary: I am expecting the middle of a third wave has most likely just begun. The target for it to end is at 1,223. The targets for the bigger third wave, one degree higher, remain the same at 1,196 or 1,140.
Click on charts to enlarge.
Main Daily Wave Count
At this stage I judge this main wave count to have an even probability with the alternate below. I will let the structure of downwards movement, and momentum, tell us which wave count is correct over the next few weeks. At this stage they both expect more downwards movement so there is no divergence in the expected direction.
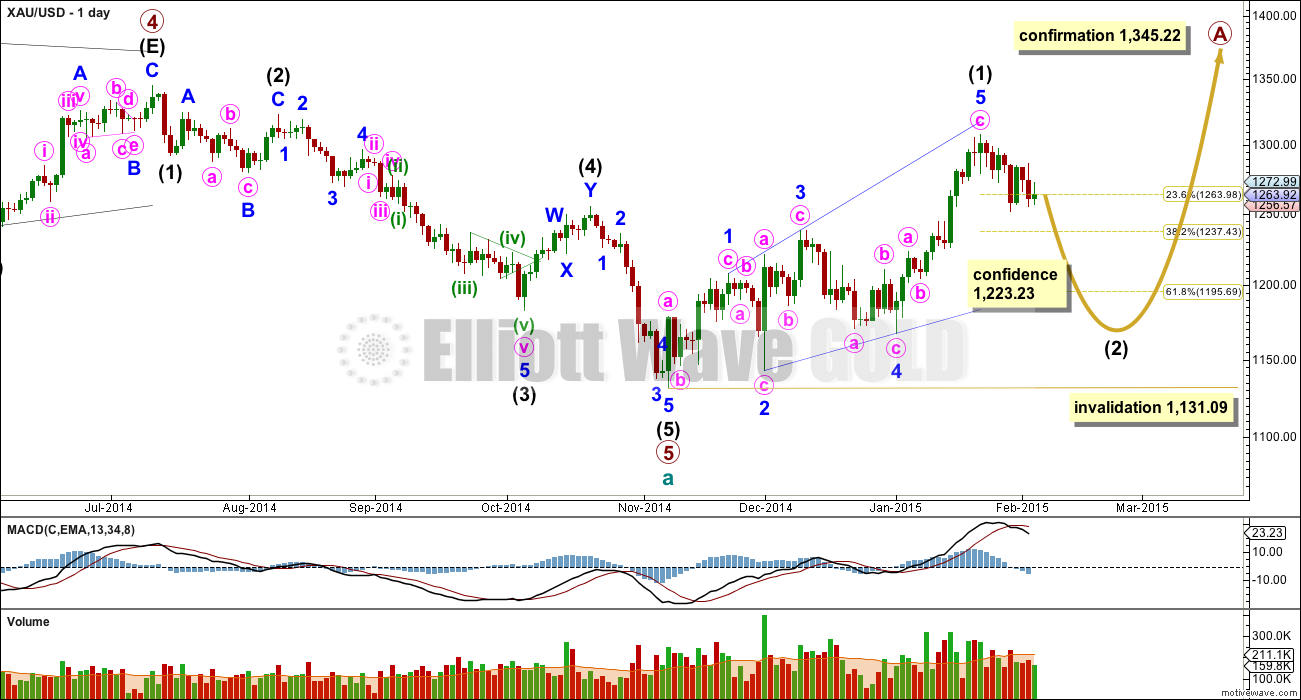
This wave count sees a five wave impulse down for cycle wave a complete, and primary wave 5 within it a completed five wave impulse. The new upwards trend at cycle degree should last one to several years and must begin on the daily chart with a clear five up.
The first five up may be a complete leading expanding diagonal. Within leading diagonals the second and fourth waves must subdivide as zigzags. The first, third and fifth waves are most commonly zigzags but they may also be impulses. This wave count sees minor waves 1, 3 and 5 as zigzags.
Leading diagonals are almost always followed by deep second wave corrections, sometimes deeper than the 0.618 Fibonacci ratio. This wave count expects a big deep correction downwards, and it should subdivide as a clear three on the daily chart (the alternate below expects a five down).
My biggest problem with this wave count, and the reason I will retain the alternate, is the structure of intermediate wave (2) within primary wave 5. This is a rare running flat but the subdivisions don’t fit well. Minor wave C should be a five wave structure, but it looks like a clear three on the daily chart. If you’re going to label a running flat then it’s vital the subdivisions fit perfectly and this one does not. This problem is very significant and this is why I judge the two wave counts to be about even in probability.
Intermediate wave (5) looks like a zigzag rather than an impulse, and has a corrective wave count. This is also a problem I have with this wave count.
Intermediate wave (2) is most likely to subdivide as a zigzag, which subdivides 5-3-5. When this 5-3-5 is complete then how high the following movement goes will tell us which wave count is correct.
Intermediate wave (2) of this new cycle degree trend may not move beyond the start of intermediate wave (1) below 1,131.09.
From January 23rd onwards, since the expected trend change, volume is highest on down days. This supports the idea that we may have seen a trend change and the trend is now down. Volume for Silver is even clearer, with a big spike on the down day there for 29th January.
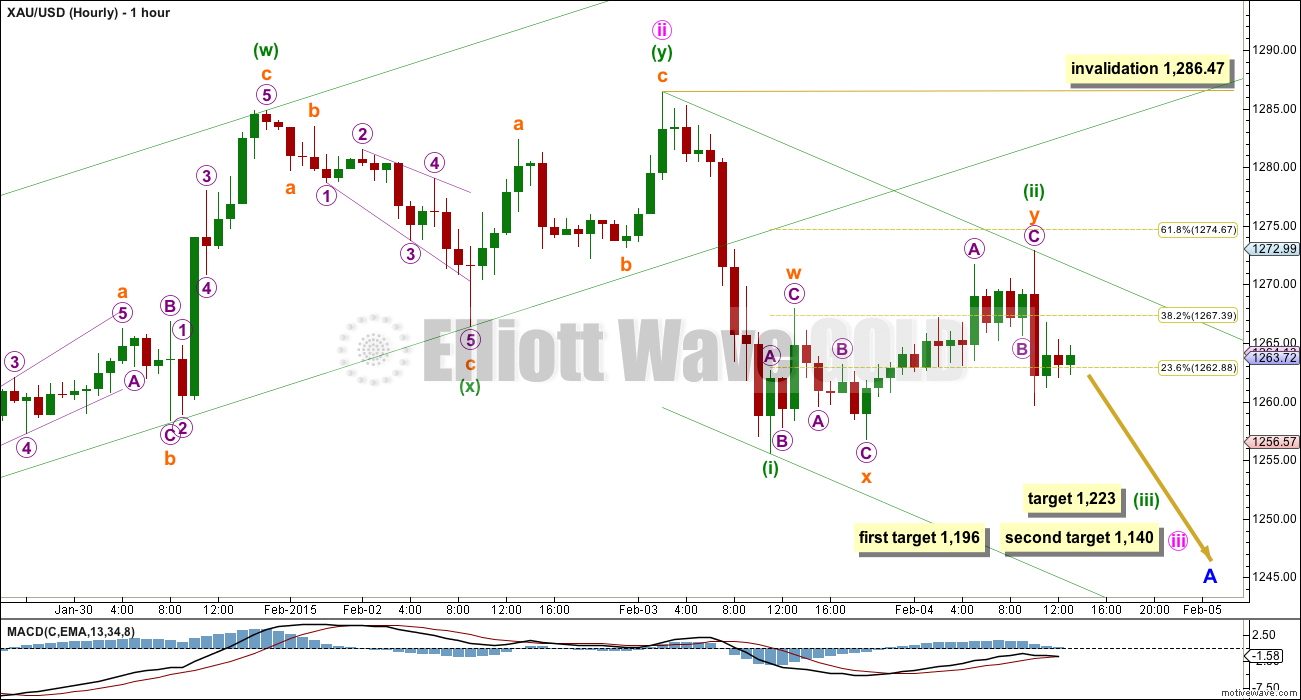
Minuette wave (ii) continued higher as a double zigzag to almost reach the 0.618 Fibonacci ratio. It now shows up on the daily chart as one small green candlestick, and so when minuette wave (iv) arrives it too should show up on the daily chart.
It is now more likely that minuette wave (ii) is over today than yesterday. It is unlikely to continue further because that would see it out of proportion to minuette wave (i). At this stage the only structure which could extend this correction would be a triple zigzag, but the rarity of triples means the probability of this correction extending is very low.
On the five minute chart the first wave down following the high labelled minuette wave (ii) looks like a five wave structure with an extended fifth wave.
At 1,223 minuette wave (iii) would reach 1.618 the length of minuette wave (i). This short term target may be met in one to three days.
Draw a base channel about minuette waves (i) and (ii). The upper edge of this channel should provide resistance for corrections along the way down. Minuette wave (iii) should have the power to break through support at the lower edge of the channel.
The mid term targets for minute wave iii remain the same. At 1,196 minute wave iii would reach 1.618 the length of minute wave i, and at 1,140 minute wave iii would reach 2.618 the length of minute wave i. It is not possible at this stage to state which ratio will be seen. When minuette waves (i) through to (iv) are complete I can add to the target calculation at a second wave degree and determine which is more likely.
Although minuette wave (ii) is very likely to be over now we must accept the risk that it may yet continue further. It could morph into a sideways moving flat correction; by moving the degree of labelling within it down one degree this may be a double zigzag for only subminuette wave a. If minuette wave (ii) does continue it may not move beyond the start of minuette wave (i) above 1,286.47.
Alternate Daily Wave Count
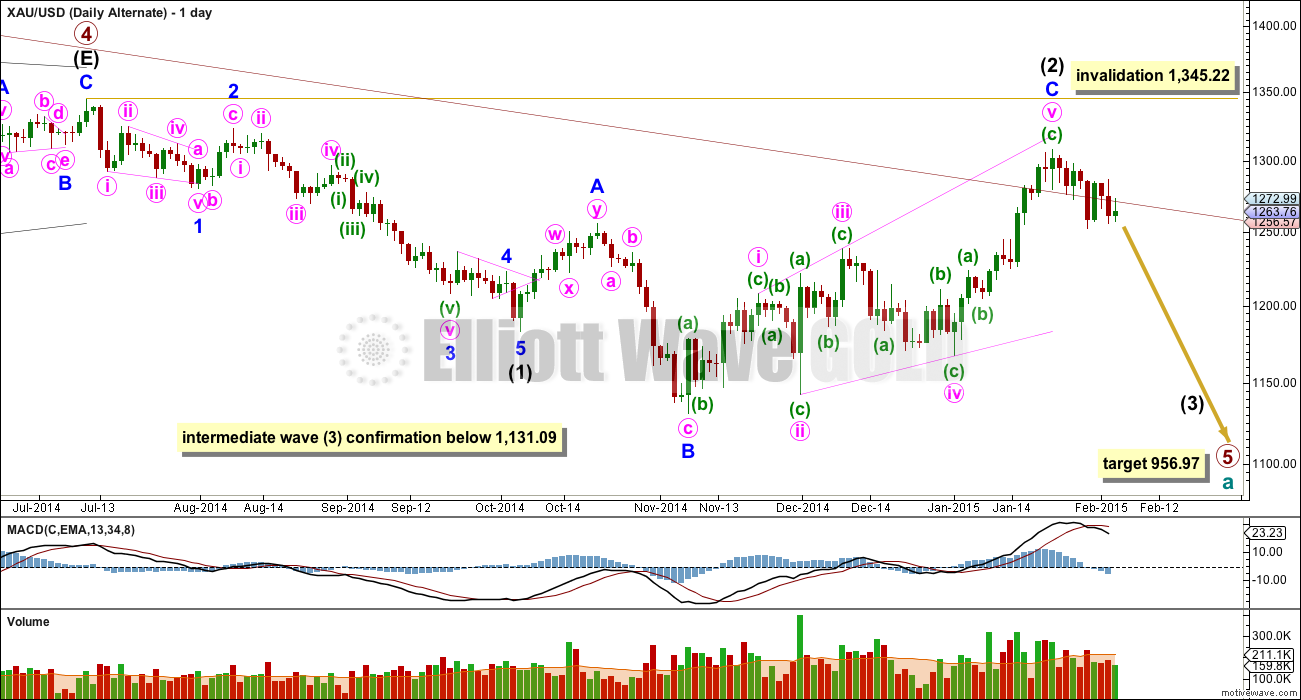
The maroon channel about cycle wave a from the weekly chart is now breached by a few daily candlesticks, and is now also breached on the weekly chart by one weekly candlestick. If cycle wave a is incomplete this channel should not be breached. For this reason this wave count, despite having the best fit in terms of subdivisions, only has an even probability with the main wave count. It will prove itself if we see a clear five down with increasing momentum on the daily chart.
Draw the maroon trend line on a weekly chart on a semi-log scale, and copy it over to a daily chart also on a semi-log scale (see this analysis for a weekly chart).
Within primary wave 5 intermediate wave (1) fits perfectly as an impulse. There is perfect alternation within intermediate wave (1): minor wave 2 is a deep zigzag lasting a Fibonacci five days and minor wave 4 is a shallow triangle lasting a Fibonacci eight days, 1.618 the duration of minor wave 2. Minor wave 3 is 9.65 longer than 1.618 the length of minor wave 1, and minor wave 5 is just 0.51 short of 0.618 the length of minor wave 1.
Intermediate wave (2) is now a complete expanded flat correction. Minor wave C is a complete expanding ending diagonal. Expanded flats are very common structures.
This wave count has more common structures than the main wave count, and it has a better fit.
Within an ending diagonal all the sub waves must subdivide as zigzags. The fourth wave should overlap first wave price territory. The rule for the end of a fourth wave of a diagonal is it may not move beyond the end of the second wave.
Although Gold almost always adheres perfectly to trend channels, almost always is not the same as always. This wave count is still possible. The trend channel breach is a strong warning that this wave count may be wrong and we need to heed that warning with caution at this stage.
A new low below 1,131.09 would confirm that a third wave down is underway.
When the first 5-3-5 down is complete on the daily chart this wave count would see it as minor 1-2-3 and the main wave count would see it as minor A-B-C. The following upwards movement will tell us which wave count is correct. If it moves back into price territory of the first 5 down (minor wave A on the main wave count and minor wave 1 for this alternate) then it can’t be a fourth wave correction so the main wave count would be correct. If it remains below the price territory of the first five down then it would be a fourth wave correction and this alternate would be correct. This divergence will not begin for a few weeks.
At 956.97 primary wave 5 would reach equality in length with primary wave 1.
Intermediate wave (2) may not move beyond the start of intermediate wave (1) above 1,345.22. If this invalidation point is passed this wave count would be fully invalidated.
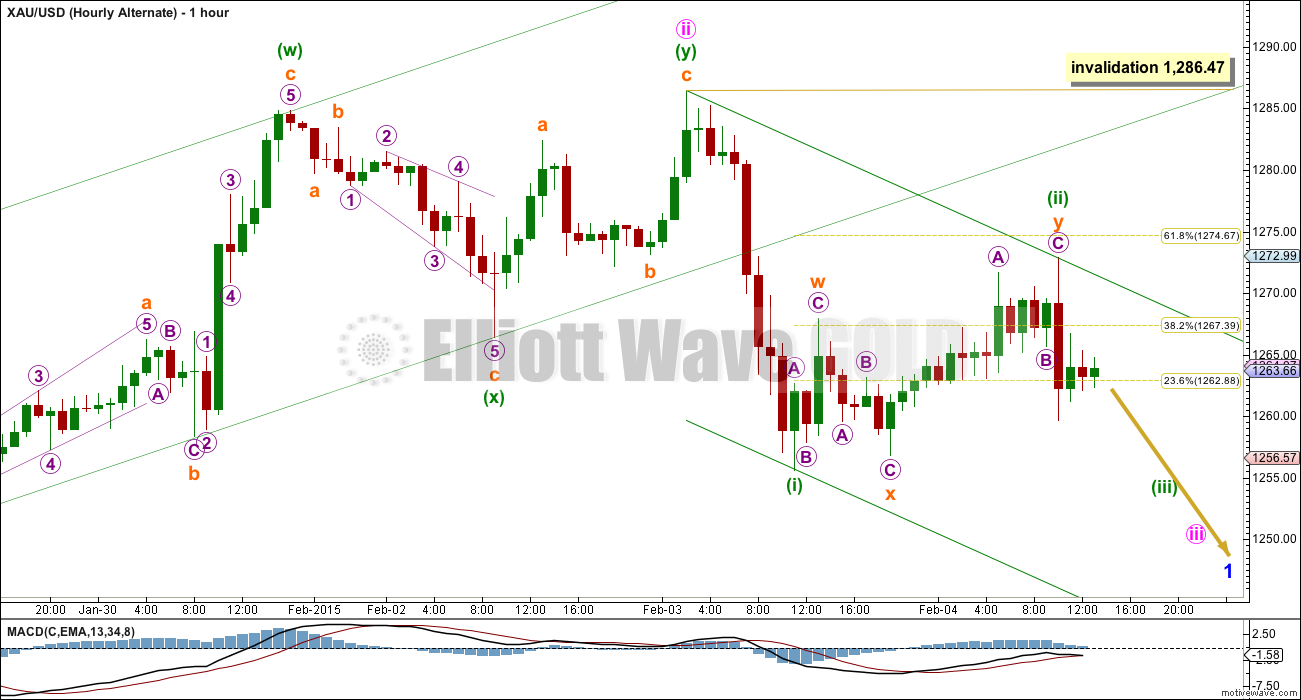
The short term structure, targets and invalidation points are still the same for both wave counts at this stage. They probably won’t diverge for a few weeks.
This analysis is published about 02:06 p.m. EST.
still like the ALT count but this ii is wearing me down…
Lara, what are your expectations for the length of this downtrend time wise for both the main count and the alternate. Are we talking weeks or months?Thanks!!!
Everything seems to be coming into play. GLD looks ready to being iii and even GDX and GDXJ seem to completing ii. Should have a weaker PM and a gap down in the am
will it go down ? or bounce again. my nerves
Gold hit 1258.87 has went below 1259.64 at 6 am for price confirmation minuette wave (ii) extremely likely over and minuette (iii) has begun.
Few days ago ratio of gold to oil was 28.
That is high. Norm is around 16. Today it is 25.
Expect this ratio to correct to norm.
Means gold down and oil up.
Wave iii in progress???? As Lara’s last report expected.
At 5:51 AM EST Gold is breking down from high 1274 Fib .618. Excellent Lara.
Now gold to crash thru 1255. Then comes 1223 target.
1223 is not on updated Feb 4th analysis.
This looks like a concerted move across commodities. Copper down 2%. SCCO.US has reached upper channel line and .618 fibo of the wave that begun in July.
JUST A VIEW: Very interesting set-up. The Gold Bulls are stronger today with price finding support at 1262/56-55…. A good upside move is expecting targeting a break above 1276-77 although thus far 1274-75 has curtailed the upside. Is Gold price showing early signs of bottoming?
Since Lara did the report gold has gone higher from 1264 to 1274 and staying higher as of 9:38PM EST.
Per her waves nothing has changed in counts. Invalidation is above 1285.
However any one can evaluate what micro wave is being played out here?
Another abc or wxy structure??
Upper chanel line still holds. 0.618 fibo as well. But for how long?
The release of ‘news’ may not make the waves, but it sure as hell influences the intensity and duration of whichever wave is in progress at the time.
U mean current corrective up wave intensity increases and duration is stretched out???
Is my take correct from yr comment?
Yes. But in other cases the wave might be reduced or even truncated. Thankfully the effect doesn’t last for long.
What do you think about this:
“Gold is having a difficult time making more headway
The correction from 1,130.02 has unfolded pretty much as expected, but I would still like to see one last high just above 1,307.64 fail almost immediately, but at this point I’m not sure we will get that chance. To keep the faith in one final move higher, we should see gold hold above 1,251.84 a break below this support will weaken gold, but only a break below support at 1,221.08 will confirm that a top is in place for a final decline towards 1,086.”
from: http://elliottwavesurfer.com/
and what is happening with Silver, XAG USD?
Thanks Ursula
Looks like we hit .618 retracement at 1274 on the hourly.
I’m trying to do a triple zig zag count, looking for the 5-3-5 on the last, it might be there. A very rare triple zig zag? Lara, thought?
well, there goes gold! i like the count as is but if this does break to the downside, i’ll be really surprised. Personally, i’m trying to figure out suitable ALT counts that call for more upside, at least short term
Got to be patient, and I hope this is it… last upsurge like Oct 21, 2014 before downward spiral. We may have jumped the gun, but I have faith in Lara’s count. The thing I have learnt is that managing the “time” expectation is the toughest. If I expect a move in 1-week I now try to multiply it by at least 2-3 to give me some breathing room. I got burnt a lot last year, 1 week off some biotech takeovers where my options positions expired worthless before huge profits and now I understand that time needs to be a pivotal factor to be taken into consideration. Cant get too cheap on time premium if that is the thing that separates the profit potential. Time has not been nice with and these waves….hope that’s it and we can get on!!
Pjay u seems to have experience with timing the trade with waves per Lara’s count every day. I am still learning to trade along the waves. I should have been flat as of yesterday when Lara said wave i down is complete and it will be sideways for wave ii .Some comments please on trading.
Thanks Plus PM me.
Papudi, I don’t day trade, but rather go out a couple weeks to a couple months most recently with at-the money options. I don’t have the stomach to day trade especially anticipating large swings. And I like to be able to sleep knowing that time will be on my side in the case of a sharp unexpected move. If the move comes early, I try to cash in without being too greedy (easier said than done though). For ex. I am long GG April at-the-money put. I will close it as soon as 3rd wave is over, and wait to buy another put at an another exp and strike when wave 4 is near over waiting for 5 down. Hoping this strategy works for me so I can someday change my name to mortgagefree2.
Agreed. Waves, gold or oil or dow can be seen by practiced EW practitioner (Lara) but time seems most difficult to anticipate.
As a new member I have noticed many trade DUST and JDST. I bought DUST at 12.25 when gold was 1295. Since then gold has declined $30 and the HUI has remained high. Anyone have any insight into this? DUST was double its current level ($24) when gold was $1240 late last year. Possible again?
DUST tracks GDX and JDST tracks GDXJ, both are 3x. They aren’t a 1:1 with gold, and you can see that easily if you go to stock charts and get a quote for $gold:gdxj or $gold:gdx. That will tell you the relationship they are trading at as well as the momentum indicators for the ratio.
MTSLD has good reply below.
I want to add to that DUST/JDST are short daily performance 3xetf for GDX/GDXJ res. Price decay is very heavy and are not buy and hold for long time.
On the long side there are NUGT/JNUG 3xetf for GDX/GDXJ.
Go to Yahoo and run a compariso of gold silever and gdx–you will see they are on the same road but
ECB says it’s lifting waiver on using Greek debt as collateral
Published: Feb 4, 2015 3:47 p.m. ET
http://www.marketwatch.com/story/ecb-says-its-lifting-waiver-on-using-greek-debt-as-collateral-2015-02-04?dist=afterbell
Look at chart in article. That is the same time gold spiked just before close.
Triple top at 1272 between today and yesterday.
Hope that correction of wave ii is over. Here comes 1223 in two days.
Did u buy more Dust or jdst?
I still do not know how to synchronize with the daily wave counts.
I wish I should not have bot the shorts yesterday and waited for this correction.
Anticipate retracements. Also I noticed since recent peak on daily charts: 2 days down 1 day up pattern. Maybe it continues.
Friday US data hopefully makes gold drop.
http://www.kitco.com/news/2015-02-04/Gold-Firmer-As-Trading-Turns-Choppy-Focus-on-US-Jobs-Report-Friday.html
Any one noticed. Right after market closed at 4PM gold dropped big time from 1266 to 1264 in 5m window. WOW
Unfortunately gold spiked 15 minutes after close to the .618 Fib amount. Hopefully for the last time today and down until hits the 1223 target.
Likely gold drops once it hits the upper green trend line on the hourly chart at $1,270.
Why is gold jumping quickly up and down the last 15 minutes before close?
ECb news
GOLD count looks on track
What is happening with GDX??
Lara? Thoughts?
Lara will be updating GDX report today.
At 1,223 minuette wave (iii) would reach 1.618 the length of minuette wave (i). This short term target may be met in one to three days.
.618 of the drop this morning is $1,268.30