The target for upwards movement in the short term, expected to be reached today, was 1,203 – 1,205. Price has only managed to move very slightly higher to 1,195.12.
Summary: The new main wave count expects the trend is up at cycle, primary, intermediate and minor degrees. At this stage minor wave 1 is close to an end, and I expect a sideways triangle for a fourth wave to complete and be followed by a short brief final wave up which may be about $17 in length, although it could be shorter. A clear breach of the upwards sloping pink channel on the hourly chart will be first indication that minor wave 1 is over and minor wave 2 down has begun. Minor wave 2 should last two or three days.
Click on charts to enlarge.
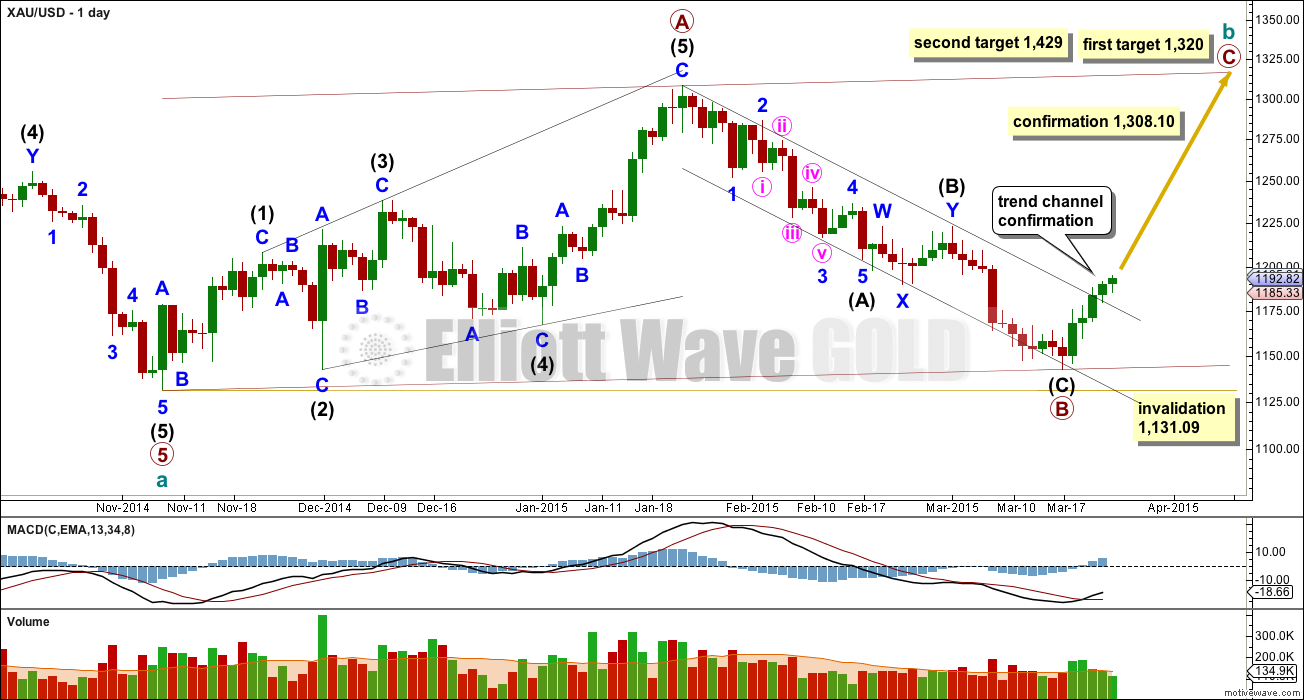
Main Daily Wave Count
After consideration at the weekly chart level, I have moved the degree of labelling within cycle wave b up one degree. When the current 5-3-5 zigzag labelled primary A-B-C is complete I will have alternate wave counts which again move the degree of labelling within cycle wave b back down one degree, because this may also be only primary wave A as a zigzag within a flat, triangle or combination for cycle wave b. Or it could be a shallow quick zigzag for cycle wave b as labelled. All possibilities are equally likely.
A new high above 1,308.10 would invalidate the alternate and confirm this main wave count at primary and cycle degree.
The upwards wave labelled primary wave A fits only as a five wave structure, a leading expanding diagonal. Within a leading diagonal the first, third and fifth waves are most commonly zigzags, and the fourth wave should overlap first wave price territory.
Because primary wave A subdivides as a five, primary wave B may not move beyond its start below 1,131.09.
At 1,320 primary wave C would reach equality in length with primary wave A. This would complete a 5-3-5 zigzag trending upwards. At that stage alternate wave counts would be required to manage the various possibilities for cycle wave b.
At 1,429 primary wave C would reach 1.618 the length of primary wave A.
Because primary wave A is a diagonal then it is highly likely primary wave C will be an impulse in order to exhibit alternation. Primary wave C may end about the upper edge of the channel drawn about cycle wave b.
This wave count sill has problems of structure within primary wave 5 of cycle wave a:
– within primary wave 5 intermediate wave (2) is a running flat within its C wave, looking like a three and not a five.
– within intermediate wave (5) the count is seven which is corrective; either minor wave 3 or 5 will look like a three wave structure on the daily chart where they should be fives.
It is for these reasons that I will retain the alternate until price confirms finally which wave count is correct and which is invalidated.
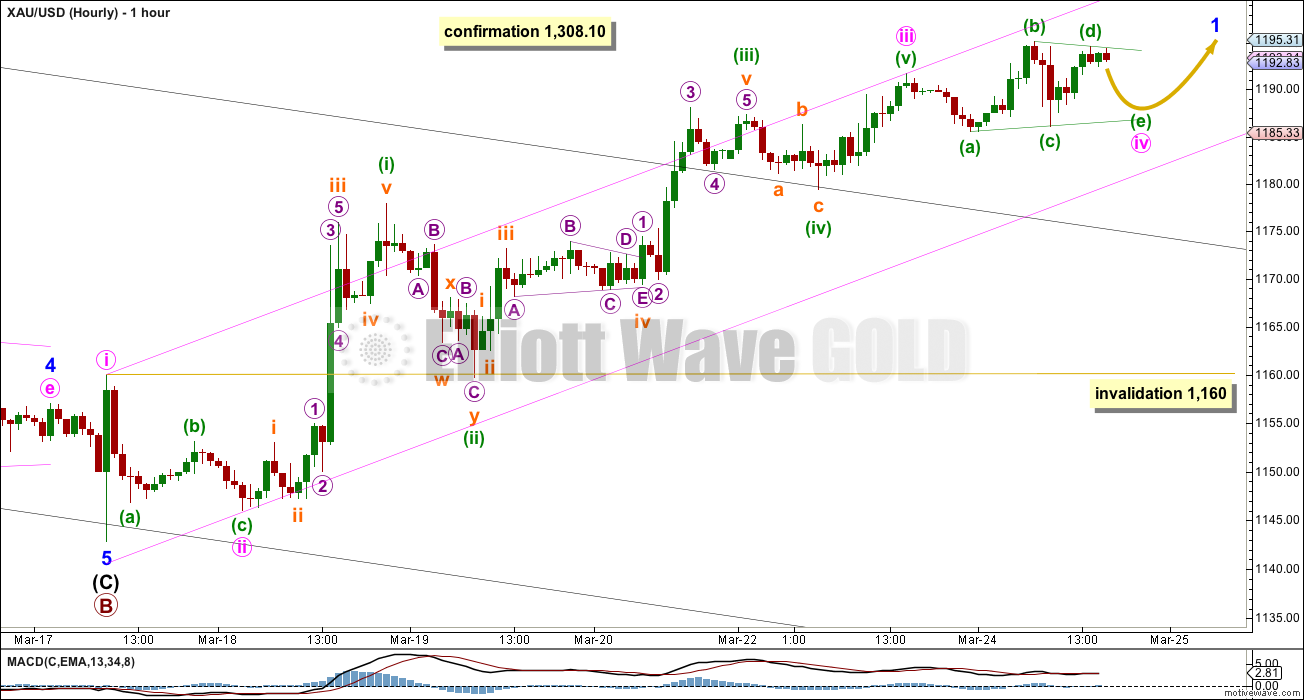
Minor wave 1 is close to completion.
Minute wave iii did not move higher and was over at 1,191.72. Minute wave iii is just 0.73 longer than 2.618 the length of minute wave i.
Ratios within minute wave iii are: there is no Fibonacci ratio between minuette waves (i) and (iii), and minuet wave (v) is just 0.06 longer than 0.382 the length of minuette wave (i).
Minute wave iv looks like it may be an almost complete running contracting triangle. For the triangle to remain valid minuette wave (d), if it continues, may not move beyond the end of minuette wave (b) above 1,195.12. Minuette wave (e) may not move below the end of minuette wave (c) below 1,186.11. If this lower price point is breached then minute wave iv would most likely be unfolding sideways as a combination. If the triangle holds then expect minute wave (e) to be highly likely to fall short of the (a)-(c) trend line.
If the triangle holds and completes as expected then the final fifth wave up for minute wave v would be very likely to be more brief and short than usual. It may reach equality in length with minute wave i at 17.18, but if this expectation is wrong it would be too optimistic. Minute wave v may be even shorter than this, because fifth waves following triangles are often surprisingly short and quick.
While minute wave iv is unfolding it may not move back into minute wave i price territory below 1,160, although it should not get anywhere near that point as it should just continue sideways. It should end within the price territory of the fourth wave of one lesser degree between 1,187.30 and 1,179.45.
When minor wave 1 can be seen as a completed five wave impulse then a trend change should be expected. Minor wave 2 should show up on the daily chart and is likely to last about two or three days. The invalidation point must move down to the start of minor wave 1 at 1,142.82. Draw a Fibonacci retracement along the length of minor wave 1. The 0.382 and more likely the 0.618 Fibonacci ratios would be expected targets for minor wave 2.
Draw the channel about minor wave 1 using Elliott’s technique: draw the first trend line from the highs labelled minute waves i to iii, then place a parallel copy on the low labelled minute wave ii. Minute wave v may end at the upper edge of the channel. When this channel is breached by subsequent downwards movement that shall provide trend channel confirmation that minor wave 1 is over and minor wave 2 has begun.
Alternate Daily Wave Count
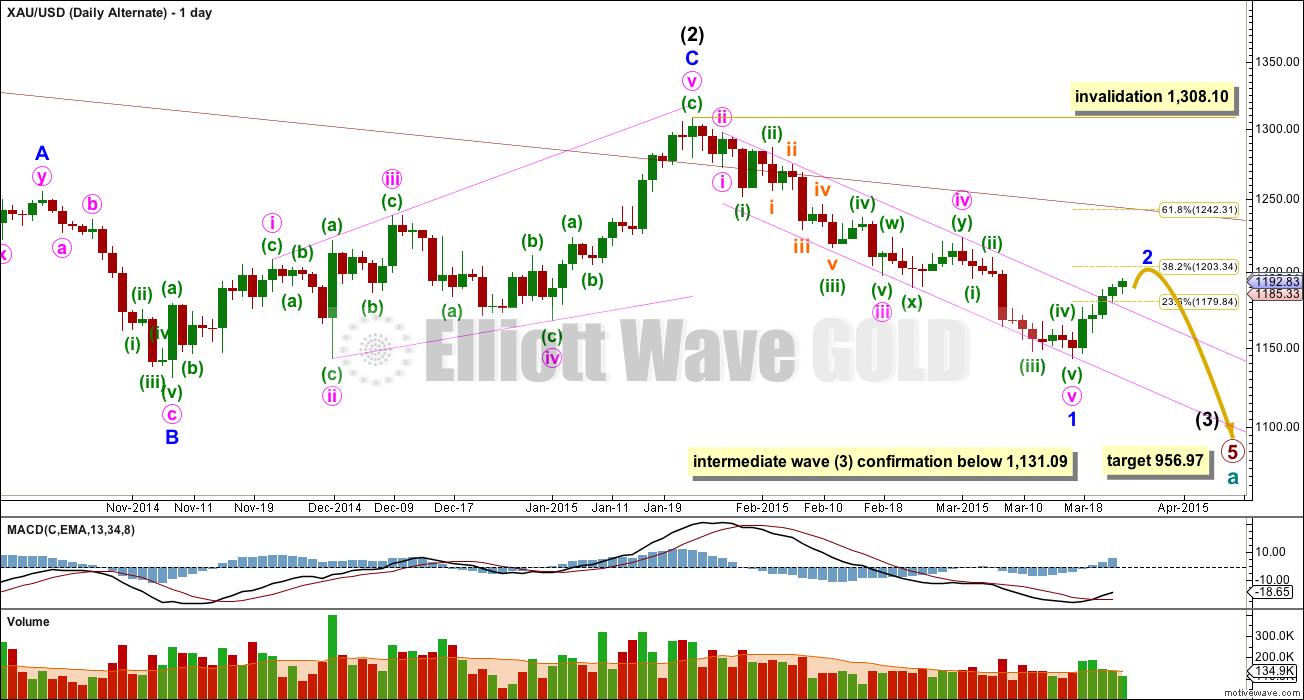
This alternate wave count sees Gold as still within a primary degree downwards trend, and within primary wave 5 intermediate wave (3) has begun.
At 956.97 primary wave 5 would reach equality in length with primary wave 1. Primary wave 5 may last a total Fibonacci 55 weeks. So far it is now beginning its 36th week.
The maroon channel about cycle wave a from the weekly chart is now breached by a few daily candlesticks and one weekly candlestick. If cycle wave a is incomplete this channel should not be breached. The breach of this channel is a warning this wave count may be wrong.
This wave count still has a better fit in terms of better Fibonacci ratios, better subdivisions and more common structures within primary wave 5, in comparison to the main wave count above.
Within intermediate wave (3) minor wave 1 is a long extension. Within minor wave 1 minute waves iv and ii are grossly disproportionate, with minute wave iv more than 13 times the duration of minute wave i. This also reduces the probability of this wave count.
A new low below 1,131.09 would confirm that intermediate wave (3) down is underway.
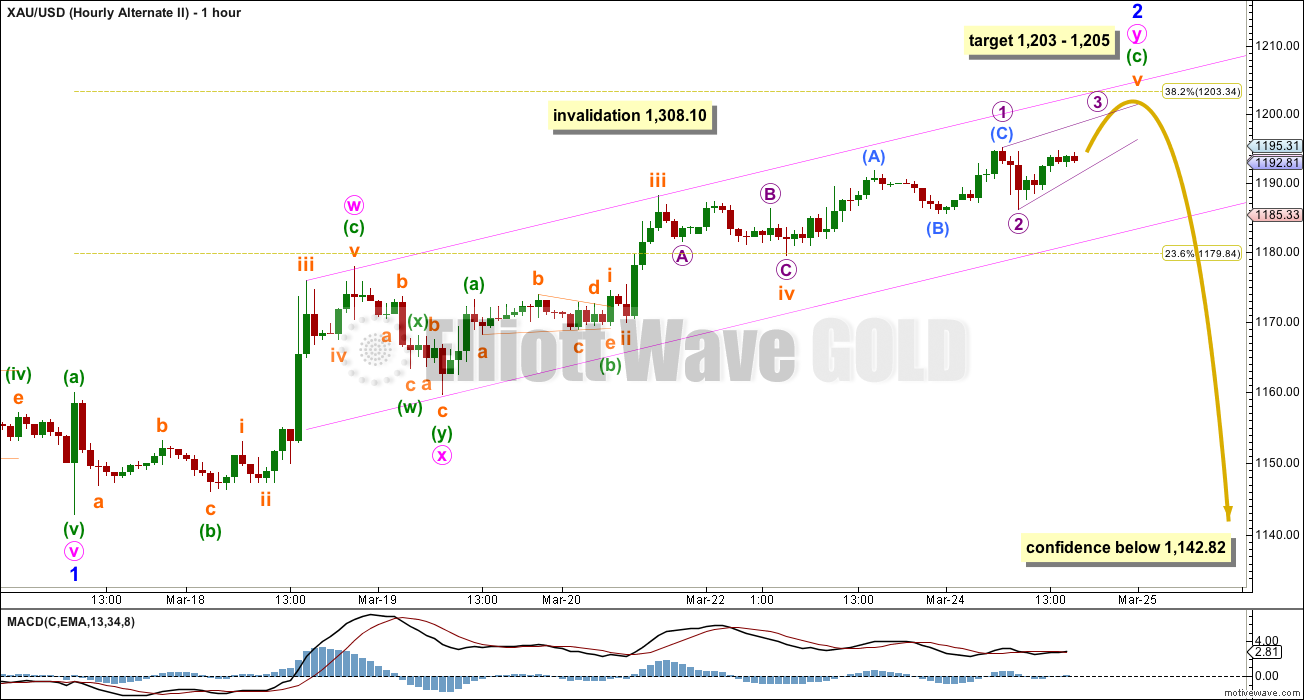
Minor wave 2 may not move beyond the start of minor wave 1 above 1,308.10. It may end about the 0.382 Fibonacci ratio. Because this is a second wave within a third wave one degree higher it should be expected to be more brief and shallow than a second wave correction normally is.
Minor wave 2 may be unfolding as a double zigzag, with the second zigzag in the double close to completion. At 1,205 minuette wave (c) would reach 2.618 the length of minuette wave (a), and at 1,203 minor wave 2 would reach the 0.382 Fibonacci ratio of minor wave 1.
The final fifth wave of subminuette wave v may be unfolding as an ending contracting diagonal, a reasonably common structure. All the sub waves must subdivide as zigzags, and the fourth wave of micro wave 4 must overlap back into first wave price territory.
Once the final fifth wave upwards is complete, thereafter a new low below 1,142.82 would add some confidence to this wave count. It would still require a new low below 1,131.09 for full confidence in the downwards trend at primary degree.
At the hourly chart level the decrease in momentum would be expected. This hourly wave count fits better with MACD.
This analysis is published about 05:35 p.m. EST.


Looks like it to me!
MACD is supporting this.
didn’t micro wave 4 move back into first wave price territory?
Could this be The final fifth wave of subminuette wave v may be unfolding as an ending contracting diagonal Lara talked about in the alt?
Micro 4 hasn’t moved back into micro 1 price territory yet, micro 1 has it’s high at 1,195.12.
There’s a problem with that ending diagonal now though. Draw the trend lines from micro 1 to the last high which would now be micro wave 3. The diagonal should be contracting because 3 was shorter than 1. Which means 4 must be shorter than 2. When you draw the 2-4 trend line you’ll see that submicro (B) within micro 3 is well outside (below) that line.
Diagonals almost always fit perfectly within their trend lines. That one doesn’t look right at all.
Thank you for the correction, I’m learning as I go while reading along.
Martin Armstrong cycles model sees gold low of 900s to 600s with target dates Nov/Dec 2105 or April 2016 giving preference to April.
Is there an EW model that agrees with Armstrong’s projected lows and dates?
davey, i paid 400$ for those reports.
I like Armstrong’s work but he is difficult to understand. Is there an EW wave / model that would be a guide to reach Armstrong’s “big picture” date and target?
Would be very interesting for an EW guru on this forum to compare Lara’s primary wave models to see if they agree with Armstrong’s dates and targets.
The alternate wave count which sees cycle a ending at 956.97 could do that by November / December this year. It’s taken 8 months so far, November / December would seem reasonable if intermediate (4) is in proportion to intermediate (2).
Lara, thanks for answer–your decision to keep alternate wave count active a Jedi move.
Minor wave 1
Main hourly upper target 1186.70 + 17.18 or less = 1203.88 or less
alternate hourly upper target zone 1203 – 1205
I am guessing minor wave 1 hasn’t peaked yet and will this morning.
Any wave counts now?
I can see how to label it so it is over and I can see how to label it as still working on subwave 4 of an ending diagonal.
After so many months of learning EW analysis from Lara one thing stands out clearly is that any wave completion is not determined until it is over in the hindsight.
If one can say wave is over at a price point in real time and gold behaves accordingly EW wave path believe me my trades would have been very profitable.
That is the nature of the mother nature EW.
You are absolutely right. Trading is about probabilities; there are no guarantees. But, we have to go with the flow. We have to act upon the most probable movement. If we wait until the move becomes apparent in hindsight, the trade opportunity is gone. Nothing ventured, nothing gained.
That is an important insight papudi. The next step is to try and identify which types of EW situations tend to give very high probability predictions.
Exactly. Which is why trend channels and confirmation are so important.
There is no TA method which will pick highs and lows as they occur. Not one. They all use various indicators for confirmation after a change.
So for this instance the pink channel on the hourly chart needs to be breached to the downside for trend channel confirmation. We may also use a price point; the beginning of the fifth wave is always a good one. Once price moves beyond that it may not be a second wave correction within the final fifth wave, and so the final fifth wave must be over. If the wave count is right and you’ve identified the end of the fourth and beginning of the fifth correctly then this price point tells you when you’ve had a trend change.
In this instance it would be 1,186.78, the end of the triangle for minute iv.
Does that all make sense?
Makes perfect sense. Very clear 🙂
Just back from a short break over the weekend, and just in time too.
fencepost is right. Minute 5 of minor 1 is already over or it has just completed minute 4. If it is still underway, then 1186.70 – 1193.90 – 1190.81 – 1199.78 – 1194.79 – ? Minuette 5 is most likely to be equal to minuette 1 in length, and should complete at 1203.76. At one degree higher, minute 5 = minute 1 yields completion at 1203.75. The two targets are almost identical and hence the chances of being right ought to be high.
I would watch the price rise to determine whether minor 1 has ended. It is obvious that if price rises above 1199.78, then minor 1 is not complete yet. If otherwise, then minor 2 is already underway. (The other possibility of a truncated fifth is rather remote).
Gold for April delivery declined 0.2 per cent to US$1,188.80 an ounce on the Comex. Prices capped a fifth day of gains yesterday in the longest run since the period to January 20. – See more at: http://www.themalaymailonline.com/money/article/gold-drops-from-two-week-high-after-cpi-data#sthash.FPpLCkhs.dpuf
Gaps will be filled on miners this morning, looks like the first 5-wave of minute v is about done.
Yep, GDX gap now filled at exactly a 62% retrace. Now let’s see how the correction behaves.
Has Minor wave 2 down already begun at 1199.78 at 9:33 am?
It appears like you and the chart are suggesting that Minor wave 2 down has already begun. Is that correct?
Miners will probably lead so there might not be too much upside left before they correct. I could see one final push up that may or may not make new highs if Gold runs up to 1203/05/07 area. $9.00 was hit on JDST this morning, but I am going to wait just a little longer.
Yes, I believe that minor 2 has already begun and I will be interested to see how prices respond on the retrace to GDX 19.46 or 19.00 or even 18.80 if that underlying gap needs to get filled. I admittedly am not an EWave technician but I’m very interested in applying Lara’s analysis as a compliment to my TA to increase my confidence in trades.
Additionally, the Fibonacci structure of the GDX rise from 3/11 through today is very tidy on the 15-min charts. Wedge appears to have broken today.
1194/95 restricting with 1187/86 holding and 1179 below that…. narrow $7 trade range so far, wonder where gold price goes from here….
Gold video update by Joseph Roy-Byrne.
http://thedailygold.com/what-to-watch-during-precious-metals-rally03-24-15/
Lara, I am not convinced of the main wave count and probably won’t be until gold passes 1240ish. Until then, I will be using your alternate. However, I was curious why minor 2 must be so short in length and duration. I understand the concept behind the pull of intermediate 3, but does it have to be that extreme? Since minor 1 was rather lengthy in distance and duration, doesn’t it seem reasonable for minor 2 to go on for a little longer as well? If minor 2 is a 3-wave correction, could gold be ending the first of those 3 waves now? I’m thinking that the entirety of minor 2 could last about 13 days and could end anywhere shy of the 0.618 mark (perhaps 1230s). That final wave up will likely convince many that it is a 3rd wave, when in reality it could drop like a rock a few days after it starts. Thanks.
I agree. 1230 – 1240 will likely be a key area.
Thanks for posting this chart. The red arrow demonstrates the idea perfectly.
To add to what I was suggesting, I believe that clearing the 1223 level will throw the largest number of traders off track….especially if gold gets there quickly.
I agree. I see potential ABC like wave II max 1240-50. Last move down for me was first wave of five.
Reasoning Lara has given for switching counts may stay if gold goes upto 1230.
Only time Lara will switch again is if gold drops below 1130 low. OR may be the current wave count gets invalidated.
Yes looming seasonality period of 34 years has put the gold high at 1307 already till the summer time.
Just an observation on seasonality charts – there are some discrepancies when you look at 30, 34 or 40 year charts. Generally though, bottoms tend to occur in the late spring or summer months.
Observation has been that once high is in place between Jan-April no new high is made. This time high is already there.
Last year 2014 high was in March 1345 that were one of the corrective wave ended.
Papudi, are you saying gold has already made it’s seasonal high? When? What price?
Late spring or summer for Northern hemisphere?
Woops! Unfortunately, you’re always going to be in the minority.
LOL.
That’s true, but only because there’s more ocean in the Southern hemisphere.
The membership if EWG is truly global; we have members in the southern part of Africa, in South America, Australia and New Zealand.
It could be longer and higher, yes. However, just because the first wave is extended doesn’t mean the second wave has to be more time consuming.
Within the last big intermediate degree impulse the extended wave was the third, and the following fourth wave correction was a triangle which tends to be a more time consuming structure. It only lasted 8 days in comparison to 31 days for the extended third wave.
Here’s another way to think about it. Within an impulse it is the proportion of the second and fourth wave corrections which give the impulse the “right look”. The second and fourth waves need to be somewhat close in duration for this. If the correction following an extended wave was always much longer in duration than the other correction this proportion would be lost.
OK, here’s my plan at this point. I will be adding shorts tomorrow/Thursday and closing them by EOD Friday most likely. I won’t add any longs back until I can see what is happening on Sunday night/Monday. Chapstick was looking to add longs at 1170’s, Lara’s analysis looks for a pullback somewhere in that area, so a drop from 1203/7 to 1175/79 could bring the miners back down to fill the gaps left over the past few days (about $23.xx on GDXJ). That would probably backtest the channel break and might be a great entry point to go long.
Good luck!