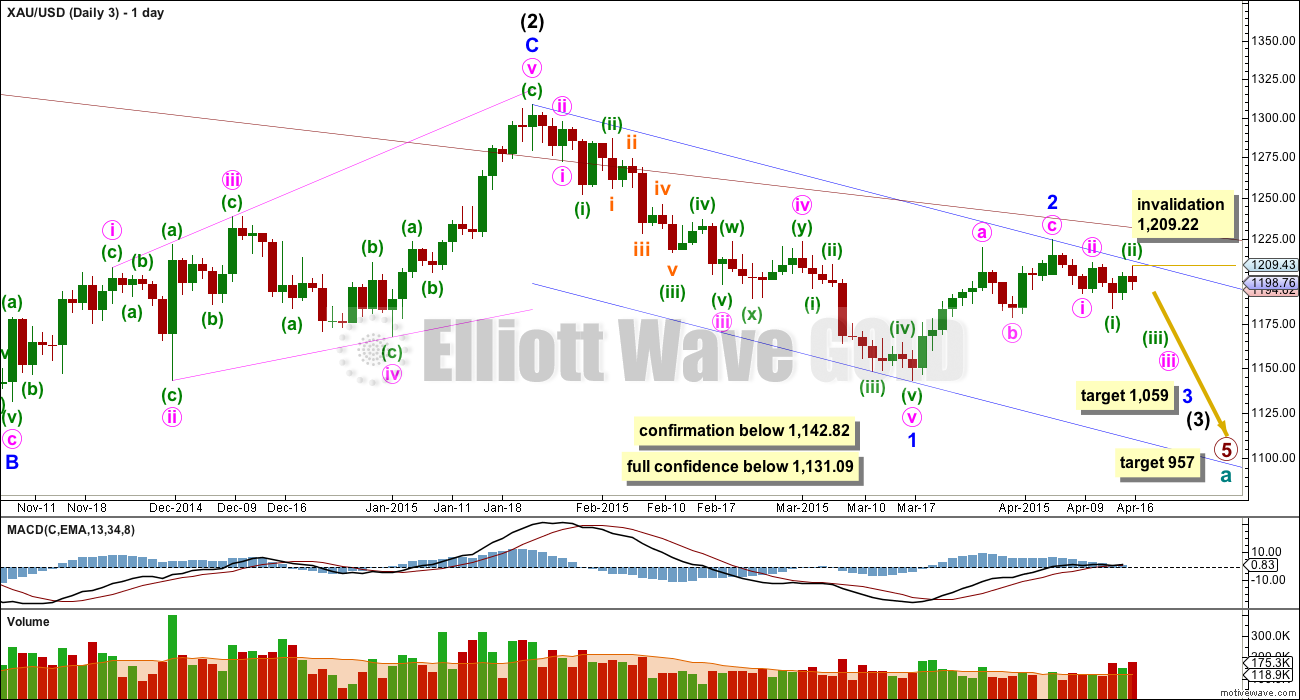
All four Elliott wave counts remain valid. The most recent movement has a better fit in terms of structure for Elliott wave count 4.
Members should use their own preferred technical analysis tools to judge for themselves which wave count they can use as a road map for the immediate future. One by one price will invalidate wave counts until we have one left.
Summary: Gold is in a sideways consolidation phase which began on March 27th. An increase in volume for Thursday’s down day further supports the idea that the breakout when it comes may be down. However, the Elliott wave picture remains remarkably unclear. While price remains below 1,209.43 and above 1,178.59 multiple wave counts will remain valid. The very short term sees all wave counts expecting at least some downwards movement.
Click on charts to enlarge.
To see weekly charts for bull and bear wave counts go here. Wave counts 1 and 2 follow the weekly bull count, wave counts 3 and 4 follow the weekly bear count.
Wave Count #1
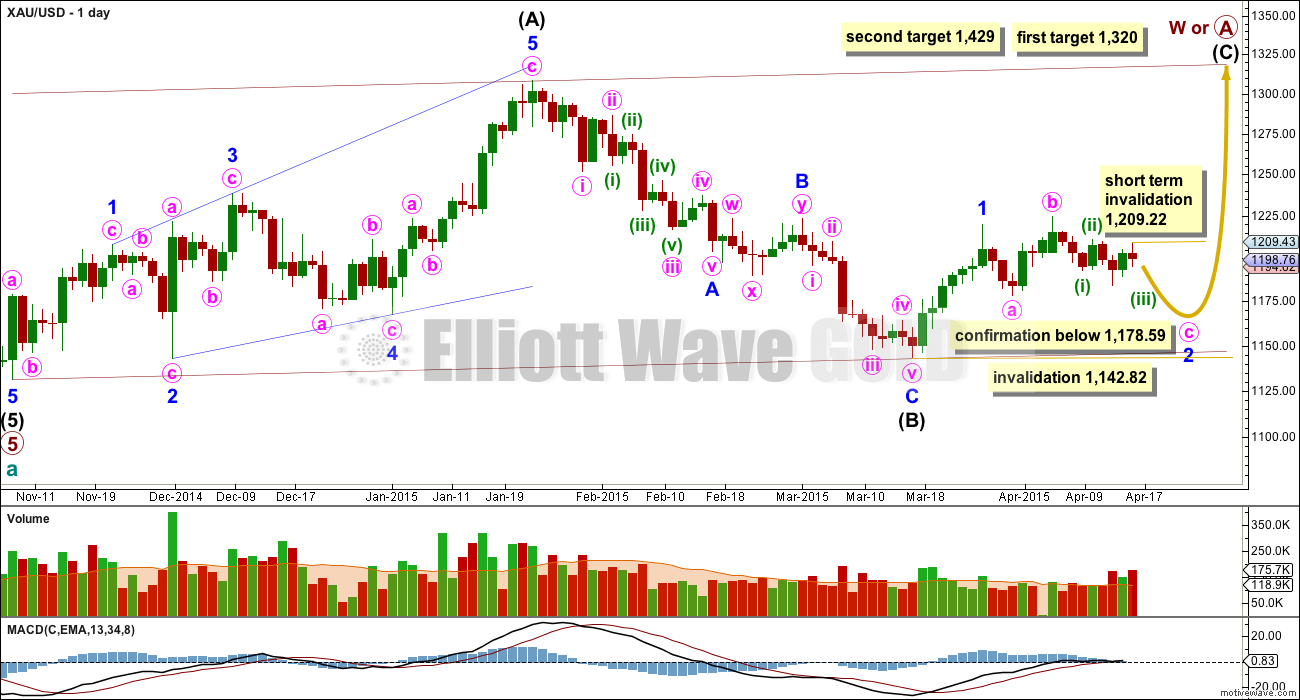
So far within cycle wave b there is a 5-3 and an incomplete 5 up. This may be intermediate waves (A)-(B)-(C) for a zigzag for primary wave A, or may also be intermediate waves (1)-(2)-(3) for an impulse for primary wave A. Within cycle wave b primary wave A may be either a three or a five wave structure.
Intermediate wave (A) subdivides only as a five. I cannot see a solution where this movement subdivides as a three and meets all Elliott wave rules. This means that intermediate wave (B) may not move beyond the start of intermediate wave (A) below 1,131.09. Intermediate wave (B) is a complete zigzag. Because intermediate wave (A) was a leading diagonal it is likely that intermediate wave (C) will subdivide as an impulse to exhibit structural alternation. If this intermediate wave up is intermediate wave (3) it may only subdivide as an impulse.
At 1,320 intermediate wave (C) would reach equality in length with intermediate wave (A), and would probably end at the upper edge of the maroon channel. At 1,429 intermediate wave (C) or (3) would reach 1.618 the length of intermediate wave (A) or (1). If this target is met it would most likely be by a third wave and primary wave A would most likely be subdividing as a five wave impulse.
Within intermediate wave (C) minor wave 2 is seen for this first wave count as an expanded flat correction. These are very common structures. It may not move beyond the start of minor wave 1 below 1,142.82.
Within minor wave 2 expanded flat minute wave c must subdivide as a five wave structure.
Pros:
1. Expanded flat corrections are very common structures.
2. Minute wave b up looks like a three on the daily chart.
Cons:
1. Within minute wave c subminuette wave ii is showing up on the daily chart, which is unusual for Gold.
2. Within minute wave c subminuette wave ii has lasted 2 days on the daily chart, which is longer than minuette wave (i) one degree higher. It should be quicker, not longer.
3. Subminuette wave ii breaches a base channel drawn about minuette waves (i) and (ii) one degree higher (this is drawn on the hourly chart below).
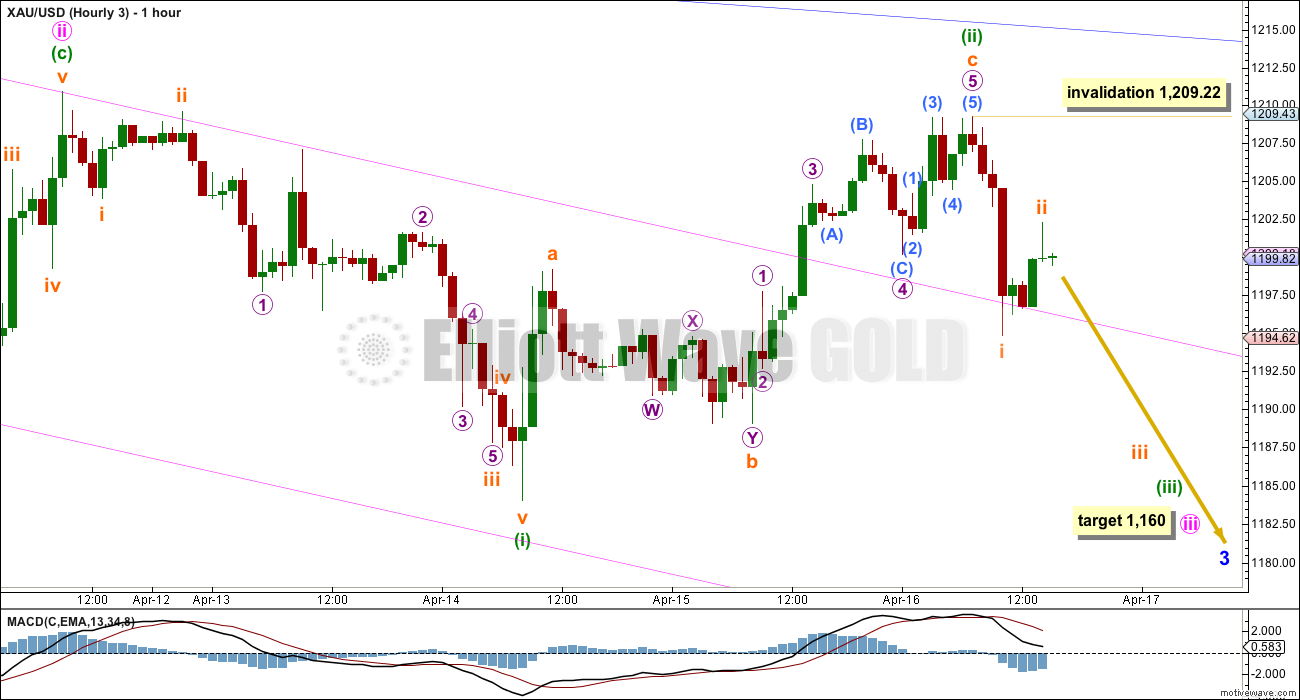
Within minuette wave (iii) no second wave correction may move beyond its start above 1,209.22.
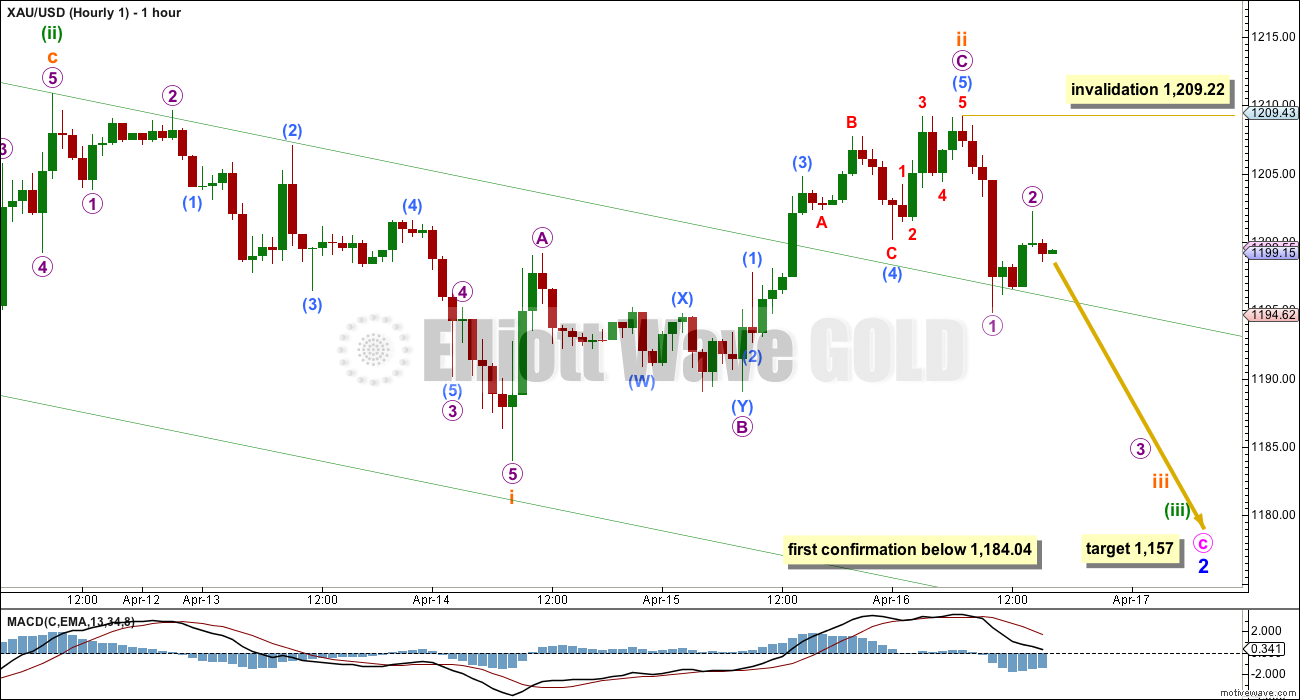
The green channel is a base channel drawn about minuette waves (i) and (ii). Subminuette wave ii clearly breaches this channel. Sometimes this happens, but more commonly a lower degree second wave should find support or resistance at a base channel drawn about a higher degree wave. This breach of the base channel indicates this wave count may be wrong.
So far within minute wave c down there may now be three first and second waves complete. This indicates a strong and imminent increase in downwards momentum.
Subminuette wave ii completed as a zigzag. Within it (and this is seen in the same way for wave counts 1 and 3) there is an expanded flat for submicro wave (4). Looking at minuscule wave B on the five minute chart, this movement fits better as a five wave impulse than a three wave zigzag, and this wave count must see it as a three wave zigzag.
At 1,157 minute wave c would reach 1.618 the length of minute wave a.
Micro wave 2 may not move beyond the start of micro wave 1 above 1,209.22.
A new low below 1,184.04 would invalidate wave count #2.
Wave Count #2
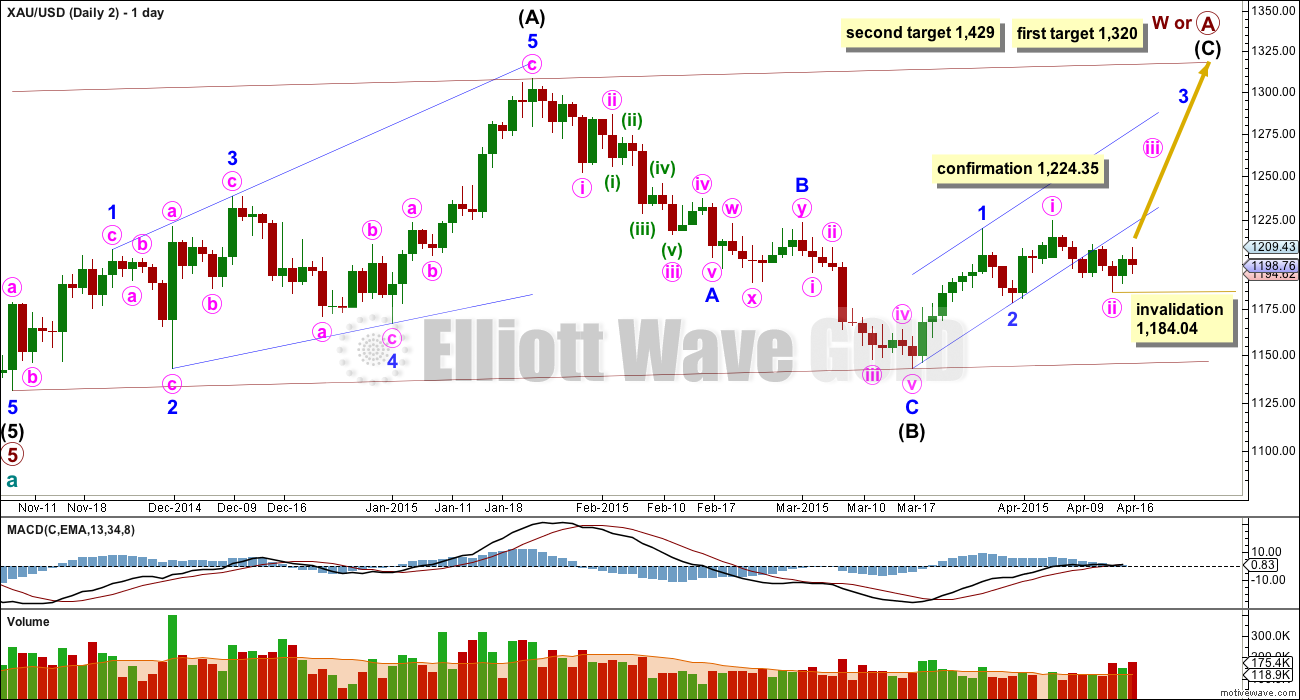
This wave count is identical to wave count #1 up to the high labelled minor wave 1. Thereafter, instead of minor wave 2 continuing it sees minor wave 2 as complete, and now within minor wave 3 minute waves i and ii complete.
Pros:
1. Minute wave ii looks like a clear three wave movement now on the daily chart.
2. Minor wave 3 should show its corrections for minute waves ii and iv clearly on the daily chart.
3. The most recent movement up to Thursday’s high subdivides best as a five wave structure on the hourly chart.
Cons:
1. Minute wave ii clearly and strongly breaches the lower edge of a base channel drawn about minor waves 1 and 2, one degree higher.
2. Minute wave ii is twice the duration of minor wave 2 one degree higher.
Within minute wave iii no second wave correction may move beyond its start below 1,184.04. I am moving this invalidation point up today because I struggle to accept the possibility that minute wave ii could continue, as it is already twice the duration of minor wave 2.
A new high above 1,209.22 would invalidate wave counts 1 and 3. A new high above 1,224.35 would invalidate wave count 4.
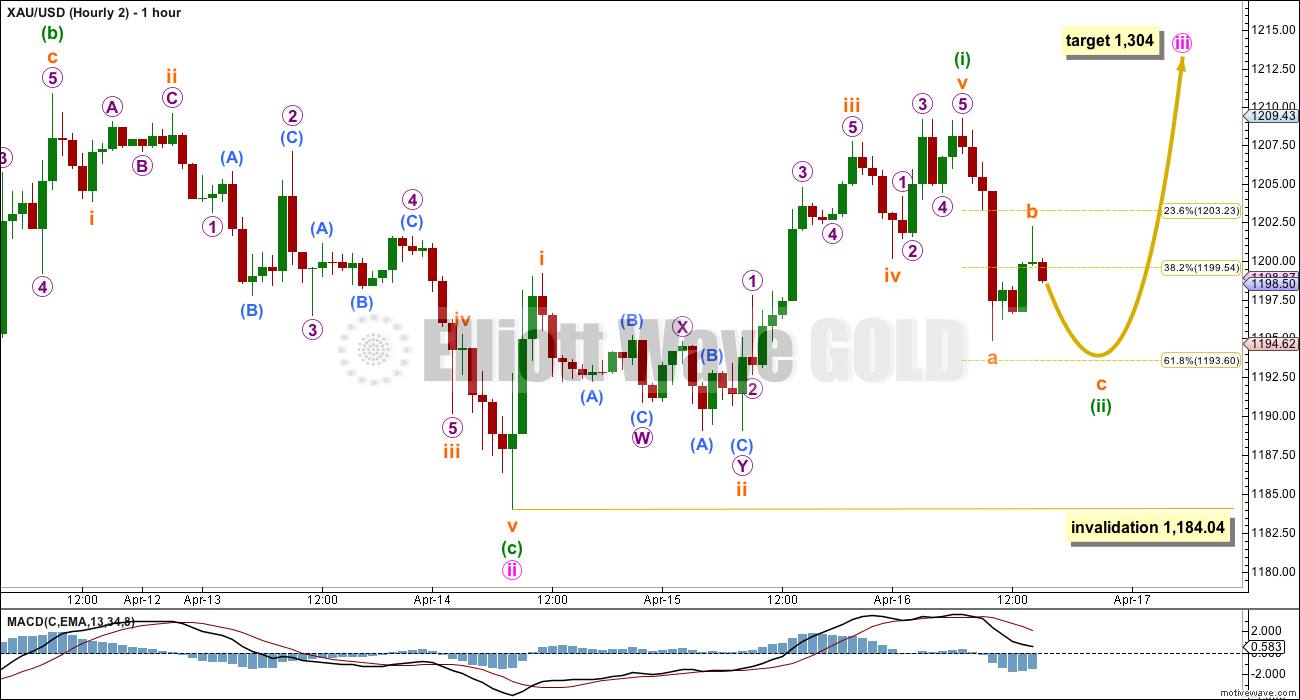
If minute wave ii is over then minute wave iii up should show a strong increase in momentum. At 1,304 minute wave iii would reach 1.618 the length of minute wave i.
Within minute wave iii minuette waves (i) and (ii) are now more likely over (this part of the wave count is changed slightly today). Minuette wave (i) subdivides nicely as a five wave impulse on the hourly chart. Minuette wave (ii) is incomplete and may end about the 0.618 Fiboancci ratio of minuette wave (i) about 1,194.
Minuette wave (ii) may not move beyond the start of minuette wave (i) below 1,184.04.
Wave Count #3
So far within intermediate wave (3) minor waves 1 and now 2 should be over.
At 1,059 minor wave 3 would reach equality in length with minor wave 1. Minor wave 1 is extended, and this target would see minor wave 3 also extended. A short fifth wave would be expected to follow.
I am moving the invalidation point slightly lower for this wave count. Within minor wave 3 minute wave ii and now also minuette wave (ii) must be over. Within the middle of this third wave no second wave correction may move beyond its start above 1,209.22.
This wave count expects a strong increase in downwards momentum.
Pros:
1. It is extremely common for third waves to begin with a series of overlapping first and second wave corrections.
Cons:
1. Within minor wave 1 there is gross disproportion between minute waves iv and ii: minute wave iv is more than thirteen times the duration of minute wave ii giving minor wave 1 a three wave look.
2. On the hourly chart minuette wave (ii) breaches the upper edge of a base channel drawn about minute waves i and ii, one degree higher.
A new low below 1,178.59 would invalidate wave count 2. A new low below 1,142.82 would invalidate wave count 1.
Within minute wave iii minuette waves (i) and now (ii) are complete. Minuette wave (ii) breaches the upper edge of a base channel drawn about minute waves i and ii, one degree higher.
This wave count now expects a very strong and imminent increase in downwards momentum as a third wave at 4 degrees begins.
At 1,160 minute wave iii would reach 1.618 the length of minute wave i.
Subminuette wave ii may not move beyond the start of subminuette wave i above 1,209.22.
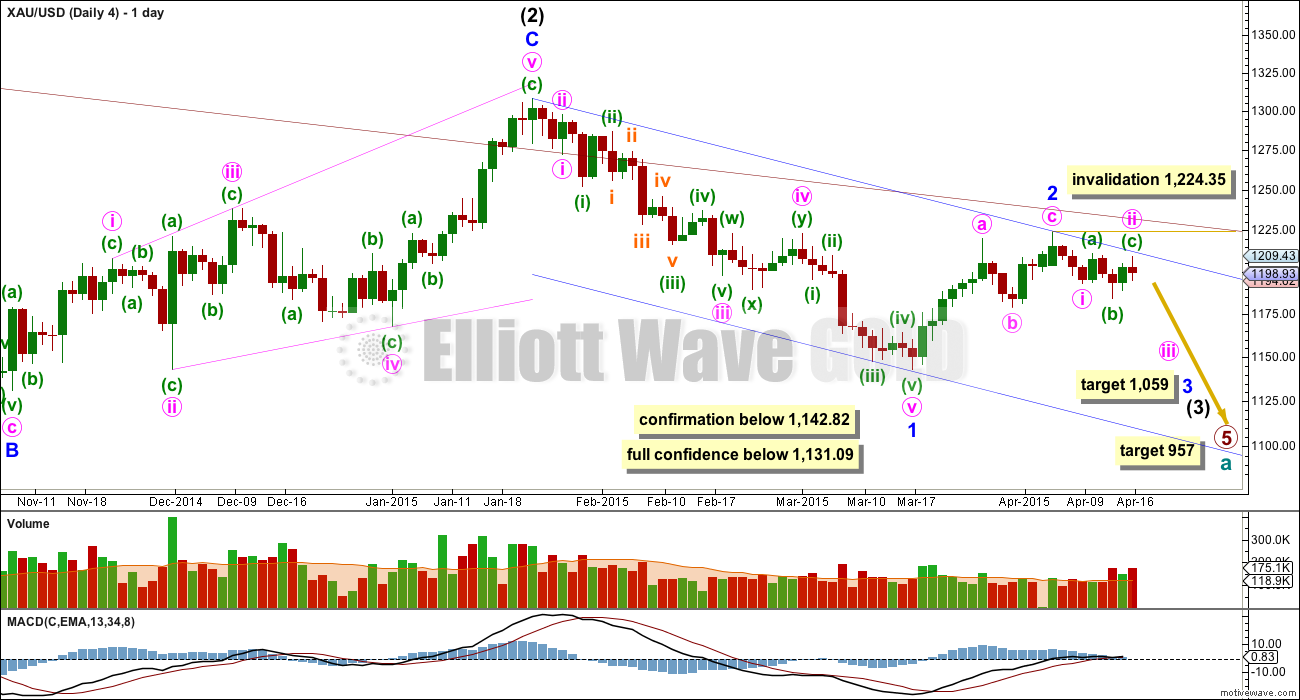
Wave Count #4
This wave count is identical to wave count 3 up to the low labelled minute wave i within minor wave 3 down.
Minute wave ii may not be over and may be continuing as a very common expanded flat correction. The problem of the breach of the base channel about minute waves i and ii for wave count 3 is resolved.
Pros:
1. Price remains within the base channel about minor waves 1 and 2.
2. The proportion of minute wave ii looks right.
3. The last upwards movement labelled minuette wave (c) fits best as a five wave impulse on the hourly chart.
4. Upwards movement continues to remain within the base channel drawn about minor waves 1 and 2.
Cons:
1. Within minor wave 1 there is gross disproportion between minute waves iv and ii: minute wave iv is more than thirteen times the duration of minute wave ii giving minor wave 1 a three wave look.
2. Minute wave ii has completed as a rare running flat: minuette wave (c) did not manage to move beyond the end of minuette wave (a) by a small margin of 1.66. This is only a small detraction though, this is a second wave within a third wave two degrees higher, which is the kind of situation a running flat may appear in.
If it were to continue as a double flat or combination, then minute wave ii may not move above the start of minute wave i above 1,224.35.
At 1,059 minor wave 3 would reach equality in length with minor wave 1.
Minute wave ii did not complete as an expanded flat, as expected, and instead subdivides as a running flat. However, the subdivisions fit perfectly and the truncation is small. This is acceptable.
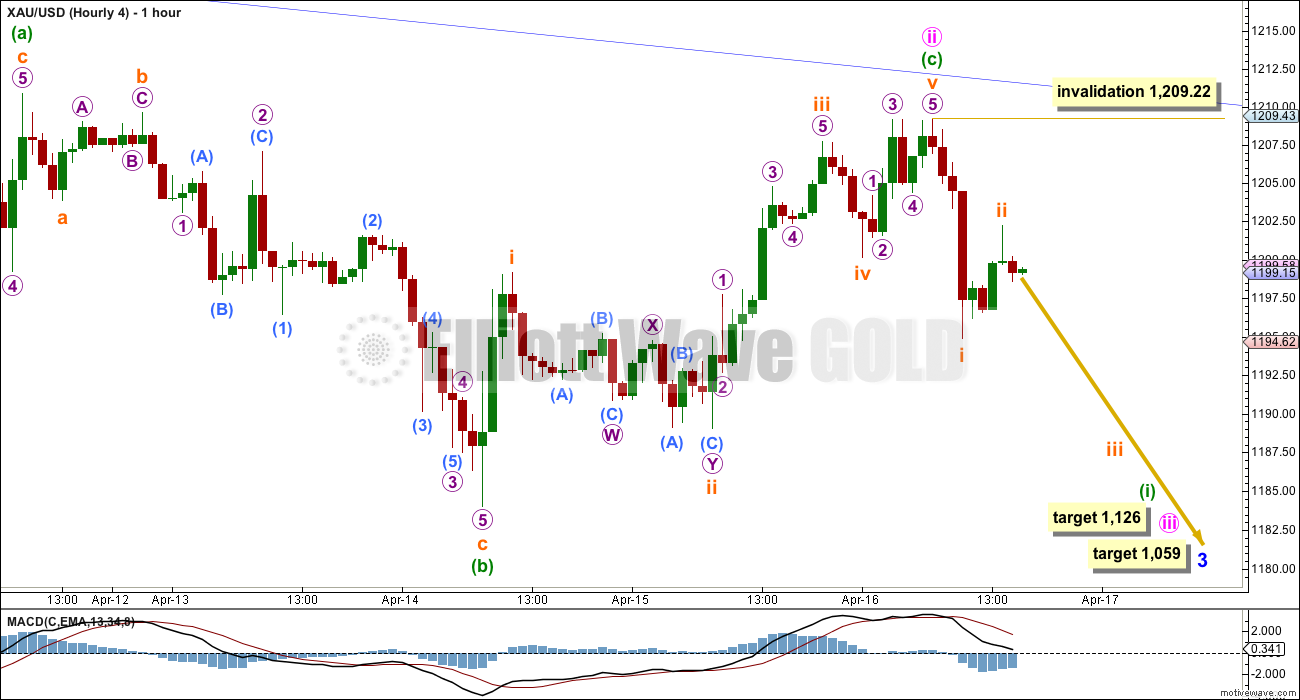
Upwards movement for minuette wave (c) ended just short of the blue base channel copied over here to the hourly chart.
This wave count now expects a reasonable increase in downwards momentum, and a continuing increase in volume for down days. Within minute wave iii of minor wave 3 this wave count sees the first wave, minuette wave (i), as most likely incomplete.
Within minuette wave (i) subminuette wave ii may not move beyond the start of subminuette wave i above 1,209.22.
At 1,126 minute wave iii would reach 2.618 the length of minute wave i.
This fits nicely with the lower target for minor wave 3 to reach equality in length with minor wave 1 at 1,059.
For this wave count the downwards structure of minuette wave (i) must be a five. It cannot be a three because minute wave iii may only subdivide as an impulse.
If I had to pick a winner it would still be wave count 4. However, it has too many problems for me to have confidence in it. I would wait for price to indicate which count is correct.
This analysis is published about 04:39 p.m. EST.

**Off Topic** Hoping for some advice from anyone who does or has traded the Vix via Tvix.
My understanding that this should double vix performance. This appears absolutely NOT the case and I cannot see why.
Can anyone explain to me please.
I have traded it in the past but had a similar frustration so I just stay away from it now. Not sure why it behaves that way, I think it has a reputation for what you are describing.
Thanks MTLSD, very strange indeed. I believe we are hitting a treble top in the dow and DAX has fallen away significantly this week so I will hold for now.
I will make this my last investment on this though.
I almost always lose playing tvix…bad thing to be in–sometimes I try vxx, but it doesn’t really follow the vix very well…metals are easier to play…
The best to play is XIV short VIX. When ever VIX gets up to above 20 -25 buy xiv and sell when vix is below 13 or 12.
TVIX and UVXY are not good. Mostly the reason is that market goes down in impulses and too volatile and not easy to catch for best risk/reward position.
Papudi, I fully agree with this assessment in a bull market…its the trend change that is really dangerous on these products…but, in the past, I have been a regular in xiv and svxy…gl and careful trading these…
I was trading TVIX a few years ago when Credit Suisse started manipulating it. I think UVXY is a better etf, but as others have stated, they both have severe tracking issues. I no longer trade them.
http://www.zerohedge.com/news/tvix-debacle
Vix and More blog is a good source if you want more info
http://vixandmore.blogspot.com/2012/02/all-about-uvxy.html
Dollar rises along with Greek-default fears (and worldwide stocks selloff)-
Apr 17, 2015 10:56 a.m. ET
The U.S. dollar inched higher against its main rivals Friday, snapping three sessions of losses, as fears of a Greek default drove the dollar higher. The dollar’s strength was part of a broader trend of investors dumping risk assets like stocks, Galy said. Stocks traded lower around the world, and emerging-market currencies like the Mexican peso MXNUSD, -0.98% sold off, as investors sought the perceived safety of the U.S. dollar and the Swiss franc EURCHF, -0.11%
http://www.marketwatch.com/story/dollar-trapped-in-tight-ranges-as-investors-hunt-for-directional-clues-2015-04-17
Gold had plenty of opportunity to sell off big after the CPI release. The fact that it didn’t speaks volumes about exhausted selling pressure and is also consistent with the strength we’ve been since seeing in the miners (GDX). Looks like the bullish flag will print a breakout on the daily gold chart today as well. I’m just getting my feet wet at incorporating EW into my trading decisions but it strikes me that since at any time there are several possible wave counts in play, you really need to consider some non-EW factors to help determine which wave counts have the best odds. Perhaps I’m just showing my EW ignorance but that’s my take so far…..
Mark F , I was surprised that CPI numbers didn’t have gold dropping after the open. Not sure but could options expiry today have something to do with gold being range bound.
By using your own trading knowledge for extra clarity. You are doing what Lara recommends.
“Members should use their own preferred technical analysis tools to judge for themselves which wave count they can use as a road map for the immediate future. One by one price will invalidate wave counts until we have one left.”
Thanks Richard. It sounds like I’m applying Lara’s service appropriately then 😉 If you subscribe to the theory that options max pain is influencing price today then you’d have to believe that the effect of options is holding gold and miners back (especially the miners!), not levitating prices. Max pain is as follows for today: GLD $115.50, GDX $19.00, NUGT $11.00, JNUG $18.50. We could be really set to explode to the upside next week.
I agree. GDX has over 20K contracts of open interest at $20, so likely we stay under that or close to it.
I’ll be back Monday.
The best way to use my EW analysis is as one tool in your tool kit for decision making. Doing your own TA is strongly advised. If your analysis is in line with mine, then you may have more confidence in the expected direction. If your analysis contradicts mine then it’s up to each individual member to determine how to approach the market.
I’ve always advised members to use my analysis in this way. I expect many members use my EW analysis because it is complicated to learn and time consuming to do daily, so I’m saving them time and giving them EW analysis which will follow all EW rules.
Lara, I am totally onboard and am applying your analysis exactly as you have prescribed. I was considering trying to learn even just the basics about EW and have decided “what’s the point?”. I will never reach your level of mastery so instead I will do what I do best and use your analysis as another arrow in the quiver to inform my thinking. Thanks for all the hard work!
Mark F
You may want to consider learning a few of the basics of EW such as retrace .618 and the 5 wave count and the patterns in which the 1,3 5 wave move up and 2 and 4 waves moves down as it helps to know what may be coming and also possible bottom and top area targets. Also good to know the names of the different time frames see Lara main page for short chart of WAVE NOTATION.
I find those basics helpful and I leave the complex stuff like making charts and doing exact counts, while following the hundreds of rules up to Lara.
Gary Wagner Elliottician at Kitco and the gold forecast.com said it takes years to learn EW and a lifetime to master it.
Seeing many so called experts chart EW and then Lara analyzing their many errors I won’t invest the years, however the essentials are worthwhile and they are available for free on-line.
All good advice. Thanks guys.
I would recommend you print out my “wave notation” (right hand side bar) guide in colour and learn the colours and names and notations. That will make reading the charts easier.
I have education videos on this site to teach you some basics. Start there.
If you watch those through, maybe once a week for a few weeks, you’ll know enough to help you figure out what’s happening between published analysis here. It will all also make more sense.
I agree that trying to master it yourself, if you don’t want to that is, is probably not necessary. It’s taken me 7 years of doing this daily now, and as you’ve seen I still get it wrong.
Your charts are great and I enjoy looking at them. Lara’s EW analysis has given me more confidence and then I trade of the charts and momentum oscillators. Since last two weeks it has been sidaway movement so I am like some on the side line for till gold resolves itself on the direction. Once it happens up/down it will be fun.
Patience !!!!!
Options expire today
http://www.marketwatch.com/optionscenter/calendar
If you take a look at 4 hour gold chart price has moved sideways between 1210 and 1190.
A DZZ may be ?????? with a bullish candle for upside bias.
If the triangle idea is still valid (see Bob’s post below), we will need to see a spike below $1194 relatively quickly to complete structure. Maybe the CPI data gives us that spike. Since I’m long, a direct spike above $1211 would work too. I believe the USD has started a multi-week correction which should be a tailwind for gold. I just don’t know if it reverses at $1245ish for Minor 2. If it’s a triangle, we know it must be corrective. Let’s see how it plays out first.
I am just thinking; if 1209-11 does not hold gold price down, a pop through would likely test 1214-15….
USD Making a Reversal At top in Weekly With Bearish Engulfing Candle…..
so if dollar is reversing then.. Gold can continue its bull run…
Bullish sentiment on USD is at an extreme which could lead to a bigger correction.
http://blog.kimblechartingsolutions.com/2015/04/king-dollar-investors-establish-most-crowded-trade-in-history/
US data disappoints dollar bulls again, euro shrugs off Greece concerns –
http://www.cnbc.com/id/102595296
It’s all about inflation Friday 8:30 am April 17th – Friday’s March CPI consumer price index is more important than usual since it is one piece of data that traders say could change their assumptions on Fed policy.
http://www.cnbc.com/id/102594725
A VIEW: Gold price set-up is a horrible one and more or less at a dead end!…. With the bands having narrowed, something must give; a cycle turn window is in play…. Gold price remains bottomy. Expecting choppy overlapping price movement similar to what we saw on Thursday and expecting upside to remain restricted to 1206-08; it is the downside break below 1196 that’s required! Aarrgghh //// I am just wondering, what if gold price has an inside day today, or will it not?
CPI #s at 0830 EST, 1 hour before us open…I’m expecting it to be a mover…again, hard to predict…
Hello Victor: Yes it s hard to predict. Gold price is being a real witch! Bearish Two Crows are signaling a possible trend reversal…. Gold price is bullish but with a bearish momentum, bearish ROC and bearish Stochastic; I am inclined to pick the downside…. Can expect similar price movement like yesterday where it went 1199>>1209<>1206-08<<1196 and lower lol…. Lets see what happens.
Nice call on the inside day.
From a non-EW person’s perspective, wave count #2 is the only one that seems to align with the action in the GDX which is decidedly bullish. I’m not sure how to otherwise reconcile such a huge disconnect between gold and the GDX. Every other wave count seemingly contradicts the GDX bullish demeanor. GDX has broken TL resistance and is now using 50ema as support with a bullish underlying structure and volume pattern.
Yes, the miners are acting more bullish than the metals. That could be the miners leading a future advance in the metals or it could mean the miners are responding to other factors that would not be expressed in the gold price (e.g., lower oil price means lower costs for miners, and improved efficiencies in miners over past 2 years could be finally reflected in prices).
A report on Gold and silver EW by Ron Rosen. His count for both G/S is that wave c of running flat has just ended and bull trend is about to begin.
Is Rosen’s EW count for running flat grossly incorrect according to EWP guidelines and rules?
The wave b (from 681 to 1923) of running flat is lot more than 138% of wave a (1000 to 681).
http://www.321gold.com/editorials/rosen/rosen041615.pdf
That wave count has some problems I can see.
Wave B is 3.51 times the length of wave A. Wave C is truncated by 448.68. It does not even move back into wave A price territory.
I’m pretty sure wave C needs to move back into wave A price territory. Such a large truncation is… exceptionally unusual.
B waves within flats aren’t usually more than twice the length of A waves. 3.5 times the length of the A wave… highly unusual.
B doesn’t subdivide very well as a three.
Within the five for wave C wave 1 looks like a three, it should be a five. The triangle for the fourth wave is ignored.
I do not think that is a valid wave count for the above reasons.
Thanks Lara. Good learning for me.
Gold Triangle idea update
If this is a running contracting triangle, it will act like wave count #2 in the very short term before reversing near $1245ish or 61.8% retrace of $1308-$1142.. I think it has a really good look on the daily chart as they all look like 3’s. The breakout should be relatively soon.
I’ve got 4:1 odds on wave count #2.
If it’s a triangle then d wave subwaves are not in three wave structure, d wave should end between 1208.8 and 1224.
That’s a really good wave count Bob. I’ll keep an eye on it. My only concern is it may need another breach of that maroon channel when the triangle is complete and the C wave breaks out upwards out of it.
It would fit for wave counts 3 or 4, except it sees minor 2 incomplete.