All four Elliott wave counts remain valid. The most recent movement has a better fit in terms of structure for Elliott wave counts 2 and 4.
Members should use their own preferred technical analysis tools to judge for themselves which wave count they can use as a road map for the immediate future. One by one price will invalidate wave counts until we have one left.
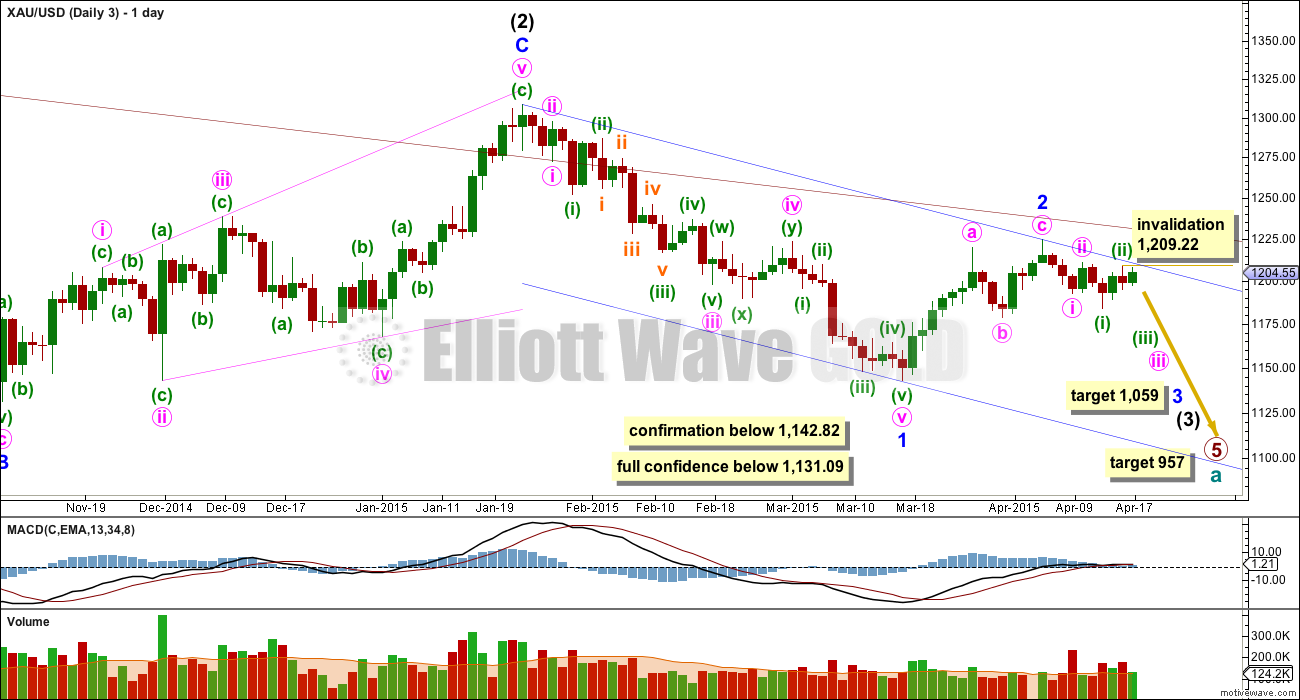
Summary: Gold is in a sideways consolidation phase which began on March 27th. Since price entered the consolidation phase the strongest volume is on down days, indicating that when the breakout comes it may be more likely to be down. Volume towards the end of this week is declining, which often happens towards the end of a consolidation phase. However, the Elliott wave picture remains remarkably unclear. While price remains below 1,209.43 and above 1,178.59 multiple wave counts will remain valid. The very short term still sees all wave counts expecting at least some downwards movement.
Click on charts to enlarge.
To see weekly charts for bull and bear wave counts go here. Wave counts 1 and 2 follow the weekly bull count, wave counts 3 and 4 follow the weekly bear count.
Wave Count #1
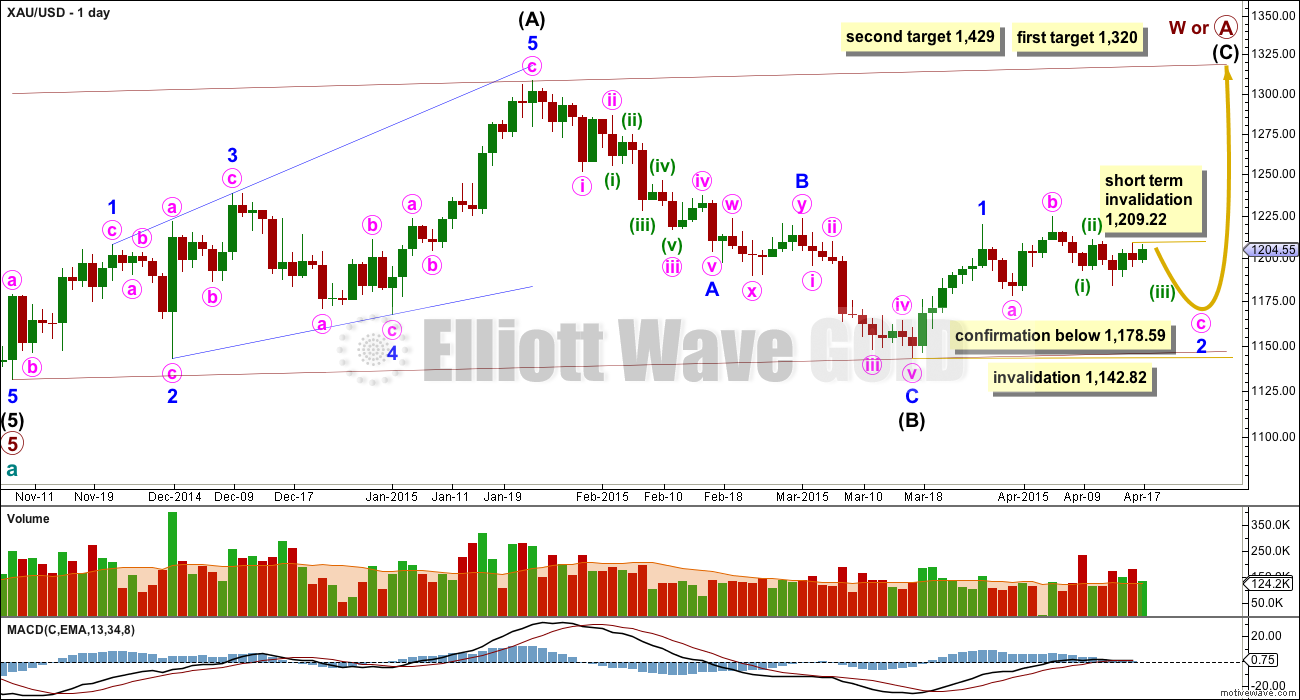
So far within cycle wave b there is a 5-3 and an incomplete 5 up. This may be intermediate waves (A)-(B)-(C) for a zigzag for primary wave A, or may also be intermediate waves (1)-(2)-(3) for an impulse for primary wave A. Within cycle wave b primary wave A may be either a three or a five wave structure.
Intermediate wave (A) subdivides only as a five. I cannot see a solution where this movement subdivides as a three and meets all Elliott wave rules. This means that intermediate wave (B) may not move beyond the start of intermediate wave (A) below 1,131.09. Intermediate wave (B) is a complete zigzag. Because intermediate wave (A) was a leading diagonal it is likely that intermediate wave (C) will subdivide as an impulse to exhibit structural alternation. If this intermediate wave up is intermediate wave (3) it may only subdivide as an impulse.
At 1,320 intermediate wave (C) would reach equality in length with intermediate wave (A), and would probably end at the upper edge of the maroon channel. At 1,429 intermediate wave (C) or (3) would reach 1.618 the length of intermediate wave (A) or (1). If this target is met it would most likely be by a third wave and primary wave A would most likely be subdividing as a five wave impulse.
Within intermediate wave (C) minor wave 2 is seen for this first wave count as an expanded flat correction. These are very common structures. It may not move beyond the start of minor wave 1 below 1,142.82.
Within minor wave 2 expanded flat minute wave c must subdivide as a five wave structure.
Pros:
1. Expanded flat corrections are very common structures.
2. Minute wave b up looks like a three on the daily chart.
Cons:
1. Within minute wave c subminuette wave ii is showing up on the daily chart, which is unusual for Gold.
2. Within minute wave c subminuette wave ii has lasted 2 days on the daily chart, which is longer than minuette wave (i) one degree higher. It should be quicker, not longer.
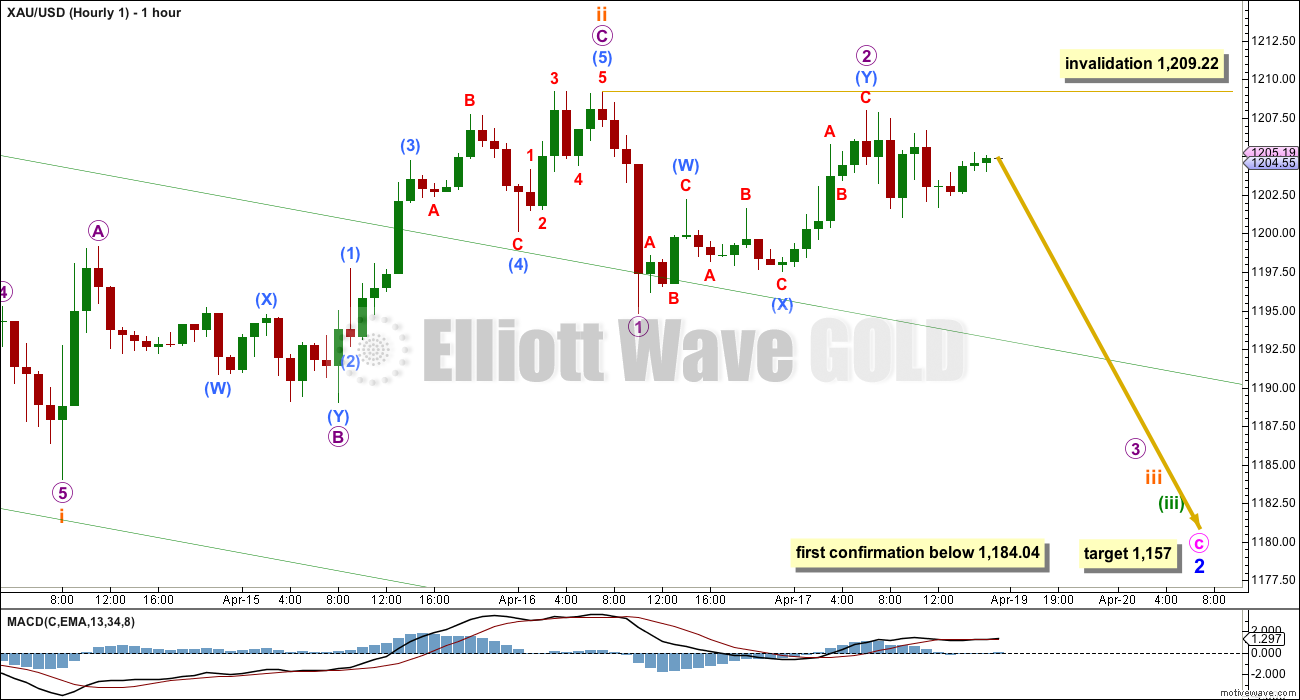
3. Subminuette wave ii breaches a base channel drawn about minuette waves (i) and (ii) one degree higher (this is drawn on the hourly chart below).
4. Micro wave 2 shows up as a green candlestick on the daily chart. It is unusual for a low degree wave within a smaller movement to do this for Gold.
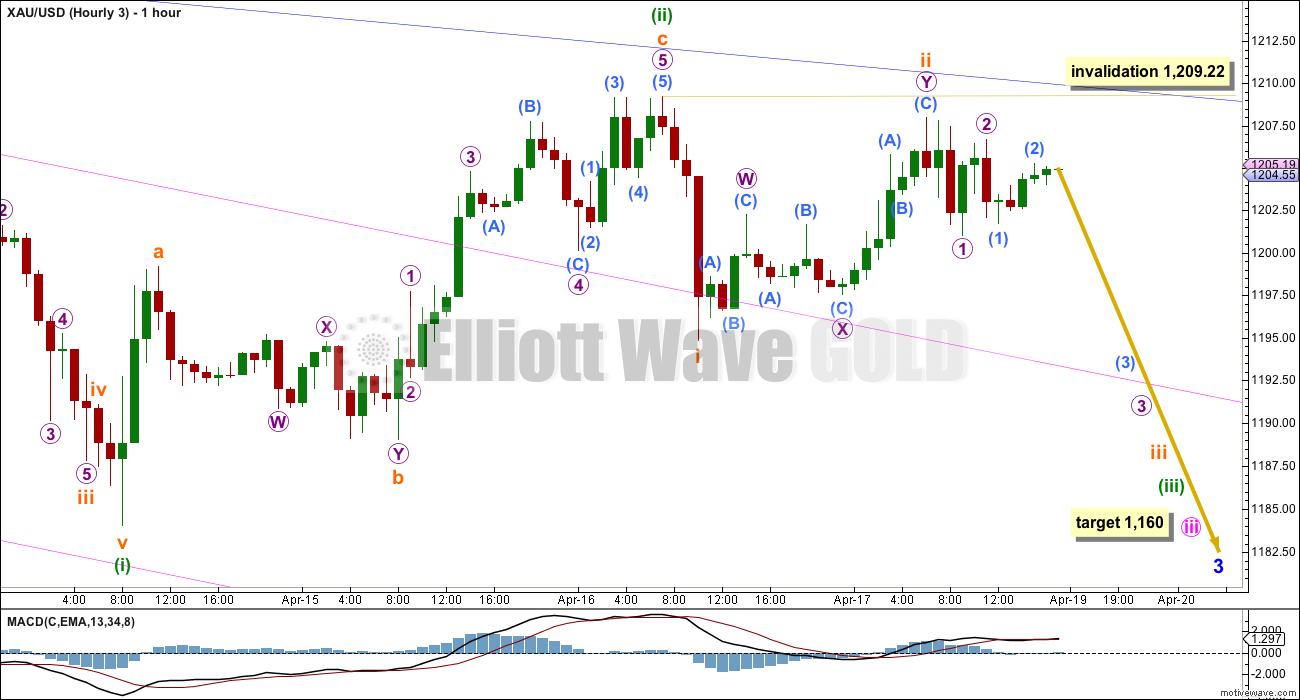
Within minuette wave (iii) no second wave correction may move beyond its start above 1,209.22.
The green channel is a base channel drawn about minuette waves (i) and (ii). Subminuette wave ii clearly breaches this channel. Sometimes this happens, but more commonly a lower degree second wave should find support or resistance at a base channel drawn about a higher degree wave. This breach of the base channel indicates this wave count may be wrong.
So far within minute wave c down there may now be three first and second waves complete. This indicates a strong and imminent increase in downwards momentum.
Subminuette wave ii completed as a zigzag. Within it (and this is seen in the same way for wave counts 1 and 3) there is an expanded flat for submicro wave (4). Looking at minuscule wave B on the five minute chart, this movement fits better as a five wave impulse than a three wave zigzag, and this wave count must see it as a three wave zigzag.
At 1,157 minute wave c would reach 1.618 the length of minute wave a.
Micro wave 2 may not move beyond the start of micro wave 1 above 1,209.22.
A new low below 1,184.04 would invalidate wave count #2.
Wave Count #2
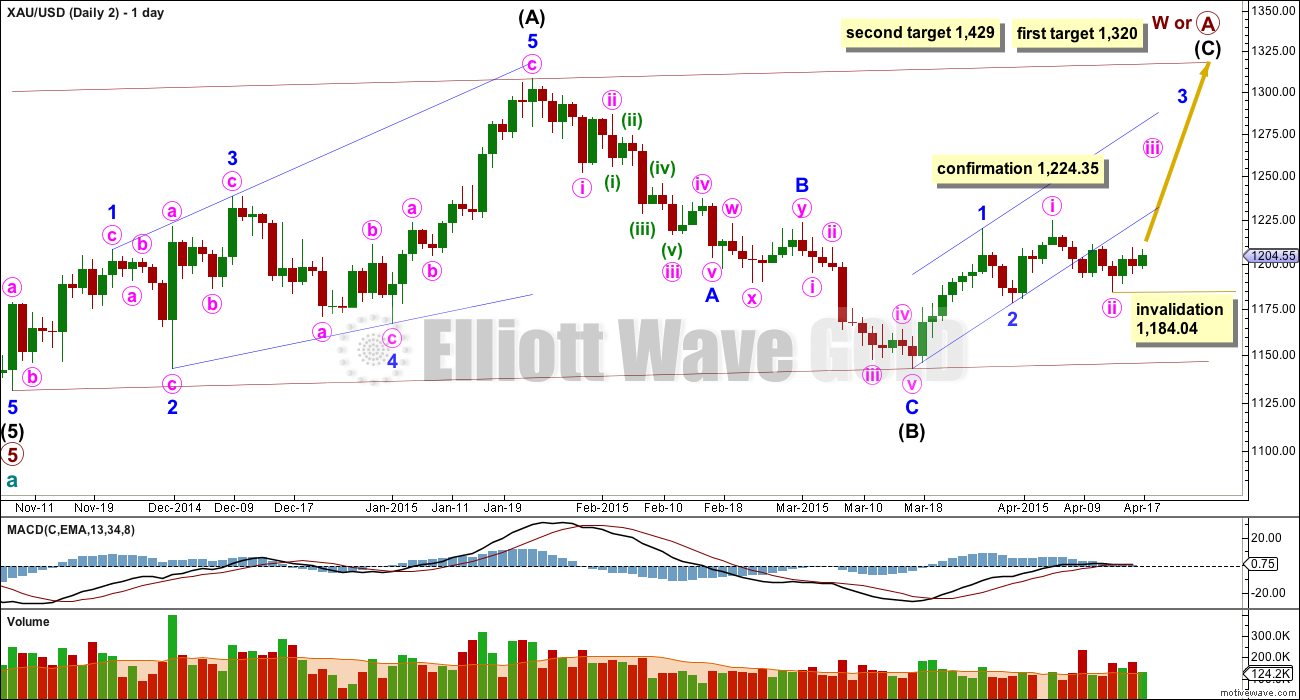
This wave count is identical to wave count #1 up to the high labelled minor wave 1. Thereafter, instead of minor wave 2 continuing it sees minor wave 2 as complete, and now within minor wave 3 minute waves i and ii complete.
Pros:
1. Minute wave ii looks like a clear three wave movement now on the daily chart.
2. Minor wave 3 should show its corrections for minute waves ii and iv clearly on the daily chart.
3. The most recent movement up to Thursday’s high subdivides best as a five wave structure on the hourly chart.
Cons:
1. Minute wave ii clearly and strongly breaches the lower edge of a base channel drawn about minor waves 1 and 2, one degree higher.
2. Minute wave ii is twice the duration of minor wave 2 one degree higher.
3. The upwards wave of minute wave i looks like a three on the daily chart, but it should be a five.
Within minute wave iii no second wave correction may move beyond its start below 1,184.04.
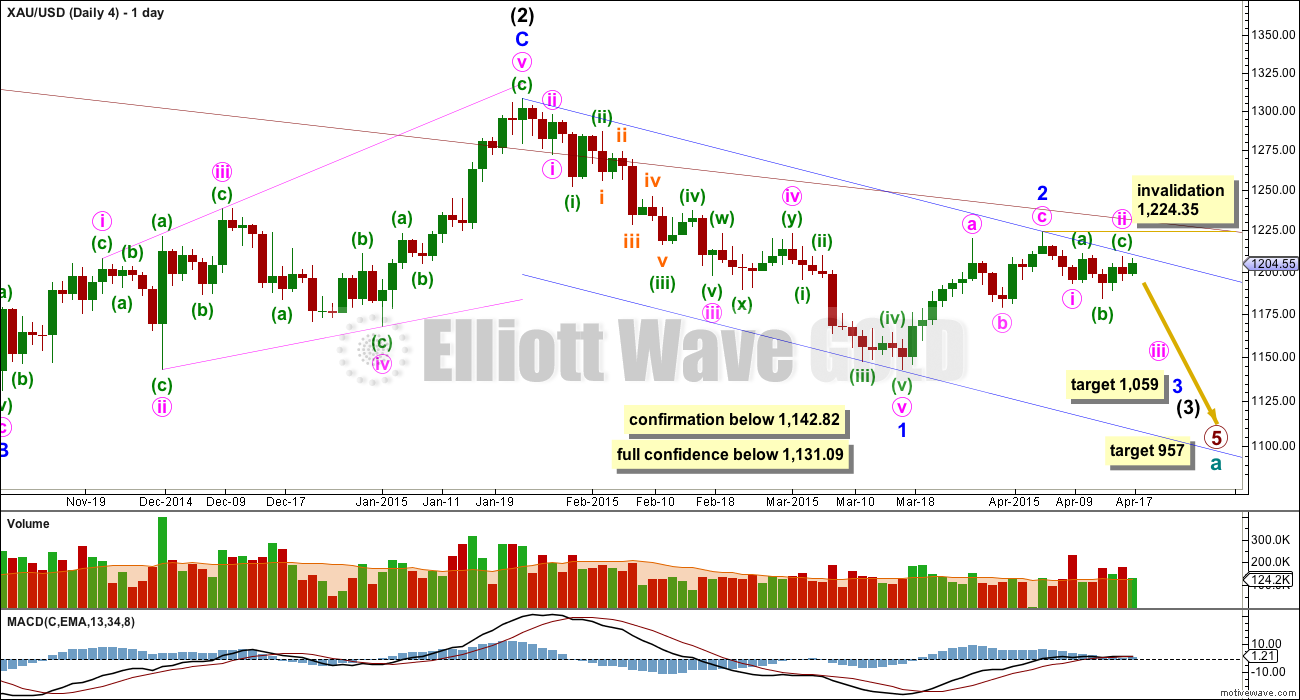
A new high above 1,209.22 would invalidate wave counts 1 and 3. A new high above 1,224.35 would fully invalidate wave count 4.
At 1,304 minute wave iii would reach 2.618 the length of minute wave i.
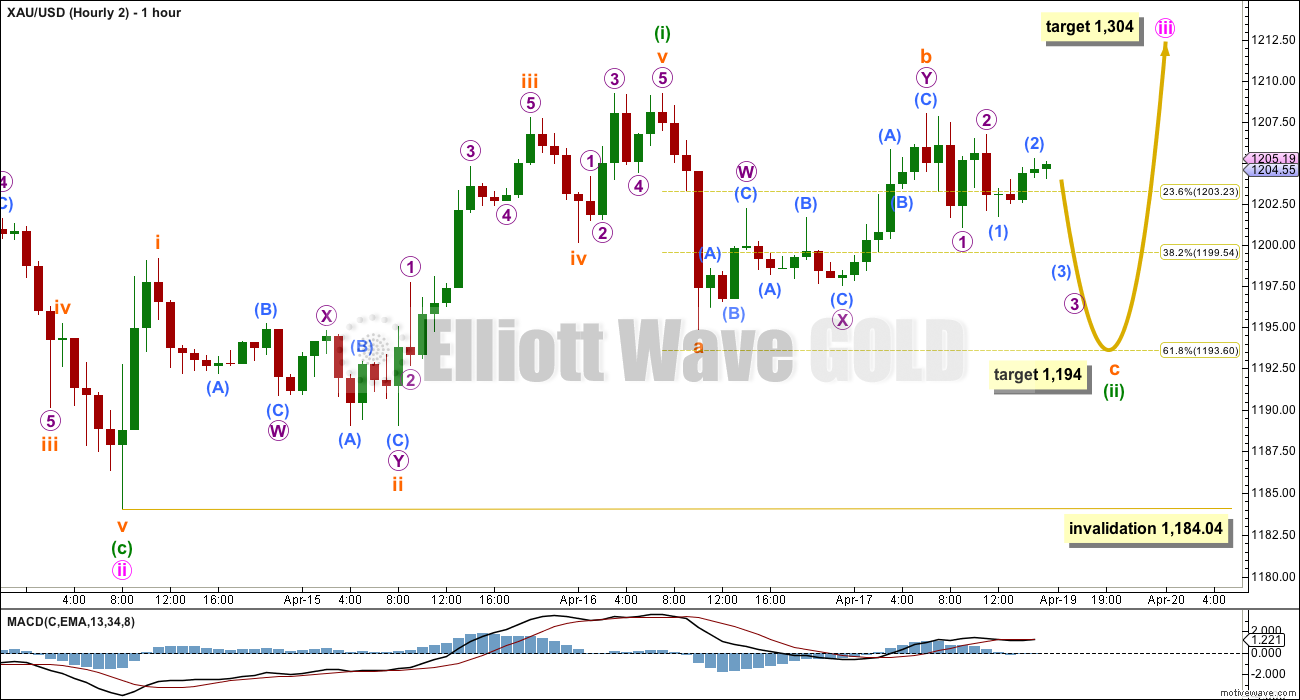
Minuette wave (ii) is still incomplete. Upwards movement for Friday’s session may have been a continuation of subminuette wave b as a double zigzag. At 1,194 subminuette wave c would reach equality in length with subminuette wave a, and minuette wave (ii) would end at the 0.618 Fibonacci ratio of minuette wave (i).
Minuette wave (ii) may not move beyond the start of minuette wave (i) below 1,184.04.
When minuette wave (ii) is a complete corrective structure then this wave count expects to see a strong increase in upwards momentum as the middle of a third wave begins.
Wave Count #3
This wave count follows the bear weekly count which sees primary wave 5 within cycle wave a as incomplete. At 957 primary wave 5 would reach equality in length with primary wave 1.
So far within intermediate wave (3) minor waves 1 and now 2 should be over.
At 1,059 minor wave 3 would reach equality in length with minor wave 1. Minor wave 1 is extended, and this target would see minor wave 3 also extended. A short fifth wave would be expected to follow.
Within minor wave 3 minute wave ii and minuette wave (ii) must be over for this wave count. Within the middle of this third wave no second wave correction may move beyond its start above 1,209.22.
This wave count expects a strong increase in downwards momentum.
Pros:
1. It is extremely common for third waves to begin with a series of overlapping first and second wave corrections.
Cons:
1. Within minor wave 1 there is gross disproportion between minute waves iv and ii: minute wave iv is more than thirteen times the duration of minute wave ii giving minor wave 1 a three wave look.
2. On the hourly chart minuette wave (ii) breaches the upper edge of a base channel drawn about minute waves i and ii, one degree higher.
A new low below 1,184.04 would invalidate wave count 2. A new low below 1,142.82 would invalidate wave count 1.
Within minute wave iii minuette waves (i) and now (ii) are complete. Minuette wave (ii) breaches the upper edge of a base channel drawn about minute waves i and ii, one degree higher.
This wave count now expects a very strong and imminent increase in downwards momentum as a third wave at 5 degrees begins.
At 1,160 minute wave iii would reach 1.618 the length of minute wave i.
Subminuette wave ii moved higher on Friday as a double zigzag. It may not move beyond the start of subminuette wave i above 1,209.22.
Wave Count #4
This wave count is identical to wave count 3 up to the low labelled minute wave i within minor wave 3 down.
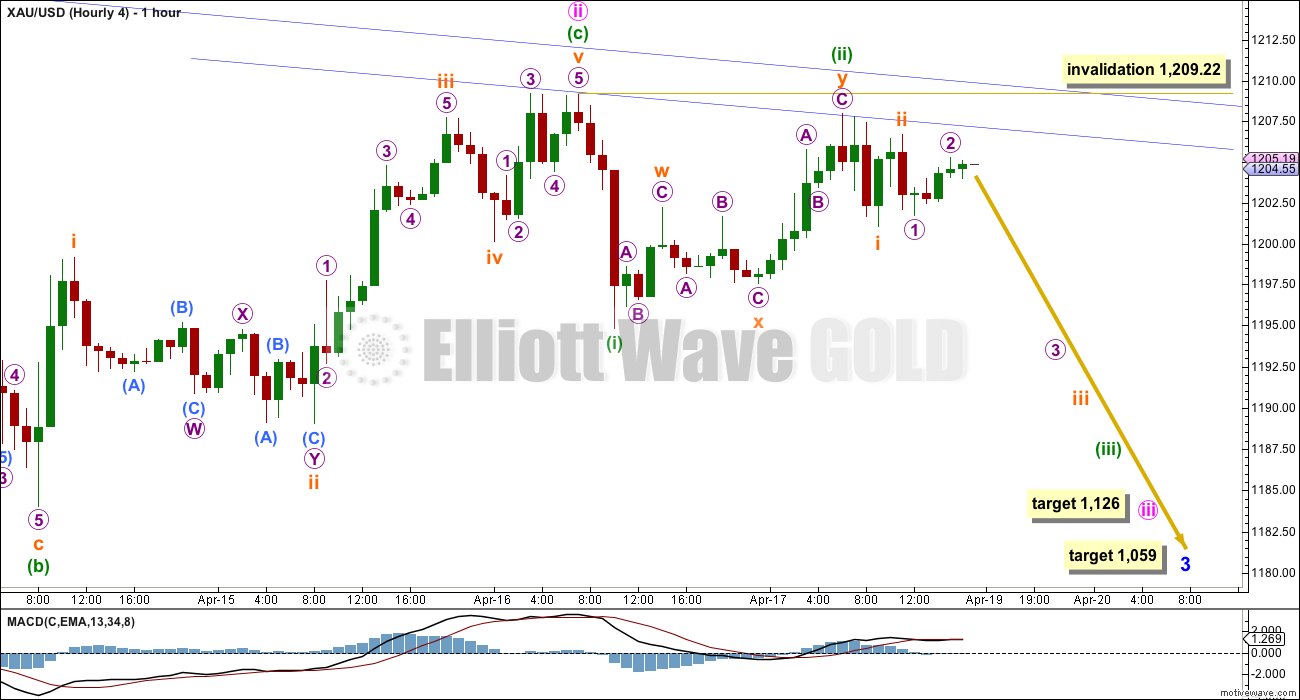
Minute wave ii may have completed as a rare running flat correction. The problem of the breach of the base channel about minute waves i and ii for wave count 3 is resolved.
MACD hovers about the zero line, indicating low momentum and a lack of volatility. From an Elliott wave perspective MACD often returns to or beyond the zero line during a second wave correction. If this wave count is correct then MACD should show a strong increase in momentum beyond that seen for minor wave 1 downwards.
Pros:
1. Price remains within the base channel about minor waves 1 and 2.
2. The proportion of minute wave ii looks right.
3. The last upwards movement labelled minuette wave (c) fits best as a five wave impulse on the hourly chart.
4. Upwards movement continues to remain within the base channel drawn about minor waves 1 and 2.
Cons:
1. Within minor wave 1 there is gross disproportion between minute waves iv and ii: minute wave iv is more than thirteen times the duration of minute wave ii giving minor wave 1 a three wave look.
2. Minute wave ii has completed as a rare running flat: minuette wave (c) did not manage to move beyond the end of minuette wave (a) by a small margin of 1.66. This is only a small detraction though, this is a second wave within a third wave two degrees higher, which is the kind of situation a running flat may appear in.
3. The upwards wave of minute wave c within minor wave 2 looks like a three on the daily chart, but it should be a five.
If it were to continue as a double flat or combination, then minute wave ii may not move above the start of minute wave i above 1,224.35.
At 1,059 minor wave 3 would reach equality in length with minor wave 1.
Minute wave ii subdivides as a running flat. The subdivisions fit perfectly and the truncation is small. This is acceptable.
Upwards movement for minuette wave (c) ended just short of the blue base channel copied over here to the hourly chart. Today I have created a parallel copy and pulled it down to sit on the high of minute wave ii. This parallel trend line shows where Friday’s session found resistance.
I am moving the degree of labelling within the last first and second wave correction up one degree, because upwards movement labelled minuette wave (ii) shows up on the daily chart as a small green candlestick it is likely to be minuette wave (ii) and not a lower degree correction.
This wave count now expects an extended third wave is in its early stages. Downwards momentum should increase strongly next week as a third wave at six wave degrees unfolds.
At 1,126 minute wave iii would reach 2.618 the length of minute wave i.
This fits nicely with the lower target for minor wave 3 to reach equality in length with minor wave 1 at 1,059.
If I had to pick a winner it would still be wave count 4. However, it has too many problems for me to have confidence in it. I would wait for price to indicate which count is correct.
This analysis is published about 08:06 p.m. EST.

The Disconnect – GDX trading higher now than when gold was $20+ higher. Gold sideways and GDX in a nice uptrend. See chart below.
Gold stocks do tend to lead, but it’s tricky. Doesn’t always work perfectly. Could be indication of short term upside
Holding Dust at the moment and disgusted by the movement today. Going to need a large move south to shake out the weaker holders and i am not sure this will happen before a move north.
The bearish structure of DUST continues to prevail after it broke TL support. A breakdown of the current bear flag could take prices down to the 11.50 gap fill.
i concur, Dust looks bearish, and GDX looks bullish. Don’t see how gold can break down short term in the face of that, and it hasn’t, even today it held onto the 50 day.
Yes, 20ema and 50MA are nearly at same level providing a confluence of support.
on daily chart, lower bollinger band at 1184.68. In between, I see no support for price action to stay at current levels
One more down move to 1184.68 or so should complete the 5 wave movement that started at 1209.15 levels today
Lara is wave count 4 still your preferred count or has that changed?
Did the invalidations today change the direction of gold or still prefer down?
Yes.
I’m looking at volume on the daily chart and it seems to be strongly indicating that the breakout when it comes will be down.
But I’m also looking at MACD for the most recent sideways move and it’s right on zero on the daily chart. I’m figuring out if the bear wave count can fit a triangle in there, because it now looks like that’s what it is. I see Bob’s triangle idea below and it looks really good.
zoom in
Remember e wave cannot end beyond c. By my calculation, the triangle gets invalidated with trade below $1183.7. I agree it looks like we need a new low below $1191 to complete structure.
Agree… C is 1184. E should end tonight, maybe 1185…
With 1197-1201 limiting, expecting gold price to break below 1192 yet again for possible 1188/85….On a rebound from the lows, don’t see any bull beyond 1208-09, not just yet…. 🙂
I tend to agree. That’s why I posted below 3 hours ago that 1191.46 may not be the low yet. I could only count three waves down at 1191.46 and the wave needs five to complete. 1188/1185 seems to be a correct termination point from my Fib calculations.
Bob’sTriangle idea works well within subdivisions of this idea
Big pic
Thanks for the update. I like the look of this.
Yes–hope Lara will comment on this chart.
I have commented on this idea. I’ll do it again. I can see some significant problems with this wave count:
1. Intermediate wave (2) is almost 7 X the duration of primary wave 2 one degree higher.
2. Not only intermediate (2) but the entire movement from early in primary wave 3 sites outside and above the base channel about primary 1 and 2.
3. There is no Fibonacci ratio between primary waves 1 and 3.
Finally, don’t assume primary 4 will be a triangle. It could equally be a regular flat or combination.
I think the problem of proportion is significant.
Because all these problems can be resolved quite easily, this is not an idea I would consider seriously at all.
I will keep charting it and keep it in mind, but I think it has an exceptionally low probability. If there is another way to see this movement which has a great Fibonacci ratio between primary 1 and 3 and has perfect proportion and alternation between primary 2 and 4, why would you change that??
According to this chart, how low does B go before C heads up to 1250?
I think we are getting close but it would look better if subwave e goes down a bit more. We also need subwave e to subdivide as a 3.
I posted similar chart when gold bottomed at 1142 and i then said gold will not close below 1142 in weekly closing
Reason Stochastic is oversold and crossed over in Weekly…
Similarly now at 1224 Stochastic has again crossed over and is in Overbought region again… We might not see a high above 1224 until stochastic bottomed and we will get a low then…..
I am seeing a Selling opportunity.. from 1198 1200… GOld needs to close below 1191 in daily.
Just an idea whatif triangle e is running targetting the AC trendline at 1186.5
Did minuette wave ii just complete at 10:30 at 1,191.94?
Even though only Hourly 2 is left. Lara does mention ” When minuette wave (ii) is a complete corrective structure then this wave count expects to see a strong increase in upwards momentum as the middle of a third wave begins.”
Is minuette (ii) complete or may have to drop to 1,194.
Any wave count? whether minette (ii) is complete?
Lara mentions 1,209.22 as invalidation, and pmbull.com went above that and hit 1209.25 at 2:58 am. pmbull is exact and with Lara invalidation is even by 1 cent so only hourly left is Hourly 2 and gold also came close to her 1194 target as hit 1194.5 at 9:17 am and 9:20 am. Hourly 2 has gold moving up towards 1,304 target?
Covered all remaining shorts at a loss…I’ll wait for Lara’s incite…
Surprise u have loss on shorts on down day ???
Do you think 1191 is bottom?
Lara’s 1184.04 invalidation is not too far. If that happens all wave counts are invalidated. Price points from PMBUL.com
No idea…I’m at a loss from being whipsawed–was holding a position from last week–forgot to put a stop loss on it… 🙁 I’m so confused right now, I’ll wait for tomorrow, regain my wits…
I sympathise with you. I looked at the choppiness in the market these past few days and decided not to venture in. Choppiness is the bane of leveraged trades like NUGT and DUST. The losses are substantial.
Thanks, Tham…you were smarter than I was…I should have stuck with gld instead
No. I learned the hard way from the school of hard knocks. Once bitten, twice shy.
No. At 1184.04, only #2 is invalidated. All others are going strong.
In the past, I have found that pmbulls.com feed does not match Lara’s feed exactly.
April 16th at 7 am pm bull shows gold hit high of 1209.21. Lara has it as 1209.22 on her chart.
So I penny difference. I have seen pmbull match Lara’s charts many times and sometimes there are a few pennies difference. I use pmbull and it has worked for me in regards to invalidation in the past without any problem.
I have my doubts. Even if we consider 1209.25 as the “high”, which invalidates #1 and #3, Wave Count #4 still remains in contention. I gather from Lara’s charts that it is invalidated only above 1224.35.
At today’s low of 1191.46, Wave Count #4 is near subminuette 1 of minuette 3 of minute 3 which is slightly lower.
Hourly 4 has already been invalidated, which is bullish. However, wave count daily 2 which is bearish has not been invalidated until gold goes above 1224.35. Lara will provide a new hourly 4 count tonight. Then we may only have the two daily and hourly counts again.
I thought 1 and 2 are bullish, and 3 and 4 are bearish?
Actually you are correct, tonight Lara will also provide a revised wave count 1 daily and hourly as hourly was invalidated however the daily 1 was only short term invalidated so just needs a revision.
So wave count 1, 2 and 4 are still valid and Lara will provide daily and hourly for them tonight.
Wave count 3 was completely invalidated both daily and hourly.
Now you’ve got it right. The proviso for wave count 1 to be still valid is if subminuette 2 ended at 1209.25 instead of 1209.22 as in Lara’s chart because she got that as the short term invalidation point. If not, then #1 is also gone.
Just added more NUGT at this GDX back test.
GDX is looking great with Gold down 1%.
Yes, Hourly #2 looks like it may be playing out perfectly if the GDX is any indicator of higher prices to come.
You may be right, but I do see a couple things that concern me on the bullish side, namely silver is down by a larger % than gold, the equities are blasting to the upside and may make new highs soon, and the Hindu holiday to exchange gold ends on 21 April…I’m on the sidelines now, so I’m just waiting to be on the right side of the trade…
The GDX chart is undeniably bullish and has been for a while. The back test today to trendline and breakout point was a gift. I amazingly got shares filled in NUGT at 11.1740 this morning.
Three hourly wave counts got invalidated at price 1209.25:
Hourly counts:
(1) 1209.22
(2) 1184.04
(3) 1209.22
(4) 1209.22
Wave hourly is in play, Gold to retrace to 1194 and then to 1303.
netdania 1209.15 and comex i use 1209.00 were highs??/
Sentiment: If but somehow gold price can break below 1193 would likely confirm continuation of further downside for deeper decline….
I don’t see 1,193 on any of Lara’s charts?
I would still remain cautious. 1209.25 is just 0.03 above 1209.22. This may not be enough to invalidate. We are assuming that Lara’s count at 1209.22 is correct. What if that point is wrong, and subsequent price action indicates that it ought to be at the later point of 1209.25 instead? We’ll wait till Lara comes on to clarify this.
Long and informative Rambus precious metals post
http://rambus1.com/?p=35967
GDX chart by Nouf. Key point. Below 18.90 is bearish, otherwise 3rd wave up to come.
How To Use Market Sentiment To Improve Your Trading/Investing (Part 4)
Avi Gilburt
April 19, 2015 – http://www.gold-eagle.com/article/how-use-market-sentiment-improve-your-tradinginvesting-part-4
USD Chart from Gary Savage. Bullish for gold.
NUGT 15-min channel in case anyone is interested.
A VIEW: Expecting a choppy gold price activity ahead. With an inside day and a narrow trade range, an eventual breakout is inevitable. Momentum, MACD and ROC remain bullish; upside move is expecting…. With a break above 1205-08, there is not much to limit the upside from trying to seek 1213-1221… On the downside would require a break below 1198 to seek lower possibly 1193-90 only….
I see no reason to be bearish gold yet. However, there is a case to be made that the d wave is still in progress for the running contracting triangle targeting $1215ish to give better symmetry to the a-c trendline. If this happens, it will at least eliminate wave count #3. It also means more range trading for most of this week as wave e may not complete until later this week. Declining volatility (see GVZ) & volume combined with daily MACD hovering near 0 sure support a triangle. If this turns out correct, we will know the wave from $1142 is corrective as the triangle must be a b wave.
I agree. It’s possible that the d wave is incomplete. Greece will be in focus the next couple of weeks. Eurozone finance ministers meet Apr 24 and Greece has debt repayments scheduled on May 1 and May 12.
There is still no clarity of which way gold price is headed. So far, pivot 1203/02 is holding and would require a down move with thrust to slice through support levels between 1201-1196; I wonder if that is in the making.
I agree. Price movement so far has not resolved the up move or the down move question yet. As long as we are trading between 1224.35 (where only Wave Count #2 is valid, all others are invalidated) and 1184.04 (which invalidates Wave Count #2, and hence demoralises the bulls), the movement is still in consolidation mode. So far, price tried to break upside but it was stopped at the 1208/1209 level three times. A break above 1209 will be the first inkling of a possible up move (it invalidates Wave Counts #1 and #3, leaving #4 as the last stand for the bears). Until then, I will remain cautious, don’t want to be whipsawed.
Lara- Bear wave count is taking too long of duration after completing int wave 2c. For wave 5 to complete in 55 weeks gold has now may be 18 (?) weeks remaining ??????
Does this long side way action really qualify to be third wave action ?
While I focus more on GDX-related charts, I do look at gold too of course. The fractal similarities between the current structure and that of early 2014 are striking. A guesstimate fib projection could suggest gold prices run up to 1335-1340 area if the fractal plays out. Again, another line of bullish evidence to my eyes.
I’ve been watching this same thing.
Sounds like we’re playing off the same sheet of music. So you’ve probably also noticed that bonds look poised to bust higher next week? Amazingly I heard one of the CNBC “Fast Money” guys pounding his fist on the table on Friday saying you need to short TLT. I suspect he will get fried next week.
Who would short this chart? Maybe he mistook that bullish flag as a trading range which is near the top right now?
I don’t watch CNBC, but anyone pounding the table like that on any position makes me want to stay away.
I haven’t traded the bonds much, but I do look for their trends. Nice chart below. I’m not saying gold can’t drop, I just see more signs in favor of a rise.
So many people are calling that head and shoulders in gold, I mean everyone. Maybe it ends up playing out but when everyone thinks it’s so obvious, that’s when it’s not.
please find my bearish outlook on a 4 hours chart, any comment ?
Within your correction, if the A wave subdivides as a three that would indicate a flat correction. Which means the following B wave must be a minimum 90% of the A wave.
Only then can you look for the C wave up.
GDX chart at Friday close -bearish
http://stockcharts.com/h-sc/ui?s=GDX&p=D&yr=0&mn=5&dy=0&id=p71241437550&a=385190219&listNum=1
Ben Lockhart , Contributor
Author’s reply » Nice GDX chart above, and very possible.. Don’t ignore macd and TRIX tho as they are primary trend indicators and remain in bullish posture.. The negative divergences on RSI5 and the STOs could easily be taken out..
A lot depends on gold right now, which can certainly pull back a little more but can just as easily trigger the IHS forming now, in which case GDX won’t drop as far as you suggest before attacking 22.. Either way, i expect we should go higher over the next month – think this is the shakeout part to frustrate new bulls 😉
17 Apr, 02:54 PMReply
Mark/All,
What do you make of the developing wedge on GDX?
From thepatternsite, odds are 69% for down breakout and 31% for up breakout. I like that GDX has been stronger than gold, has had stronger volume on up days, but it’s approaching strong resistance lines and is close to overbought. If gold does break to the upside of the triangle idea that I have posted, I can see GDX breaking to the upside after a pullback at the upper trend line. Thoughts?
http://thepatternsite.com/risewedge.html
Interesting that Morris Hubbartt classifies that structure in GDX as a symmetrical triangle that has broken out to the upside. It is not just EW that provides more than one interpretation.
Morris is too bullish all the time for my liking. He tends to cherry pick indicators that support only the bull case regardless of what the gold market is doing. He is worth reading to get another set of eyes but I tend to take his analysis with a grain of salt.
I like his videos for exactly that reason. When he is bullish and sure, you can hear it and feel it in his voice. When he is bullish and unsure, you can hear that too, which tells me he doesn’t believe it.
Bob – In my view, you have the right idea putting MAs on the chart to give the pattern some context. I personally like the 50ema to determine whether GDX is trading in a near-term bullish vs bearish trend but use whatever you think fits well. A rising wedge that tags the 50ema without any immediately prior probes is probably set up for a rejection to lower prices. Multiple probes to the 50ema followed by claiming the 50ema as support is bullish in my view and gives the pattern a better chance of resolving bullishly. That’s what I think is going on now. However, if the patterns breaks and the 50ema no long provides support in trading days ahead, that will be a trigger for me to pull the plug and exit my long positions. Here’s a quick annotation showing my thoughts,…..
Plus I always look at multiple perspectives….I must have a dozen or more GDX charts in different time frames helping me dissect the structure. Recall this chart I posted back on 4/9. It looks just as bullish to me today as it did 8 days ago.
I’m aligned with Mark and a bullish break and wave count #2 right now. I like the look of the stochs on the weekly charts of GDX and GDXJ, I also like the weekly $Gold:Gdxj ratio momentum indicators I think the dollar has been weak for quite a few days and gold has some catching up to do as well. One big sign for me is the strong volume on up days for the miners. Finally, the Specs added a bunch of shorts in this weeks COT, so that favors a squeeze to me.
In Gold
The Big 4 didnt change and Big 8 reduced a bit of their shorts from 22 to 19 days of world production. Price was falling 16 dollars and that is not equal to a positionchange of 5.000 contacts and singlas relative weaknes in the market.
so how you can get more bullish from the last report? The next drop is still in process and
I favour the bearish scenario even we would break above 1224 but for now i think even this could be to optimistic. Now i think even one of Laras bearish counts could be right. She could be back on the road! whatever, if we break above 1224 i would not go long . this most likely would be the final catch for more longs to drop em after. i would look for the next short not far away.
It’s not just the last report, it’s the trends that I’m looking at. My sentiment may not be accurate, we will probably find out soon.