A small down day has not breached any invalidation points. All three Elliott wave counts remain valid.
Summary: In the short term I expect at least a little more downwards movement to 1,200 – 1,197. It is possible that the small down day for Wednesday is the very first day of a strong third wave down. While Gold remains within the consolidation phase it entered on 27th March, and while multiple wave counts remain viable, extreme caution is advised. The breakout will come eventually and price will tell us which wave count is correct. Volume continues to indicate the breakout may more likely be down than up.
Click on charts to enlarge.
To see weekly charts for bull and bear wave counts go here.
Bull Wave Count
The bull wave count sees primary wave 5 and so cycle wave a a complete five wave impulse on the weekly chart. At the weekly chart level this has a good look.
The problem with the bull wave count is within the subdivisions of intermediate wave (5). I have not found a solution which avoids running flats and has good proportion between the second and fourth waves of the impulse. The bear wave count has a better fit for this movement.
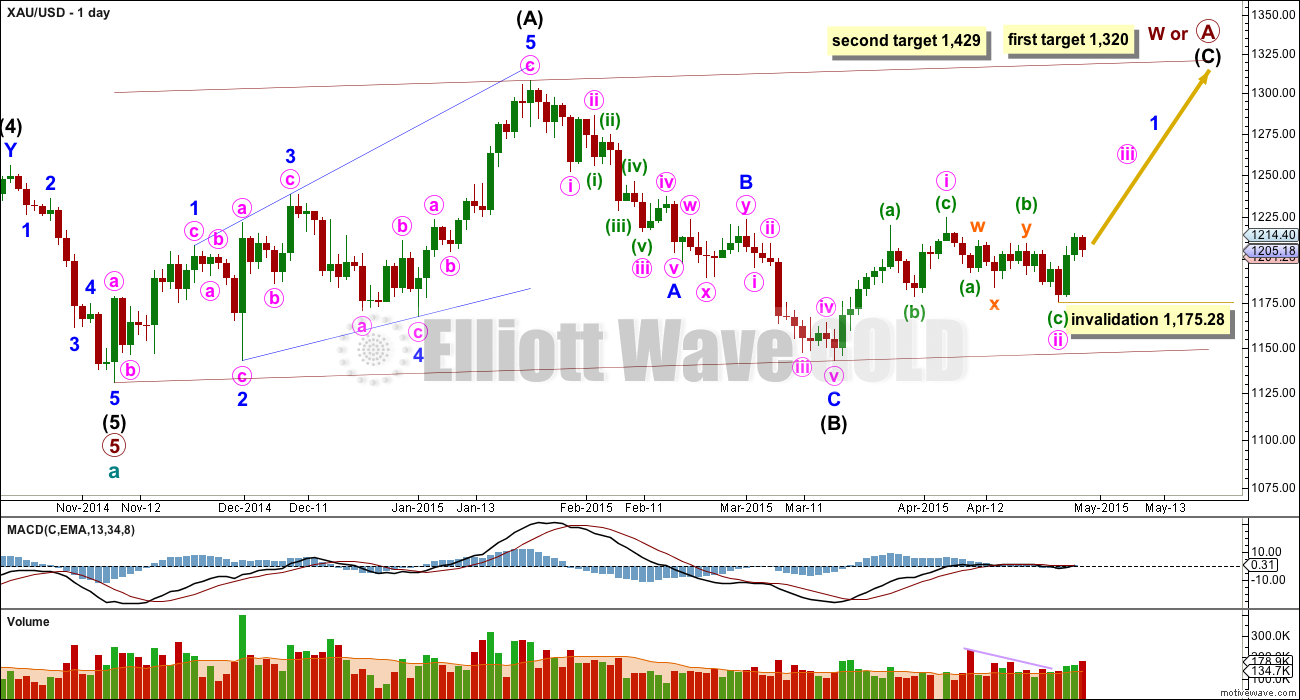
So far within cycle wave b there is a 5-3 and an incomplete 5 up. This may be intermediate waves (A)-(B)-(C) for a zigzag for primary wave A, or may also be intermediate waves (1)-(2)-(3) for an impulse for primary wave A. Within cycle wave b primary wave A may be either a three or a five wave structure.
Intermediate wave (A) subdivides only as a five. I cannot see a solution where this movement subdivides as a three and meets all Elliott wave rules. This means that intermediate wave (B) may not move beyond the start of intermediate wave (A) below 1,131.09. That is why 1,131.09 is final confirmation for the bear wave count at the daily and weekly chart level.
Intermediate wave (B) is a complete zigzag. Because intermediate wave (A) was a leading diagonal it is likely that intermediate wave (C) will subdivide as an impulse to exhibit structural alternation. If this intermediate wave up is intermediate wave (3) it may only subdivide as an impulse.
At 1,320 intermediate wave (C) would reach equality in length with intermediate wave (A), and would probably end at the upper edge of the maroon channel. At 1,429 intermediate wave (C) or (3) would reach 1.618 the length of intermediate wave (A) or (1). If this target is met it would most likely be by a third wave and primary wave A would most likely be subdividing as a five wave impulse.
It is possible that the intermediate degree movement up for the bull wave count is beginning with a leading diagonal in a first wave position for minor wave 1.
A leading diagonal must have second and fourth waves which subdivide as zigzags. The first, third and fifth waves are most commonly zigzags but sometimes they may be impulses.
Here, within minor wave 1, minute wave i may be a zigzag, and now minute wave ii also may be a completed zigzag.
This wave count sees very time consuming first and second waves at minute degree, but sometimes within diagonals the waves may be longer in duration. The diagonal is most likely to be contracting so minute wave iii is most likely to be shorter than minute wave i and so end before 1,257.
Diagonals don’t normally exhibit Fibonacci ratios between their actionary waves, so a target for minute wave iii cannot be calculated until some structure within it can be used. Minute wave iii must move above the end of minute wave i at 1,224.35.
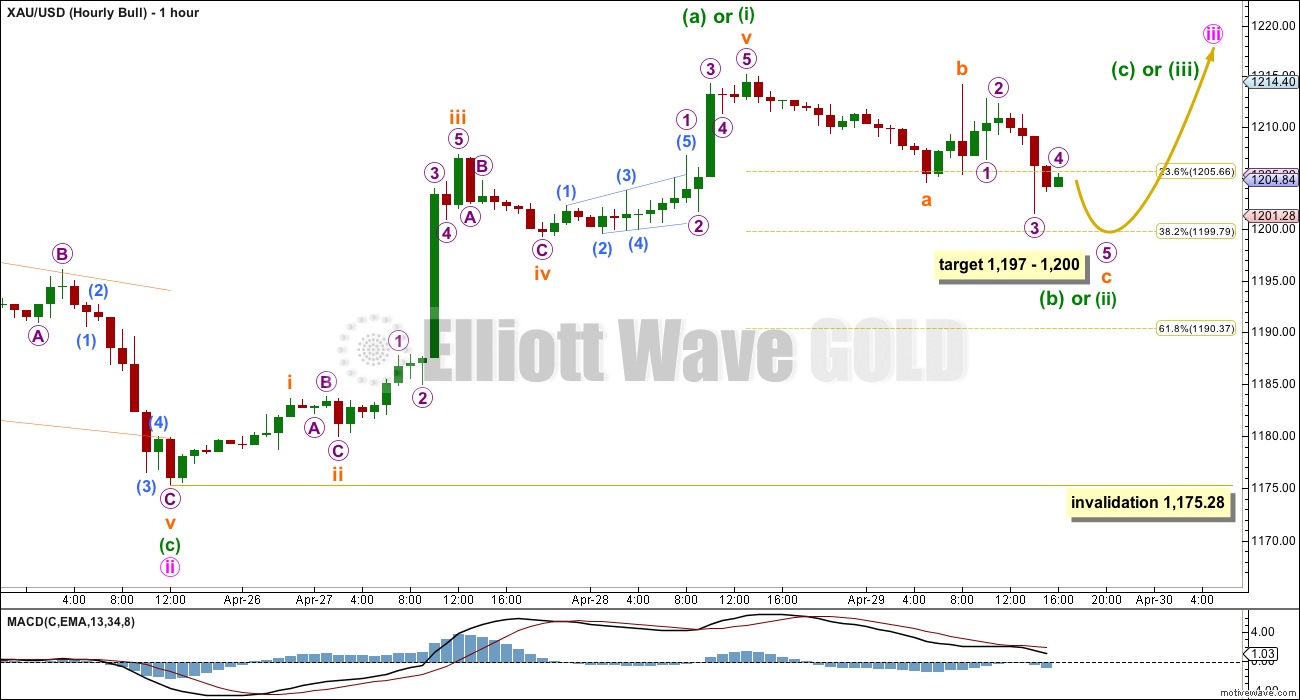
After considering several different ways to label most recent movement from the low at 1,175.28, I have concluded that this was a five up followed by an incomplete three down (or for the bear alternate a new five down).
Because minute wave iii may subdivide as either a zigzag or an impulse this five up may be either minuette wave (a) of a zigzag or minuette wave (i) of an impulse.
Ratios within minuette wave (a) or (i) are: there is no Fibonacci ratio between subminuette waves iii and i, and subminuette wave v is 1.05 short of 0.618 the length of subminuette wave iii.
If the current downwards trend is a correction then it would most likely be incomplete. At 1,197 subminuette wave c would reach 1.618 the length of subminuette wave a. This is $3 below 1,200 where minuette wave (b) or (ii) would correct down to the 0.382 Fibonacci ratio.
Minuette wave (b) or (ii) may not move beyond the start of minuette wave (a) or (i) below 1,175.28.
Main Bear Wave Count
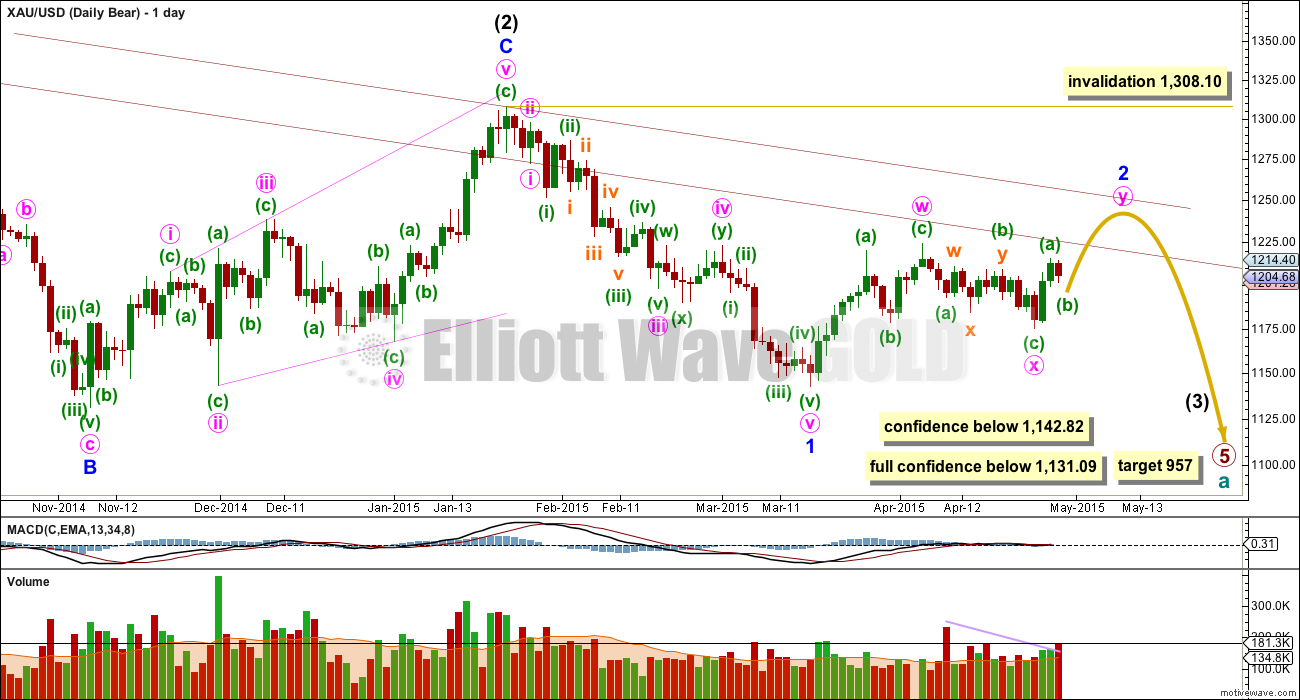
This wave count follows the bear weekly count which sees primary wave 5 within cycle wave a as incomplete. At 957 primary wave 5 would reach equality in length with primary wave 1.
Within primary wave 5 intermediate wave (1) subdivides perfectly as an impulse, and intermediate wave (2) subdivides perfectly as an expanded flat correction. Intermediate wave (3) should have begun.
The problem with the bear wave count is twofold. The channel about cycle wave a (upper maroon trend line, copied over from the weekly chart) is clearly breached. If cycle wave a is incomplete this trend line should not be breached.
The second problem is the duration and size of intermediate wave (2). Although all the subdivisions are perfect it looks too big at the weekly chart level.
Because the base channel on the alternate bear wave count is now clearly breached it has been relegated to a less likely alternate. This main bear wave count has about an even probability with the bull wave count at this stage.
Minor wave 2 may be continuing as a double zigzag. The only problem with this part of the wave count is the duration of minor wave 2. Now both minor wave 2 and intermediate wave (2) look too big on the weekly chart.
The purpose of a second zigzag is to deepen a correction when the first zigzag does not move price deep enough. Within double zigzags the X wave is normally shallow. The second zigzag may end when price touches the parallel copy of the upper edge of the maroon channel, in line with resistance at the high of intermediate wave (2).
Minor wave 2 may not move beyond the start of minor wave 1 above 1,308.10. Before price reached that point this wave count would substantially reduce in probability.
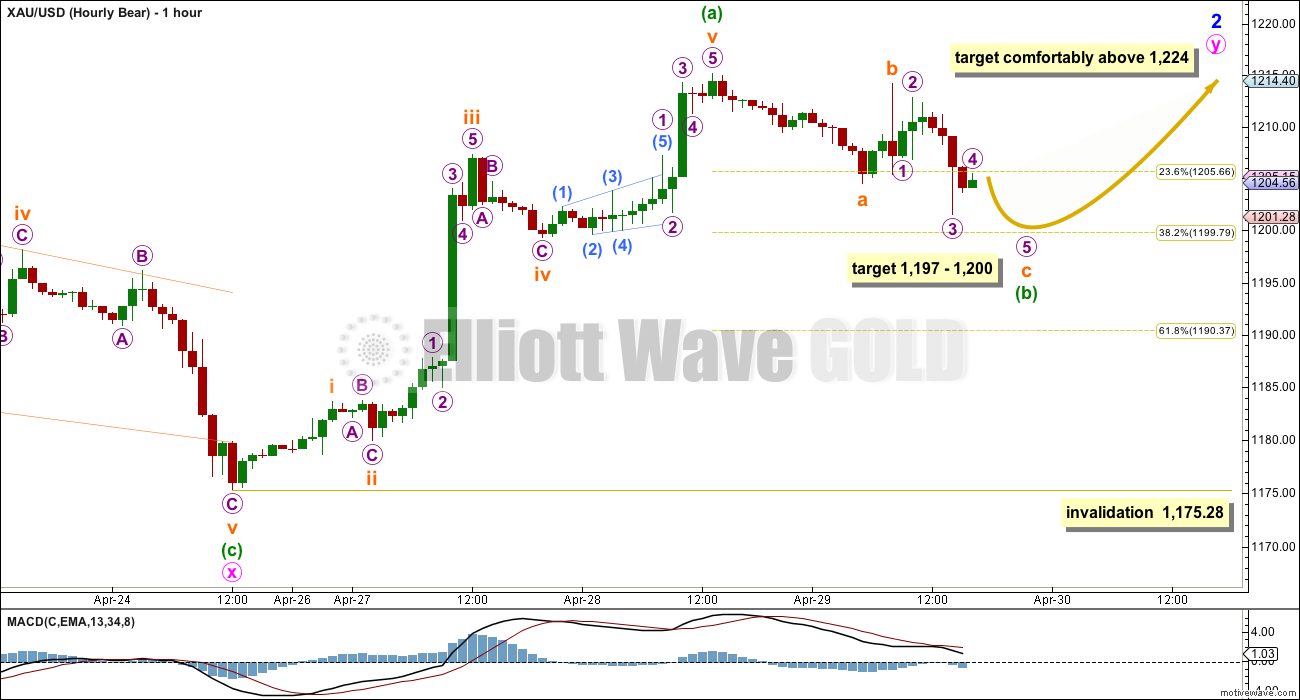
All three hourly wave counts see the last wave up as a five in exactly the same way. For this main bear wave count this would be minuette wave (a) within minute wave y. Minuette wave (b) is showing up on the daily chart as so far one red candlestick, which it should for minute wave y to have a clear three wave look on the daily chart.
Structures are the same so targets are the same for the short term for this bear wave count and the bull wave count.
Within minute wave y the target must be calculated at minuette wave degree using the ratio between minuette waves (a) and (c). Because minuette wave (b) is incomplete it is not known where minuette wave (c) begins, so a target for it to end cannot yet be calculated.
It is most likely that minuette wave (c) will be 1.618 the length of minuette wave (a) at 64.6 so that minute wave y moves a reasonable distance above minute wave w giving the double zigzag a typical look.
Alternate Bear Wave Count
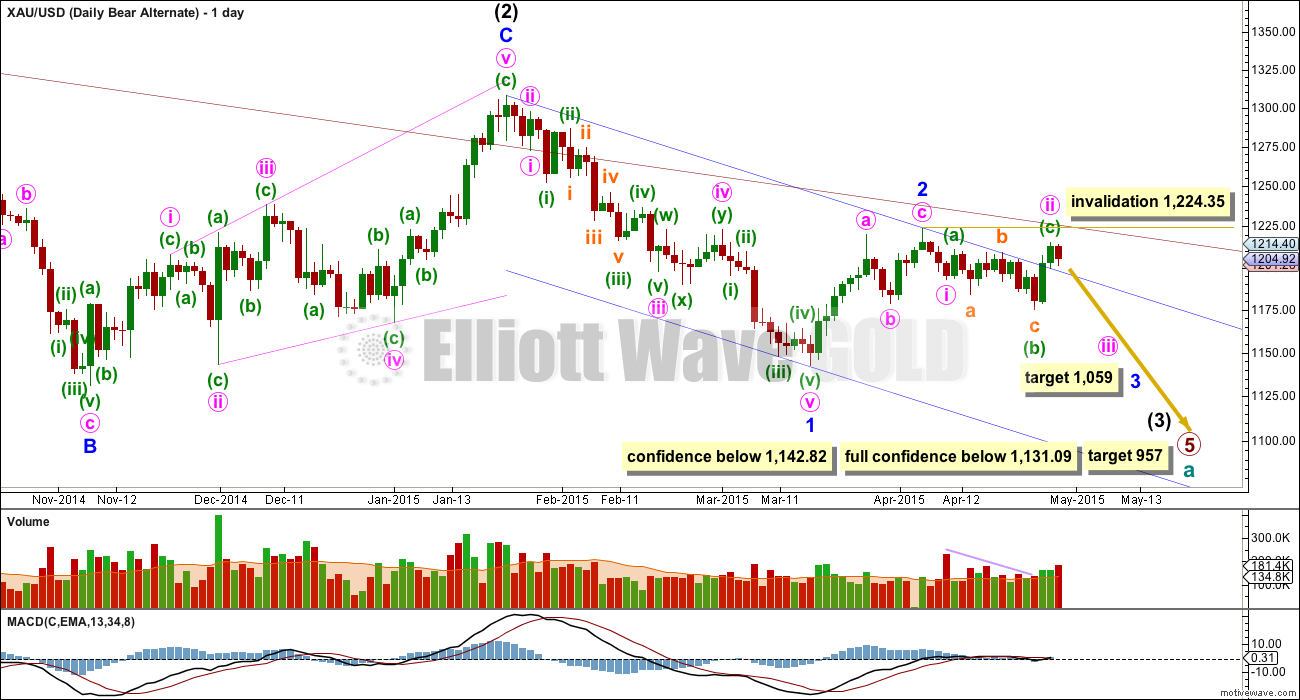
This wave count sees minor wave 2 as a completed zigzag, and minor wave 3 in its very early stages.
Minute wave ii is seen as a complete expanded flat correction.
The base channel about minor wave 2 is breached reducing the probability of this wave count. This alternate bear wave count has a lower probability than the main bear wave count, but only for the reason of the breach of the channel. Base channels often work as they should, but not always. Sometimes a lower degree second wave does breach a base channel.
The middle of the third wave has not yet passed. This wave count still expects to see a strong increase in downwards momentum at the daily chart level, beyond that seen for minor wave 1.
At 1,059 minor wave 3 would reach equality in length with minor wave 1.
If minute wave ii were to continue higher it may not move beyond the start of minute wave i.
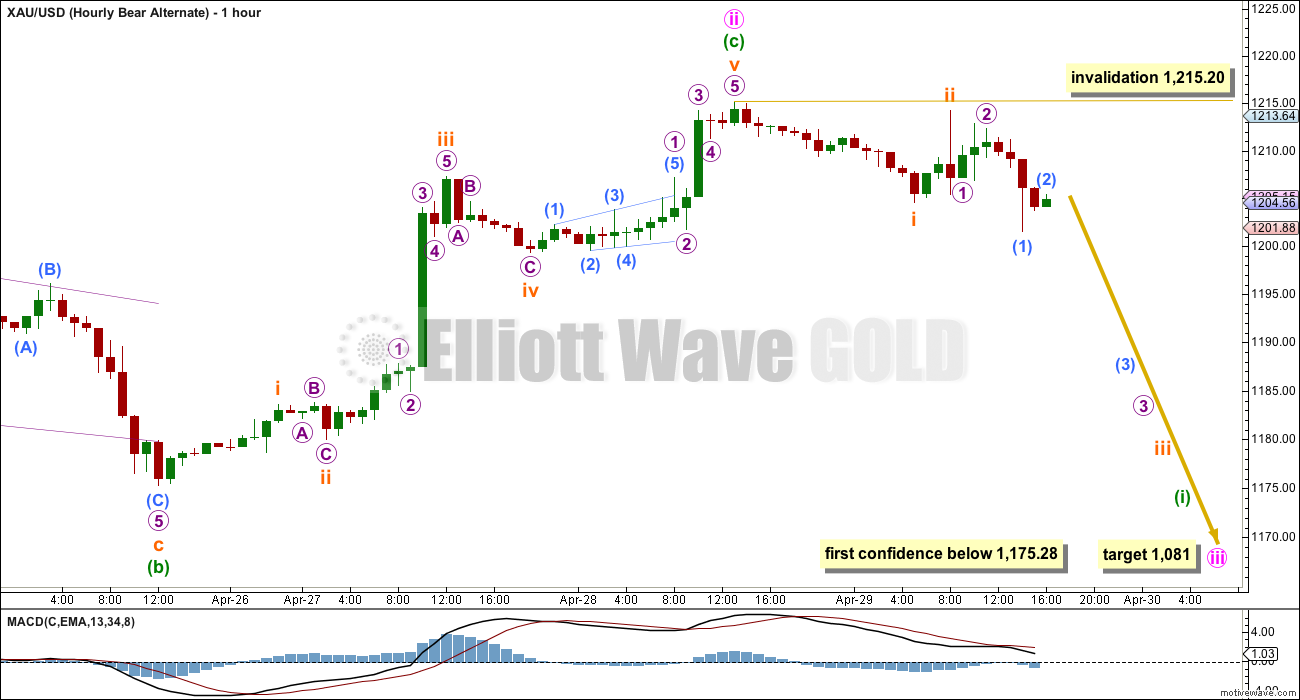
For this bear wave count the upwards wave here labelled minuette wave (c) is seen in exactly the same way as the first two hourly charts.
If minute wave ii is over then minute wave iii down has begun. At 1,081 minute wave iii would reach 4.236 the length of minute wave i. This target would be at least three weeks away.
Within the new downwards trend the first wave of minuette wave (i) would most likely be incomplete. The following correction for minuette wave (ii) may not move beyond its start above 1,215.20.
While all three wave counts expect at least a little downwards movement this bearish alternate expects a lot of downwards movement. It should see a strong increase in downwards momentum with an increase in volume quite likely. Although it has a lower probability it remains viable.
A new low below 1,175.28 would add a little confidence to this idea. For a big third wave to be confirmed it requires a new low below 1,131.09 for final confirmation.
This analysis is published about 05:23 p.m. EST.

The only way I can see this downwards movement as a complete correction is as a double zigzag. If that’s what it is, then it could be over. The bull and the main bear wave count expect upwards movement from here. The bear alternate expects downwards movement from here which should confirm that count if it is the right one.
There is an interpretation of the rules for diagonals which allows for double zigzags to take the place of single zigzags within diagonals. So that can work for the bullish wave count.
A double zigzag works nicely for the main bear wave count.
It is clear that volume is stronger on down days. This is a piece of evidence about the eventual breakout which must be taken into account.
Volume for this down day is again higher. Volume keeps indicating that the breakout will eventually more likely be down than up. This favours the bearish alternate wave count, but I must judge it to have a lower probability due to the channel breach and the depth and duration of minute wave ii.
All three wave counts remain valid.
Price must break below 1,175.28 if the bearish alternate is correct.
Only a new high above 1,224.35 would invalidate the bearish alternate, leaving two wave counts.
In the short term for the bearish alternate count I cannot yet see a complete five down for minuette wave (i). If this wave count is correct we may have some confirmation within the next few hours.
For the bull and main bear count I am struggling to see a completed three down as well, so both of those also require a little more downwards movement most likely.
Gold is still in the same range it has been since 27th March. It still needs to break out to tell us which direction the market will trend in. Caution is still advised, the market is trading not trending.
thanks Lara!!!!
I am obviously aware that there is only one correct wave count.
The relationship between Gold and US Oil is not of any use during this chop. Oil turned up March 18th, at that stage my wave count for US Oil saw it in a correction (it is) with either sideways move for a triangle (its a fourth wave) or upwards move for an expanded flat (which it did and now reached my target).
Given your idea I should have known which move Oil would do to tell me which move Gold will do….
That’s impossible.
While Oil has been trending up clearly, Gold has been trending sideways.
The correlation is not close enough to look at one and know for sure what the other will do.
Weekly closing will be important if it closes around 1190-1194 then inverted hammer at support. means there will be buying in weekly
May be Lara should write a brief summary at the top here soon!!!!!
i am hoping for a bounce tomorrow during US market hour and then down the Monday.
I could easily see that scenario occurring but I cant imagine trying to finesse a trade around it other than maybe adding to my DUST and JDST on a corrective gold bounce tomorrow. I have to admit, I added a little bit more JDST at 8.16 today when GDX was at the top of it’s bearish flag.
JUST A VIEW: Pity Gold price did not break below 1176…. Third time Gold price has fallen just short of .618 of 1224/1142; on the way up it should feel the heat (resistance) at 1186 and 50dma (1191ish) to remain under 1202-04ish should a break above 20dma (1199-1200) occur with upside risk no more than 1212-14…. I would look to short this on the rise once hourly RSI begins to tag above 30…. //// Happy long weekend and profitable trading. Good luck! Lots to think over whilst gold price remains range bound, choppy, sideways….
I did buy GDX at 20.06 at 1:17 pm EST.
I figure minuette wave (i) completed at the low of 1177.17 at 10:10 am.
And minuette wave (ii) has begun slowly.
Possible retrace targets .382 at 1191.70 and .618 at 1200.67
Based on high of 1215.20 April 28th less low of 1177.17 this morning.
If it gets high enough I’ll sell today, depending on Lara pre-close feedback.
Any comments.
Yes – I hope you are wrong 🙂 xxx
The.382 is more likely in a 3 wave down.
Isn’t gold now completing minuette wave iv? If so, your retracement levels are too high. If gold were to retrace to the 0.236 or 0.382 levels, then it would reach the mid- to upper 1180s before heading down again.
I’m thinking and hoping that too. By Lara’s labelling I think it would be subminuette wave iv. The 0.236 is around 1184.
I am sure that you correct – I always get confused on the smaller label names. Either way, I expect a shallow 4th wave is completing. Then a small 5th to perhaps knock on the door of the recent low. If it doesn’t break at that point, we’ll have to wait for the subsequent 3rd wave to destroy it.
That small 4th wave may now be over and a 5th wave underway. That would allow for a bounce tomorrow and a last chance to enter shorts.
Yes, I think we’ll just need to be opportunistic with whatever the markets give us. The strongest market moves never let any new people onboard as they wait for the correction so they can get into position.
I think so. Lara, below seemed also to suggest that minute i has not completed v down yet.
Matt great comment thanks I sold my position and will wait for lower price in GDX
I’d wager that gold will close today at the bottom of my triangle making folks still guess whether support gives way to a big move or this is a place to bounce. Some bounce would make the most sense. I think we need to get some new longs onboard after today before we can take out support.
Hi Mark – Are you disappointed with the move in DUST? On the upside we have been hammered. Even with gold falling yesterday, we were hammered for 4%.
I would have thought a 22% fall in gold would get us at least 10%+.
Your thoughts?
I will be disappointed if this doesn’t run up to the top of the channel ;-).
Like the way you love a chart Mark!
Just under 14 it is…
When do you sell? Give me the nod when you do. Much appreciated. Aidan
Actually here are some more refined thoughts. Understand I will be going off GDX as my cue more so than DUST but this gives you an idea. I buy touches to support in an uptrend and sell resistance.
You expected an extended run up to the middle channel?
I have a sell target at 16 or 1155 gold. Whichever comes first.
I’m more of the mindset of MTLSD….I like to position for a longer trade plan….weeks or even a couple of months if the charts allow. This looks like a possible longer term trade but of course I will constantly update structure etc….
That’s interesting. Any particular reason for those targets?
is it possible this morning XAU has completed the minuette (b) or (ii) wave of bear or bull hrly? or is everyone in the camp of bear alternate?
I am a fan of (b) or (ii) completing.
saw your comments below, I’m also agreeing with duck ST and Matt LT. Frustrated cause this (b) or (ii) is poor risk/reward and yet I’m itching to trade. (Have been patient for weeks during this chop slop)
I also like Mark F’s chart on GDX from 4hrs ago– I’ll probably go with GG (non etf)
im bearish too. i only said it is to early for the big drop down from my COT-perspective. but after this correction since 2011 is done we should go on with the big multidecade-bullmarket
yeah, but don’t forget the post 2011 a-b-c correction is YEARS in the making. Right now I’m anticipating the immediate drop and ugh, do we HAVE to wait for interest rate increase!
update: id better log off and do something else. I’m feeling major sarcasm approaching.
Any wave count now?
Has minuette wave (i) completed at the low of 1177.17 at 10:10 am?
Has minuette wave (ii) up begun yet.
Lara has minuette wave (i) symbol positioned at 11,74 on her hourly chart.
“Alternate Bear Wave Count – Within the new downwards trend the first wave of minuette wave (i) would most likely be incomplete. The following correction for minuette wave (ii) may not move beyond its start above 1,215.20.”
Look at volume again. It’s higher again. It keeps favouring the bear wave count.
For the bear alternate I do not think minuette wave (i) is over yet, I think it needs a final fifth wave down.
Lara, assuming this (the bear alternate) is how it plays out), and that subminuette v ends just a bit lower than subminuette wave iii, what sort of a retrace might we expect for minuette ii?
I have it now in micro wave 5 of subminuette wave iii, but that may change as I look more carefully at this movement.
I would look for the 0.618 and 0.382 ratios, favouring neither. The next correction will be a low degree second wave within a third wave three degrees higher. It may be more shallow than a second wave normally is.
Great, thank you, Lara.
This dropped gold at 8:30 AM TODAY – US Dollar went up .7% in 1 hour
8:31am U.S. jobless claims fall 34,000 to 262,000
U.S. jobless claims fall sharply to 262,000, lowest in 15 years
Apr 30, 2015 8:35 a.m. ET
WASHINGTON (MarketWatch) – The number of people who applied for U.S. unemployment benefits fell 34,000 to 262,000 in the seven days from April 19 to April 2…
http://www.marketwatch.com/story/us-jobless-claims-fall-sharply-to-262000-lowest-in-15-years-2015-04-30
$10 up in recent history has meant 10% loss on Dust. $5 down yesterday in Gold meant Dust down 4%…
At what point do the miners get smashed???
GLD gap is filled from Monday.
MTLSD, there are differing interpretations of gap trading. What does this gap fill mean to you?
I like to see gaps get filled in order to continue moves. Open gaps can limit moves. Not all obviously, but it’s just something I watch.
Continue move up or down?
I am positioned on the bull side right now, with a 75% position in JNUG at about $19.60 avg. I am expecting the move to continue up. The same gap that GLD filled today is about 2% lower in GDXJ, so I am fine with a little more weakness in the miners so long as the bull wave count isn’t eliminated. So seeing this gap fill is quite alright from my point of view.
I subscribe to Avi as well, and he was expecting a deeper correction like we are seeing now. He didn’t buy into the rise in gold over the past few days.
I like the COT structure here as well, but I am not looking at an individual week as much as I am looking at the trend over the past 7 to 15 weeks. My perspective is that the futures positions take time to build and deconstruct, and we recently finished deconstructing a large position and move, and since then I am not seeing much of a bearish build taking place yet.
What is interesting to observe on this board is how a market is made. There is no reality, only people’s perceptions. Good stuff.
I will follow up with one other comment, my strategy right now is different than how I have traded recently, I used to try to trade each wave up and down. For now, I am focused on the larger move and not trying to trade each and every wave. I am learning if this is a better way to approach the trades for me. So far, it’s been a lot less stressful.
Thanks.
Agreed….the psychology is fascinating here…a microcosm of the markets. Here are my thoughts on JNUG.
Also consider the channel context. A breakdown has a potentially long way to fall.
What does that chart look like with GDXJ. Too much decay in JNUG that long for me.
Good point. The GDXJ resistance line is very clean but the lower isn’t perfect but I think it still gives a reasonable idea of where support should be expected.
I have to say, right here looks like a scary place to be long.
Look how the weekly HUI is shaping up. Others have indicated that they KNOW I’m wrong and that prices must move up from here through a powerful downtrend. I see it differently and I believe the picture is getting even more clear.
Mark, great call and well done. What’s your strategy at this point, hold for the next few days/weeks or take profit now?
I am holding until the structure changes telling me otherwise. I suspect I will be holding my GDX short positions for at least weeks. I know it may be a bouncy ride however.
Near term, I don’t see GDX having any support until 19.45.
Thanks Mark. I was just about to buy JNUG at 8:30 🙂 when gold plummeted – quickly switched to DUST.
Gold is going down hard from here over the next several weeks. This is a great opportunity. For those who have trouble accepting this, take another look at today’s candlestick and how it has already gotten within $2 of breaking the low. If gold just went down a little and did it slowly, it would be another story. This is a clear wave 3 down. As for the best short term entry, to each his own.
And great job for sticking to your views. Even though I am a bear until gold breaks $1000, I let myself get fooled into believing that there could be a few up days yet. I now see the light again.
Thanks Matt. Although I’m not skilled in EW, I cant see how today’s down move could be interpreted as anything other than impulsive and it sure looks like the beginning of a 3rd wave. My GDX fractal chart posted today sure suggests that scenario too.
Mark F – Back to break even now on a big short. Is this going lower?
Is this the start of a larger down move or is this bouncing back from here?
this is propably not the start of a big downmove
Anything to support that view?
COT-Report
I view that differently. COT numbers do not support higher prices at this time. Quite the opposite.
why?
The percentage of bullish positions by commercial traders has been decreasing for several weeks now. Long term the commercials are always correct.
this is a very superficial contemplation of the data.
neither a big move up nor a big move down is the time for. that is what COT-report tells me so far. probably we will see another period of sideways upwards movement maybe with a false break to the upside before it can noticeably go lower. but in this time we have to see deterioration of datas which will signal that the next drop is in process. that means a raise of longcontracts by specs relatively to weak pricemovement to the upside and a raise of shorts by the big 4 dealers respectively the big8. actually upside is limited by manipulators and downside is limited by too weak longcontract-build up by the specs. thats why i predict for weeks now that Laras counts are wrong. the big drops allways happen after highs of longpositions by the specs. thats where the energy comes from in big downwaves primary. shortspecs will enter after new lows and in this phase the maniplators quit their big shorts with a big profit. commercials and specs are counterparts which rise in about the same and to predict something only cause of a change of positions of this two groups about the last weeks is about as like saying gold will rally tomorrow cause it did 5 dollars today.
an unerringly signal that a rally will end soon in gold is a sharpr increase of shorts by the big 4 respectively big 8 dealers and a very weak pricedeveloping upwards relatively to the long contract build ups by the specs. at the last top at 1307 we saw two weeks wehre specs added 60.000 longcontracts and price did nothing for expample. so im not bullish . im bearish too cause the manipulation is still going on physical and strong over futures .downmove should have washed out longs again today and the data should be pretty cleared up. so where a big drop shoudl come from? on monday we propably saw shortclosing and today longclosing. so nothing happend ….. . but lets see what the next report will tell us. we need more build up of longcontracts for a big drop. thats all. the price is still weak to positionchange and the manipulation was heavy on futuremarket too around the 1220 zone what is a good sign that we are not done with this correction since 2011 and will go for new lows.
The COT report is not a helpful tool for short term movements. The sheer fact that we always have to wait 3 days to see new weekly data is proof of that. However, longer term (weeks), it doesn’t look good for gold.
As it stands right now, gold is within a hair of breaking its recent low. Once that occurs, a number of stops will be hit. I would expect to see a raid on the price soon. I would be very nervous to be long here.
Take a look at the COT reports leading up to the huge declines in gold during April and June of 2013 and compare to now. It wasn’t that obvious then either.
june of 2013 is not a comparable situation to today. and i think you got something wrong. i use cot data not for short term trading but to get the trendchagne for several months
in other words. yes you are right the position changed bearish but a lot to weak for the bearish wavecount. most likely we will see another rise before a big drop can start.
I agree with duck ST and Matt LT. Its interesting to watch the long positions continue to be closed out by the banks, but in the short term I would like to see a bearish extreme on the COT again to support a big drop.
the datas were neutral in the last report. i i dont think will will see a significant change
Can you elaborate on this?
I have not known that CT can set the LT.
It will help me understand better.
I think there’s been a compelling case for lower gold and GDX prices as Ive shown on the charts the past couple of days. Major multi-year trendline resistance on GDX, bonds falling apart completely, USD bottoming in the context of a powerful uptrend, and DUST/JDST charts showing patterns very compelling of a bottom. I also posted the GDX hourly fractal below today. I have a gold chart that suggests that if spot gold prices close below 1180 today that there isn’t support until the 1135 area. I cant imagine being long here just based on the preponderance of evidence as I see it. Remember, nothing takes a straight line but I’d have to believe Lara would consider today’s move in gold to be consistent with an impulse.
awww i should have mentioned, a break below 1192 adequately and eloquently opens up downside risk 1177-76 notwithstanding the lower band at 1182 (place to take money off the table should gold price get there)…. Last time Gold price made a lows of 1174/1177 didn’t stay under the band longer than it ought to have and rallied…. Well done bears!!
I noticed this interesting fractal last night on the GDX charts. I did very well on the last plunge and this one is setting up similar.
also dollar may have made a major bottom yesterday. My trendlines may not be accurate enough for some people’s liking but they are the way I see things.
UUP had highest volume day ever yesterday. Again, I don’t see conditions being favorable for a massive breakout of the GDX monthly channel. All conditions are much more ripe for a top in GDX and not an imminent breakout.
I realize it’s only a secondary indicator but I’m finding the A/D lines interesting in how they are all dropping on GDX/NUGT charts and rising under the DUST/JDST charts.
GDX
DUST
JDST
SENTIMENT: Gold price of late has been range bound oscillating (jaywalking) between the upper and lower bands…. A bearish reversal appears to be in play today with a low at 1199xx already seen and requires again a below 1202 to possibly seek 1191-92 and probably get curtailed earlier at 1196-94…. With H 1213.50 / L 1200.7 inside day, a range break with some momentum can be expected…. Upside is a breeze not likely to seek above 1211-12 with 1214-16 on the outside. There is a resistance cluster between 1204-06 (also pivot at 1206xx), which Gold price has not been able to penetrate above as yet…. Downside is favored for now, rally is expecting though!
Gold daily head and shoulder. December HnS launched the price to 1307. The neckline once extended from that HnS is just below the gold current trading price level.
Gold has developed another inverse bullish HnS and neckline is just above 1219. So gold price is between two necklines.
Just like Lara says chart wise gold needs to make price movement break out above or break down below one of the necklines.
Breakout higher will be bullish and breakdown below will be bearish and invalidation price 1175.28 will be in sight.
Summary of invalidations:
Bull wave hour : Below 1175.2.
Bear wave hour: below 1175.28
Alt bear wave hour: above 1215.20
From yesterday’s post do I understand that if gold price trades below 1999.33 and invalidates both PM bull and bear counts alt bear count is validate.
A strong down ward pull shall begin soon???????
In that case gold will have only one wave count count.
Gold might already be following either hourly bull or hourly bear as they both have a drop to 1197 – 1200 then up and at gold already hit a low of 1200.06 at 3:26 am then bounced up to 1207.33 at 4:45 am.
We’ll see what happens before the close.
Except alt bear wave both bull and beard hour wave counts are valid. If this wave counts/s are correct then buy is here with stop below 1200. Invalidations for both (1199.33) being just below the low.
Knowing the uncertainty of gold in recent past confidence has evaporated in taking a position.
Just take the advise of Lara of clear signal will emerge only after a breakdown up/down.
Both breakdowns are far apart in price and do not represent a any better risk/reward position.
So wait thru this choppy side way price action.
Lara I appreciate your work, but there is only ONE true Elliot Wave Count. It is alrady pre-detrermined . You must figure it out before it happens from other indicators. For example Yellow gold usually always follows Black gold (crude oil) Since (i believe crude oil is going to move up into the 60’s I believe Yellow gold will follow. )There are other indicators. Volume is NOT always an indicator of direction Look for correlation with other indicators. Do a multiple correlation analysis (I can do that). I like what you are doing .BUT there will be only the truth and that truth is already KNOWN. Ste phen, aka Rabbittrader. Ciao