Although a small green candlestick is completing for Wednesday’s session, choppy sideways movement was not what was expected from the Elliott wave count. I had expected upwards movement.
Summary: The main bull wave count now requires sideways movement to complete a complex B wave, then downwards movement to end between 1,191 and 1,182, but not below 1,178.08. The bear wave count and alternate bull wave counts are the same for the short term: a fourth wave expanded flat must be over and a fifth wave up must unfold to a target now at 1,234. The price point which differentiates the two different ideas is now at 1,203.43, and a new low below this point would strongly favour the main bull wave count.
Click charts to enlarge.
To see weekly charts for bull and bear wave counts go here.
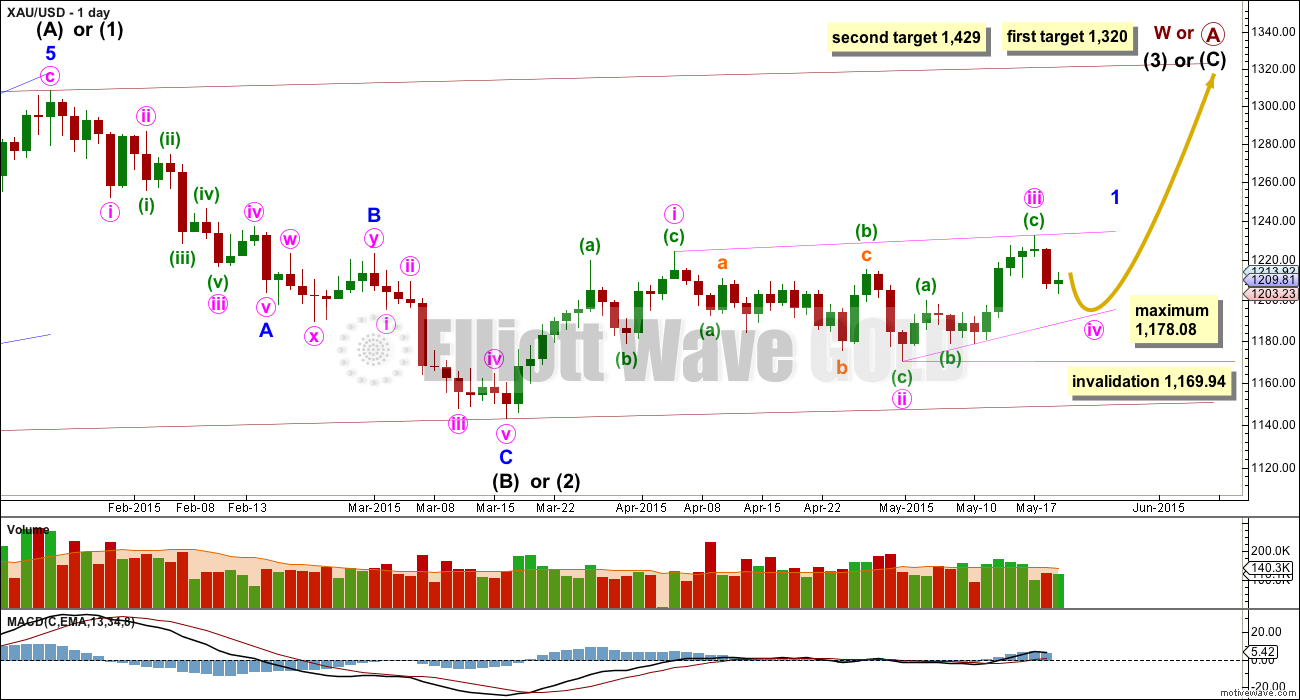
Bull Wave Count
The bull wave count sees primary wave 5 and so cycle wave a a complete five wave impulse on the weekly chart.
Pros:
1. The size of the upwards move labelled here intermediate wave (A) looks right for a new bull trend at the weekly chart level.
2. The downwards wave labelled intermediate wave (B) looks best as a three.
3. The small breach of the channel about cycle wave a on the weekly chart would be the first indication that cycle wave a is over and cycle wave b has begun.
Cons:
1. Within intermediate wave (3) of primary wave 5 (now off to the left of this chart), to see this as a five wave impulse requires either gross disproportion and lack of alternation between minor waves 2 and 4 or a very rare running flat which does not subdivide well.
2. Intermediate wave (5) of primary wave 5 (now off to the left of the chart) has a count of seven which means either minor wave 3 or 5 looks like a three on the daily chart.
3. Expanding leading diagonals (of which intermediate wave (A) or (1) is) are are not very common (the contracting variety is more common).
4. The possible leading diagonal for minor wave 1 and particularly minute wave ii within it look too large.
Last week volume shows an increase. This supports the bull count a little, but the increase is not higher than prior down days within the sideways chop. For volume to clearly support the bull wave count it needs to show an increase beyond 187.34 (30th April) and preferably beyond 230.3 (9th April). Only then would volume more clearly indicate a bullish breakout is more likely than a bearish breakout.
Within cycle wave b, primary wave A may be either a three or a five wave structure. So far within cycle wave b there is a 5-3 and an incomplete 5 up. This may be intermediate waves (A)-(B)-(C) for a zigzag for primary wave A, or may also be intermediate waves (1)-(2)-(3) for an impulse for primary wave A. At 1,320 intermediate wave (C) would reach equality in length with intermediate wave (A) and primary wave A would most likely be a zigzag. At 1,429 intermediate wave (3) would reach 1.618 the length of intermediate wave (1) and primary wave A would most likely be an incomplete impulse.
Intermediate wave (A) subdivides only as a five. I cannot see a solution where this movement subdivides as a three and meets all Elliott wave rules (with the sole exception of a very rare triple zigzag which does not look right). This means that intermediate wave (B) may not move beyond the start of intermediate wave (A) below 1,131.09. That is why 1,131.09 is final confirmation for the bear wave count at the daily and weekly chart level.
Intermediate wave (B) is a complete zigzag. Because intermediate wave (A) was a leading diagonal it is likely that intermediate wave (C) will subdivide as an impulse to exhibit structural alternation. If this intermediate wave up is intermediate wave (3) it may only subdivide as an impulse.
It is possible that the intermediate degree movement up for the bull wave count is beginning with a leading diagonal in a first wave position for minor wave 1.
A leading diagonal must have second and fourth waves which subdivide as zigzags. The first, third and fifth waves are most commonly zigzags but sometimes they may be impulses.
Within diagonals, the most common depth of the second and fourth waves is between 0.66 and 0.81. Minute wave ii is 0.67 of minute wave i.
Minute wave iii is now most likely to be a complete zigzag. Minute wave iv down must subdivide as a zigzag, must overlap back into minute wave i price territory, and may not be longer than equality with minute wave ii because this diagonal is contracting. The maximum depth for minute wave iv is at 1,178.08. Minute wave iv may be over in three more days if it lasts a total Fibonacci five days.
Draw the diagonal ii-iv trend line as shown. Minute wave iv is likely to end when price touches this lower trend line, which may be a better guide for it than any price target.
Today, at the daily and hourly chart level, the bull and bear wave counts diverge.
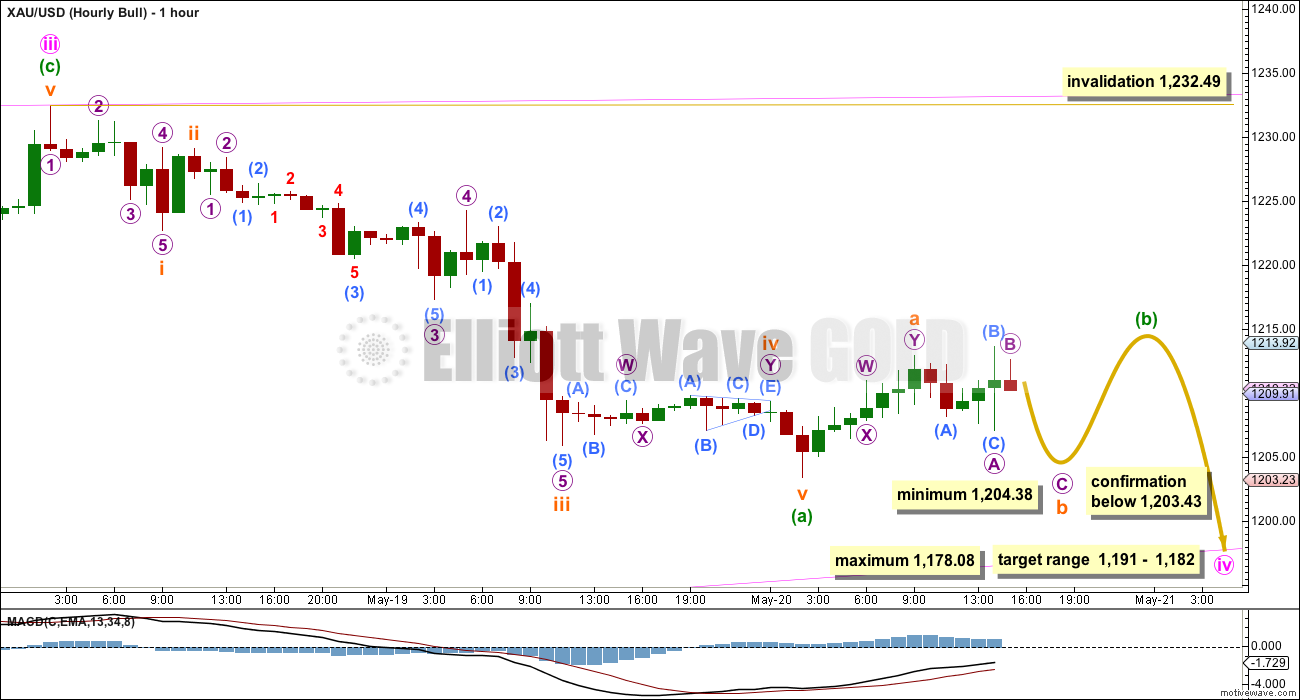
The problem is the upwards wave labelled subminuette wave a within minuette wave (b) on this chart, because it will not subdivide as a five wave structure on the five minute chart but it does subdivide nicely as a double zigzag. That fits this wave count, but not the bear or alternate bull wave count.
If my analysis of submineutte wave a as a double zigzag is correct, then we are seeing a B wave unfold sideways as either a double or single flat correction.
When an A wave subdivides as a three, it indicates either a triangle or a flat unfolding. Because the next movement was not a zigzag (it was a flat labelled micro wave A) this indicates minuette wave (b) may more likely be a flat. Within the flat correction, subminuette wave b must make a minimum 90% correction of subminuette wave a and must move down to 1,204.38 or below. Subminuette wave b may make a new low below the start of subminuette wave a at 1,203.43, and in fact is reasonably likely to do so because this would indicate an expanded flat which is the most common type.
At any stage, a new low below 1,203.43 would provide confirmation at the hourly chart level of this main bull wave count.
When subminuette wave b is complete, then a small five up for subminuette wave c would be required to complete a flat correction for minuette wave (b). When subminuette wave b is complete and the depth of it is known in relation to subminuette wave a, then the type of flat (regular or expanding) would be known.
Regular flats have a B wave which is 90 – 104% the length of the A wave. Expanded flats have a B wave which is 105% or more of the A wave. A regular flat expects the C wave to be about even in length with the A wave. An expanded flat expects the C wave to be 1.618 or sometimes 2.618 the length of the A wave.
Overall this main bull wave count expects very choppy overlapping movement for another day or so to complete a complex B wave. This is a small consolidation phase. As this B wave unfolds the wave count within it may very well change; of all the waves it is B waves which exhibit the greatest variety in form and structure and so require the most flexibility while they unfold. Often the correct structure is not known until they are over. At this stage, I can only say with confidence that if this is a B wave it is incomplete.
Minuette wave (b) may not move beyond the start of mineutte wave (a) above 1,232.49.
Alternate Bull Wave Count
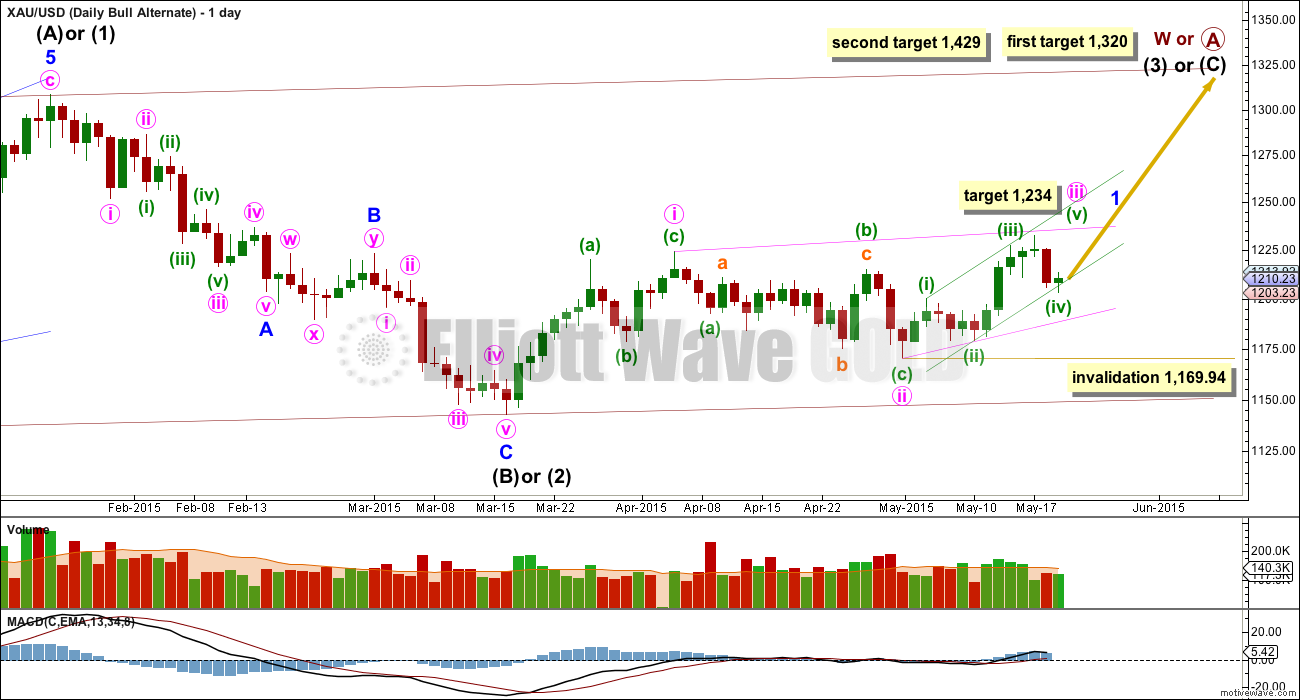
Within a leading diagonal, the second and fourth waves must be zigzags. The first, third and fifth waves are most commonly zigzags (main bull wave count), but they may also be impulses. Both structures must be considered for the bull wave count. The alternate looks at the possibility that minute wave iii is an impulse.
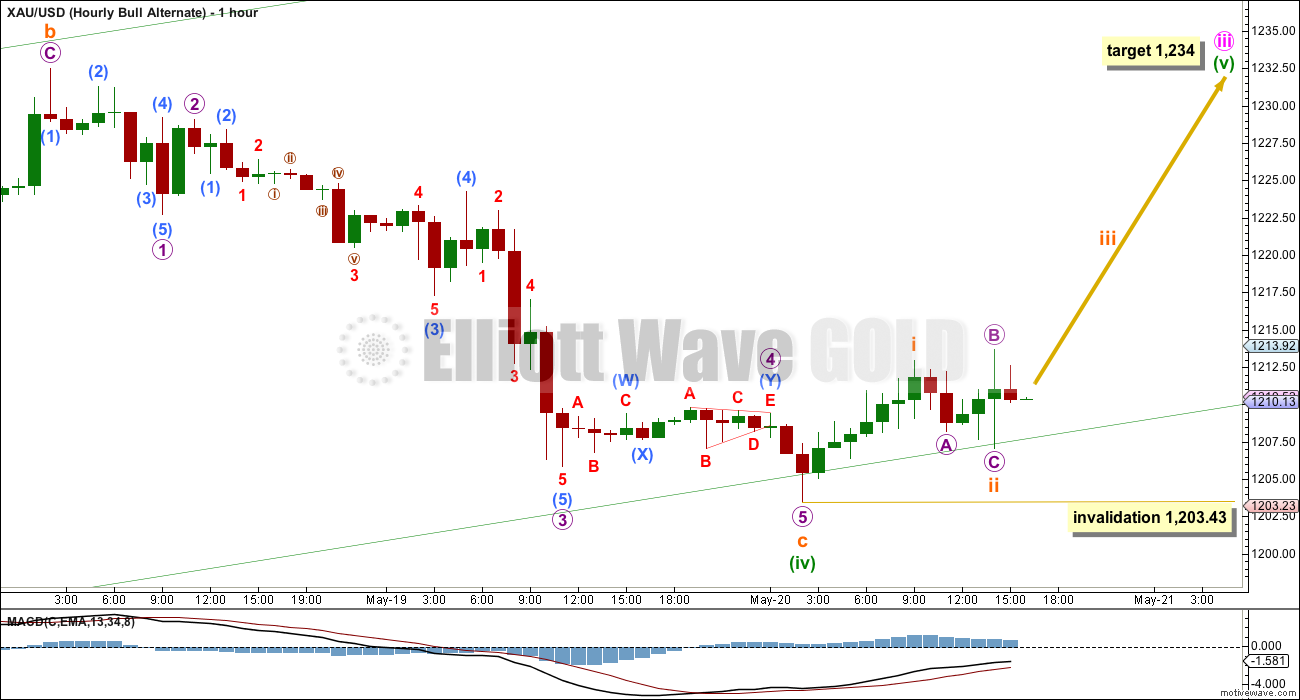
Within minute wave iii, if it is an impulse then minuette wave (iv) subdivides perfectly as an expanded flat correction and must be over here. There is almost no room left for it to move lower, and may not move into minuette wave (i) price territory below 1,200.03.
The subdivisions within subminuette wave c are slightly different from yesterday’s analysis. This has a slightly better fit.
Subminuette wave c is 2.48 longer than 1.618 the length of subminuette wave a.
Ratios within subminuette wave c are: there is no longer a Fibonacci ratio between micro waves 3 and 1, and micro wave 5 is just 0.11 short of 0.618 the length of micro wave 1.
Ratios within micro wave 3 are: there is no Fibonacci ratio between submicro waves (1) and (3), and submicro wave (5) is 0.43 longer than 1.618 the length of submicro wave (3).
Ratios within submicro wave (3) are: minuscule wave 5 is 0.26 longer than 1.618 the length of minuscule wave 1, and minuscule wave 5 is 0.11 longer than equality in length with minuscule wave 3.
Ratios within submicro wave (5) are: there is no Fibonacci ratio between minuscule waves 3 and 1, and minuscule wave 5 is 0.91 longer than equality with minuscule wave 3.
On the five minute chart, I have tried to see if subminuette wave i will subdivide as a five wave structure, either a leading diagonal or an impulse, and so far I cannot see a solution. This does not mean a solution does not exist; I have found sometimes a wave is difficult to see on a specific time frame so it should be looked at a higher or lower time frame for clarity. This wave count assumes a solution exists which I have not yet found. It may also be that a leading diagonal is unfolding in a first wave position to start minuette wave (v) upwards.
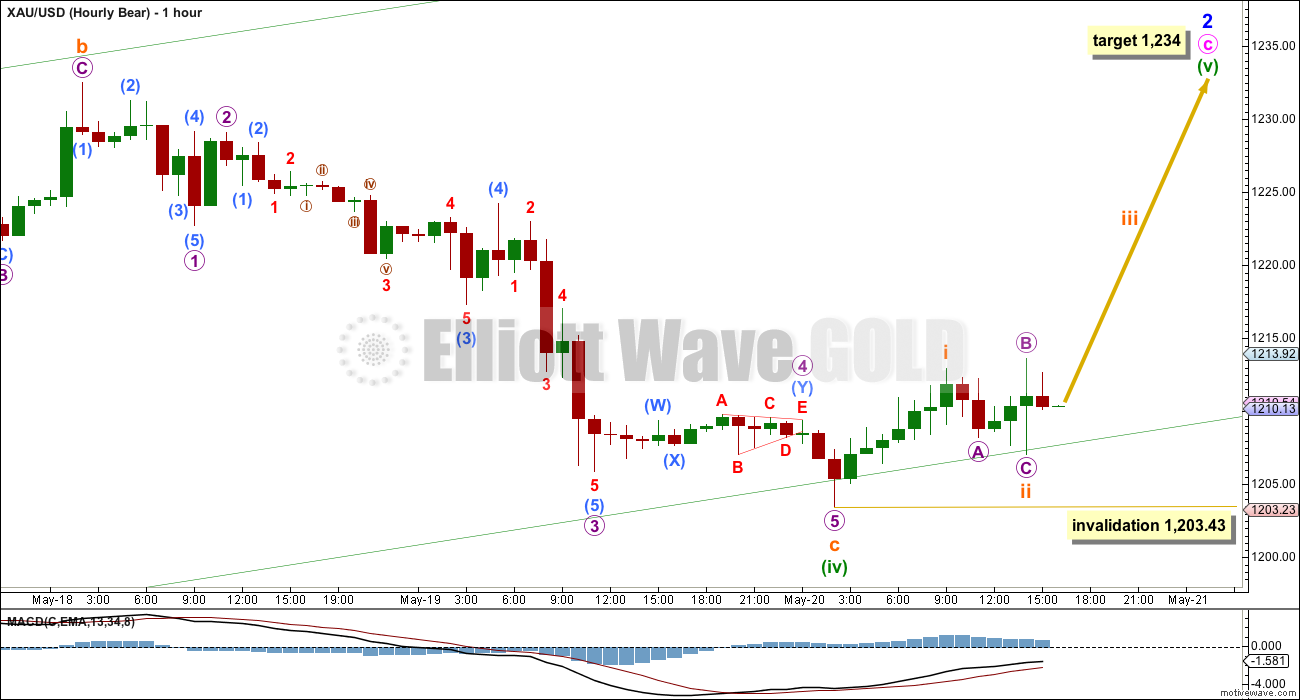
At 1,234 minuette wave (v) would reach equality in length with minuette wave (i).
Subminuette wave ii may not move beyond the start of subminuette wave i below 1,203.43.
I have also considered the possibility that minuette wave (iv) is not over and requires a final fifth wave down. But that would see the current sideways movement as a small fourth wave correction, which would be incomplete and so grossly disproportionate to its prior second wave equivalent. That would give subminuette wave c a three wave look where it should be a clear five, and it would also look like a three on the daily chart. For these reasons I have discarded the idea and moved the invalidation point up from 1,200.03 to 1,203.43. Minuette wave (iv) must be over now.
Bear Wave Count
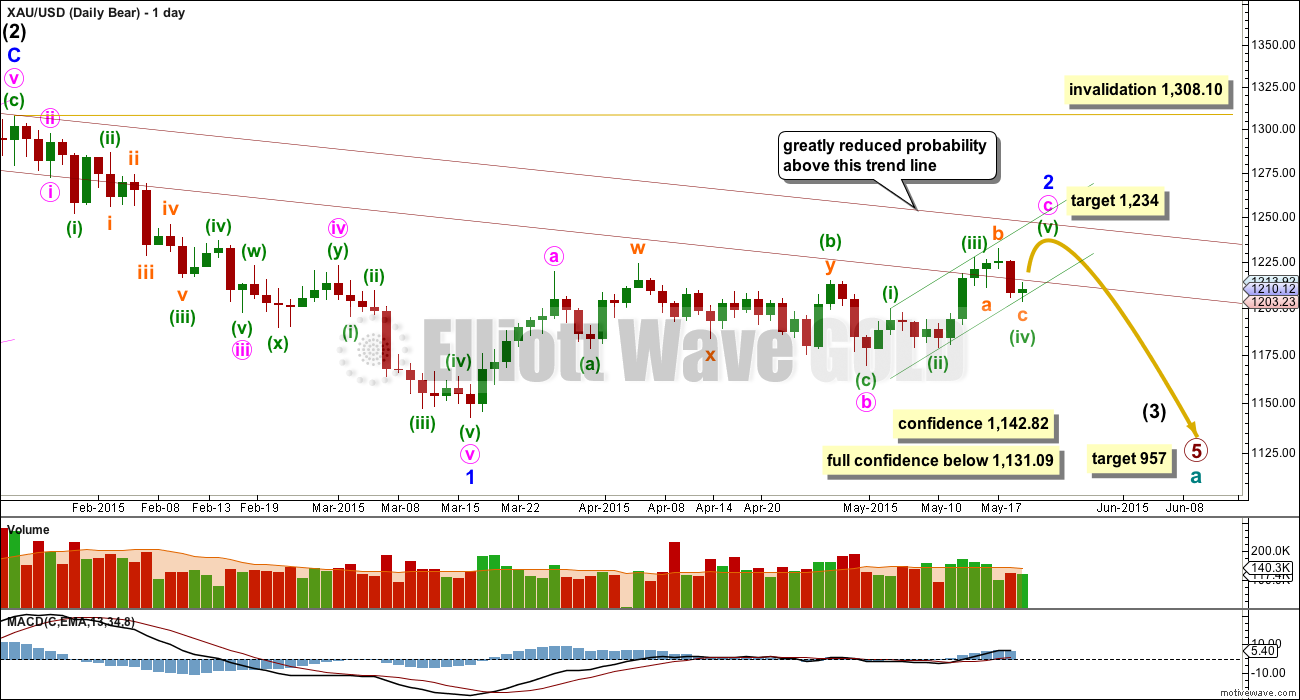
This wave count follows the bear weekly count which sees primary wave 5 within cycle wave a as incomplete. At 957 primary wave 5 would reach equality in length with primary wave 1.
Pros:
1. Intermediate wave (1) (to the left of this chart) subdivides perfectly as a five wave impulse with good Fibonacci ratios in price and time. There is perfect alternation and proportion between minor waves 2 and 4.
2. Intermediate wave (2) is a very common expanded flat correction. This sees minor wave C an ending expanding diagonal which is more common than a leading expanding diagonal.
3. Minor wave B within the expanded flat subdivides perfectly as a zigzag.
Cons:
1. Intermediate wave (2) looks too big on the weekly chart.
2. Intermediate wave (2) has breached the channel from the weekly chart which contains cycle wave a.
3. Minor wave 2 is much longer in duration than a minor degree correction within an intermediate impulse normally is for Gold. Normally a minor degree second wave within a third wave should last only about 20 days maximum. This one is in its 46th day and it is incomplete.
4. Within minor wave 1 down there is gross disproportion between minute waves iv and ii: minute wave iv is more than 13 times the duration of minute wave i, giving this downwards wave a three wave look.
This bear wave count now needs minute wave c upwards to complete as a five wave impulse. The short term outlook for both bull and bear counts is identical.
At 1,236 minuette wave (v) would reach equality in length with minuette wave (i).
Minor wave 2 may not move beyond the start of minor wave 1 above 1,308.10. However, this wave count would be substantially reduced in probability well before that price point is passed. A breach of the upper maroon trend line, a parallel copy of the upper edge of the channel copied over from the weekly chart, would see the probability of this wave count reduced so much it may no longer be published before price finally invalidates it.
All subdivisions and so all Fibonacci ratios, invalidation points, and targets are identical for this bear hourly wave count to the alternate bull hourly wave count.
Technical Analysis
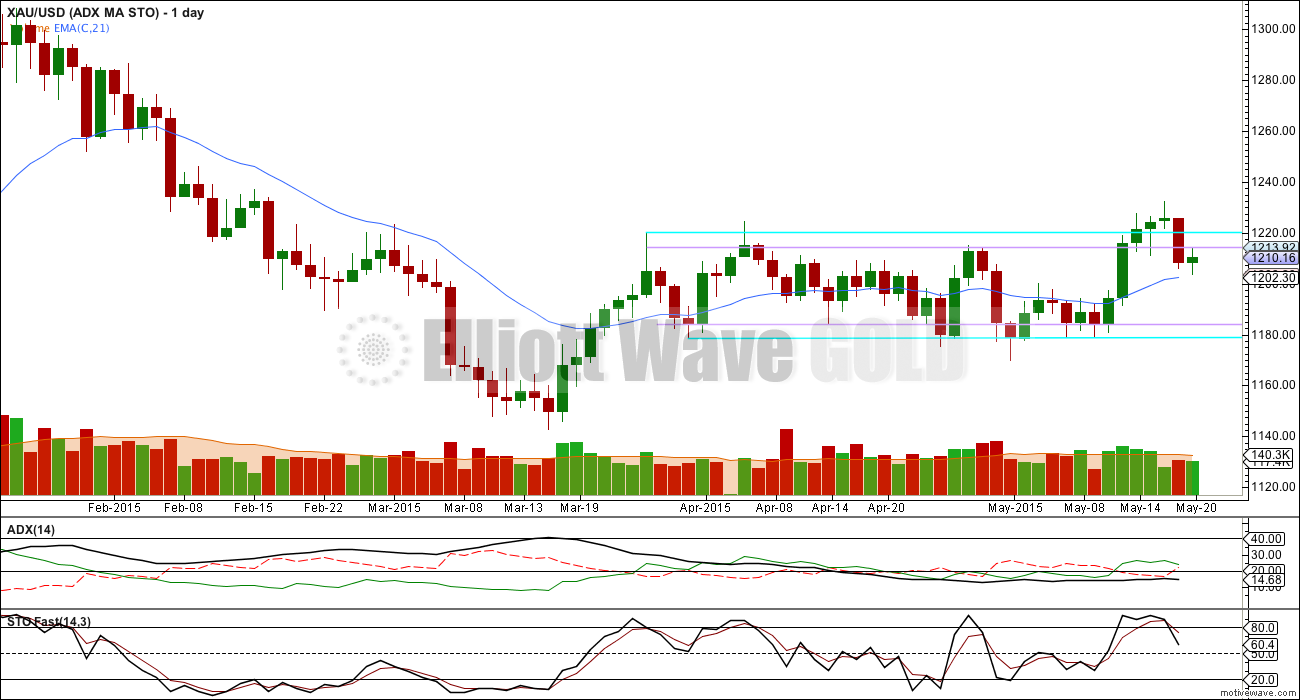
For yesterday’s data ADX flattened off, moving slightly below 15. This indicates there is no clear trend currently existing. The +DX line (solid green) remains very slightly above the -DX line (red dashed) indicating that if a trend develops it may be more likely to be up at this stage.
Price remains above the 34 day EMA, also indicating an upwards trend may be more likely.
Volume for yesterday’s down day showed a slight increase beyond the day before, but not beyond the prior four up days. This supports and upward breakout at this stage.
However, over the whole of this sideways chop since 27th March it remains the two down days of 9th April with 230.3K and 30th April with 187.8K which have the highest volume. This is some indication that a breakout may be more likely to be down.
Overall the regular TA picture is one of a lack of clarity. Direction is unclear, no clear trend exists, and it cannot be said with any confidence that the final breakout will be up or down.
With price now firmly back in the sideways zone delineated by horizontal lines, these may again be used for support and resistance. But extreme caution with any trading method is advised, because this sideways consolidation is close to maturity.
This analysis is published about 05:40 p.m. EST.

GDXJ made the buying on weakness list.
Just FYI – Monday is a U.S. holiday.
Yes NYSE is closed Monday
Memorial Day
https://www.nyse.com/markets/hours-calendars#holidays
I sold my GDX end of day at a very small loss. Thought gold might come back up a bit end of day of a down day. Had enough for today and overnight in case of surprises. I may trade intraday if something worthwhile.
Who knows may just buy back into GDX at the next bottom which Mark F mentions and Lara may clarify in tonight’s update.
I think GDX is going to tag the top rail around $20 again before the next hard leg down begins.
This is a setup for a GDX gap down opening tomorrow morning in my opinion.
I will have four hourly wave counts for you today.
The bull main and alternate as per yesterday. The main looking at minute wave iii complete as a zigzag and minute wave iv moving lower. The alternate looking at minute wave iii as an incomplete impulse with minuette wave (iv) now complete as either a zigzag or an expanded flat.
The bear main count will be similar to yesterday, with minute wave c an incomplete five wave impulse. I will now also have an alternate for the bear which looks at minute wave c as an ending expanding diagonal.
For the short term all four wave counts will expect some upwards movement to at least 1,213.65.
Thanks for your helpful comments Lara.
I wish gold EW behaves just as predictable as US Oil. Once this conso is over may begin then.
I wish that too very much.
That would be heavenly. Much easier to make profits.
Lara
Any chance left of minuette wave (b) wave reaching the 1214 area hopefully today? I’d rather exit GDX then drop slowly to 1191 – 1182 target area.
I don’t think it will get up there in just one more hour, so no. Not today.
I will have a main and an alternate for both bull and bear, so I will have four hourly charts today.
All four wave counts expect some upwards movement for the short term, to at least above 1,213.65.
The short term expectation is actually 1,212.96 for all four wave counts, at minimum.
That is required to avoid a truncation.
I keep watching broken support levels morph into resistance. 1191 seems like a logical next support.
Hard to see Gold price get past 1209 in a hurry for 1212-13 with topping seen at 1221-25…. Tomorrow is another day, lets see how this closes today…. With a low range close can expect some downside continuation….
10-year yield dropping.
Can someone remind me again why an expanding diagonal starting from 1169 would not work? Gold would be in the 4th wave of that right now. The final 5th wave up to complete the C wave of minor 2 would make a fitting ending to this rally within a longer term bear market.
Naturally gold still needs to drop to the 1180s/1190s before a 5th wave up can begin.
That’s entirely possible. And yes, price needs to drop below 1,200.03 for the fourth wave to overlap first wave first.
Expanding diagonals aren’t as common as contracting, that would be my only concern.
The subdivisions fit.
Intermediate 2 of primary 5 ended this way, so it seems reasonable here too.
Also that this is a 4th wave of 5 up, as you had listed in the last analysis, doesn’t seem reasonable with the 4th wave being way beyond 38.2% and the low of 4 being just a couple dollars away from 1st wave price territory.
Thank you.
If minute c for the bear count is an impulse then minuette wave (ii) was a deep 0.70 zigzag, and minuette wave (iv) is either an expanded flat or a zigzag which is now 0.58 of minuette wave (iii).
So yes, the second and fourth waves no longer exhibit good alternation.
I will have a main and an alternate hourly count for the bear today. The main will look at minute wave c as an impulse, the alternate will look at minute wave c as an ending expanding diagonal.
1,200.03 is the price point which will differentiate them.
Hourly bull alternate and hourly bear both invalidated.
Hourly bull confirmed.
No. They just need reworking. Alternate bull is invalidated only at 1169.94. Bear has an upper invalidation point at 1308.10 but no lower limit except zero. Both are invalidated only in the short term, and a rework should be fine. See my comments in the reply to papudi.
As in my earlier reply to you, I have loaded up more NUGT at the low today.
Tham
Both hourly were invalidated not their daily charts.
Gold moved below the invalidation point on 2 hourly charts that is a fact. That indicates they were both invalidated and that is another fact. We make an annoucement of that occurance in this comments area that is another fact.
For almost 2 years we called an invalidation an invalidation. Let it be known as that otherwise it is confusing the facts.
Yes Lara can revise them daily or change them somehow. Yes perhaps you may still see those two invalidated charts as possibly useful.
I have to totally agree with you Richard. If you start getting to a point when an invalidation is no longer an actionable signal but rather a call for a rework, the whole analysis seems to lose its usefulness, right?
Right.
Lara produces both daily and hourly charts for her possibilities. Daily and hourly have different invalidation points. I only noticed and commented on invalidation on 2 HOURLY charts. The daily were still valid. The invalidated HOURLY will be updated tonight.
Tham – You are brave with your trades. I guess because you know EW so well, you have more confidence in gold’s forecasted movements or can calculate them better, so you trade the swings better, which is great.
That’s right. If you know EW than one can trade of Lara’s various wave counts and profits from it.
Well said.
One wave count got invalidates and got confirmed. Now expect gold to move in wave b up tp 1214 area and then down in wave c to 1182.
Are you going to trade that? Are you going long here to 1214 and then shorting down to 1182 and then go uber long for a target at 1236? I’m trying to understand this…it all seems so difficult to effectively manage and subject to so much change and how do you set exits if price movement doesn’t follow the plan?
Hi papudi.
The drop has reached as deep as 1201.62. So, the alternate bull and the bear both need reworking. I think Lara will simply put 1201.62 as minuette 4 for both. They will then both rise from there. Minuette 5 will now be about 1232 instead.
At the same time, the bull has increased in confidence. In that scenario, the minuuette b wave is an expanded flat as SM b = 1.18 SM a. Then, the reach in SM c will be 1.618 (of SM a), giving a target of 1217.
I have put in more longs, targeting 1217, and if it rises further, 1232. This is now the safest play as all three wave counts point to a rise. The only outside chance that it may go wrong is that there is a wave count that even Lara didn’t think of that does not follow this pattern.
That took some guts to put on more longs. I’m seeing miner charts breaking down left and right here. I just cant see the bullish picture everyone here is subscribing to.
At CMP 1210, its really down to which gets taken out first 1212-13 or 1206-05…. Very annoying not knowing which way this will swing! lol….
SENTIMENT: Almost next to impossible to make any sense of this. Gold price remains bullish, trend is up. Hourly bull wave count is favored. Gold price remains toppy at 1210-16 (5dma) with upside risk 1225-28; pullback / short term down move is expecting; takes a break below 1204 to open up 1184; remains to be seen how deep a drop / pullback occurs, maybe no more than 1195-93 (there is 20/50dma to contend with on the downside); I would watch price behavior around pivot 1208; range expansion of H 1213.20 / L 1202.70 is expecting…. //// I am just wondering – a break below 1184 opens up 1145….
Syed, I’ve notice you consistently have price points ready during market movement, but I have trouble sometimes sweeping through what you are saying. Can you tell me if the wording I have below expresses the details of your views correctly?:
Gold price remains bullish.
Hourly bull wave count is favored.
Price remains toppy at 1210-16(5dma), upside risk 1225-28. Pullback/short-term down move expected.
Pullback to below 1204; opens to 1184 risk, but may be
no more than 1195-93.
Watch price behaviour around pivot—1208. Range expansion [possible] of 1213.20H – 1202.70L.
…[Wondering about subsequent moves] break below 1184 opens 1145.
Thank you for helping me understand.
Hi. Personally I think the shorts/bears have lost the plot. Gold price is bullish but currently being curtailed under 1216(5dma) from within under here I am expecting a pullback / short term decline. It is just a matter of time when the up move kicks in to take out this level and head for 1225-28+…. On the downside not much is seen below 1204 with a break below here most likely to be curtailed anywhere between 20dma/50dma (1200-1193). It is Lara’s hourly bull wave count I am referring to which in my view is the most likely scenario playing out. Time and price will tell which is which. Although a short term decline / pullback is expecting, so far Gold price behavior around pivot has moved away to the upside indicative of which way gold price is most likely to continue go….
There was plenty of downside to play for if you sold resistance at the 50% retrace for gold at 1225 coupled with two bearish back-to-back candles. Perhaps this will play out according to the EW script but for now the strategy just all seems very bizarre to me. Yesterday morning we were supposed to expect 1236 yesterday or perhaps by today. Maybe that will happen with housing numbers so bad that data will suggest people have decided to start living out of their cars. Now with 1203.42 being broken this is supposedly even more bullish and it gets crazy bullish if prices get down to 1184? The lower it goes the more likely the bullish scenario. Wasn’t there a bear trade buried in there somewhere?
Very good questions 🙂
Hi Mark F: I am bearish for 1080. Since the low of 1168, Gold price has not really dropped below 1180 having made a recent high of 1232…. I think Gold price is now heading to top under 1230 and needs to get the downside going again…. Staying short come with upside risk.
The Hourly Bull chart sure looks bearish spooky, could drop almost $20 to $30. I bought a little GDX after FOMC release and hope gold doesn’t drop that low. If gold goes below 1203.43 I’ll just sell. Getting more difficult to make money with gold. Ongoing trend less choppy movement.
Weren’t you incredibly bullish 3 hrs ago? I’m starting to see a defined channel developing in the GDX intraday charts. While I’m certainly not counting on it, I could see GDX getting down to $19.56 as soon as tomorrow. There are some interesting fractals I’m seeing in other PM charts that suggests tomorrow could be a hard down day for the miners.
Mark F thanks for the warning, If miners tank I’ll bail at 1203.43 invalidation. Meanwhile I’ll pray for a Miracle that either Hourly bull alternate or Hourly Bear charts is my path to riches.
Bearish spooky for sure. At the moment, gold is really moving (invertedly) step by step with the dollar. If the dollar corrects a little right here – which is a possibility after such a strong 3 day uptrend – then gold can move up some. However, once the dollar moves decisively through 96 – which will happen, it is just a matter of when – gold is toast.
Hi Richard, you’re right, the bull counts sometimes propose an initial drop so deep, that you might as well just sell. Before the breakout above 1200, on May 11, both bull and bear counts expected downwards movement, then on May 12, one bear and one bull expected downward movement, and I believe there was one count which indicated upwards movement, which is what happened. Most of the traders were bearish at the time gold broke over 1200, because even the bull count was short term bearish. I’m getting confused myself how many times I said bull(ish) and bear(ish).
Really didn’t see that the gold price couldn’t rise much yesterday. May have been too tired, at 3+ am my time. But no excuses, let’s look for a solution.
After the rise to 1212.86, all 3 wave counts call for a drop. The bull alternate & the bear will have a more shallow drop to maybe 1208-1209. The bull will have a much larger drop, minimum 1204. So, that will be the first inkling as to which will be the more likely wave count.
If it is the bull alternate or the bear, no harm done. Just sit back and wait for the rise to 1234 to exit. We may even add more to our holdings.
If it is the bull, we can buy more GDX/NUGT at 1204 to dollar average. The price will rise to about 1213-1215 for the minuette b wave. Then it is time to exit (with a small gain), followed by shorting for the short drop towards 1191/1185 before buying GDX/NUGT again at the bottom.
Lara: Just wondering why an expanding diagonal was never considered as a possibility for the C wave of minor 2 in the daily bear? Upward movement from 1169 looks (at least to my amateur eye) like it has completed 3 waves and could be in a 4th wave down. Intermediate 2 of primary 5 was an expanding diagonal, so why can’t that work here too on a smaller level? A short answer will do.
Again, I would much prefer a quicker move up as you demonstrate above. Thank you.