
The main bull and bear Elliott wave counts expected a little downwards movement. Price has drifted sideways in a narrow range.
Summary: A small B wave is most likely continuing sideways as a double combination. The target for it to end is 1,215. Thereafter, both main wave counts expect another five wave structure down. When the B wave is complete then a target may be calculated for the C wave down.
To see weekly charts for bull and bear wave counts go here. Changes to last analysis are italicised.
Bull Wave Count
Click chart to enlarge.
The bull wave count sees primary wave 5 and so cycle wave a a complete five wave impulse on the weekly chart.
Pros:
1. The size of the upwards move labelled here intermediate wave (A) looks right for a new bull trend at the weekly chart level.
2. The downwards wave labelled intermediate wave (B) looks best as a three.
3. The small breach of the channel about cycle wave a on the weekly chart would be the first indication that cycle wave a is over and cycle wave b has begun.
Cons:
1. Within intermediate wave (3) of primary wave 5 (now off to the left of this chart), to see this as a five wave impulse requires either gross disproportion and lack of alternation between minor waves 2 and 4 or a very rare running flat which does not subdivide well.
2. Intermediate wave (5) of primary wave 5 (now off to the left of the chart) has a count of seven which means either minor wave 3 or 5 looks like a three on the daily chart.
3. Expanding leading diagonals (of which intermediate wave (A) or (1) is) are are not very common (the contracting variety is more common).
4. The possible leading diagonal for minor wave 1 and particularly minute wave ii within it look too large.
Last week volume shows an increase. This supports the bull count a little, but the increase is not higher than prior down days within the sideways chop. For volume to clearly support the bull wave count it needs to show an increase beyond 187.34 (30th April) and preferably beyond 230.3 (9th April). Only then would volume more clearly indicate a bullish breakout is more likely than a bearish breakout.
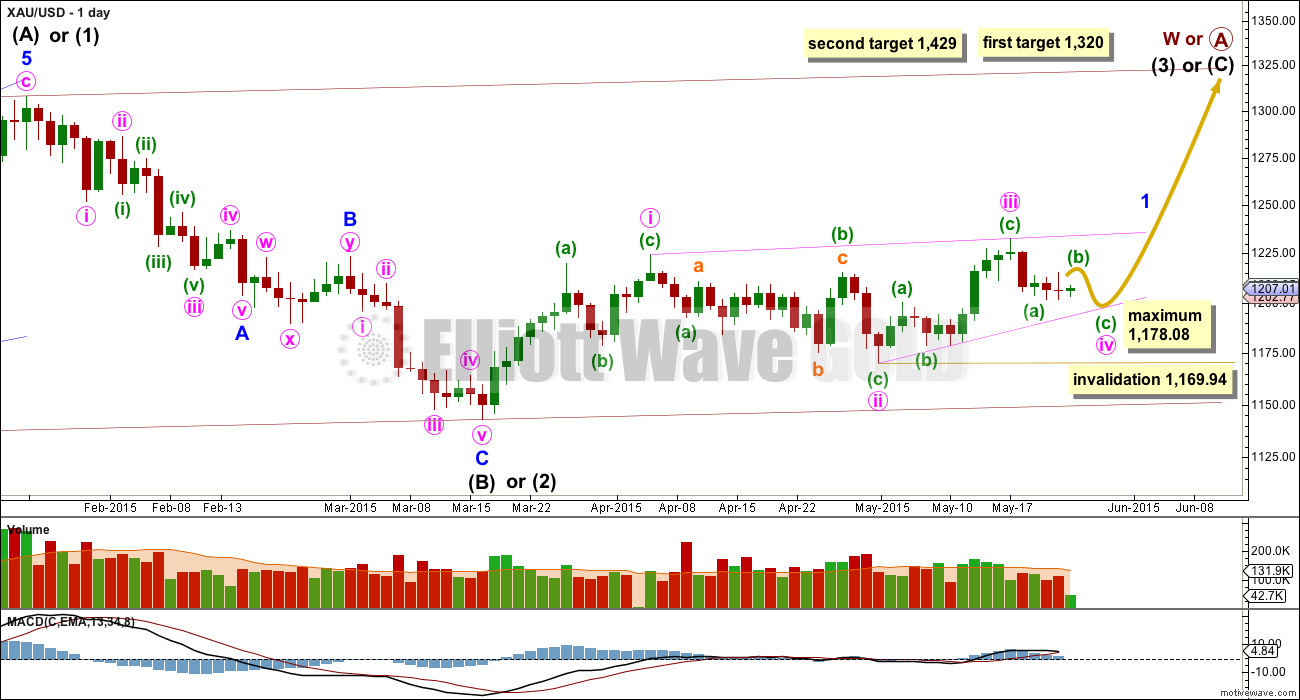
Within cycle wave b, primary wave A may be either a three or a five wave structure. So far within cycle wave b there is a 5-3 and an incomplete 5 up. This may be intermediate waves (A)-(B)-(C) for a zigzag for primary wave A, or may also be intermediate waves (1)-(2)-(3) for an impulse for primary wave A. At 1,320 intermediate wave (C) would reach equality in length with intermediate wave (A) and primary wave A would most likely be a zigzag. At 1,429 intermediate wave (3) would reach 1.618 the length of intermediate wave (1) and primary wave A would most likely be an incomplete impulse.
Intermediate wave (A) subdivides only as a five. I cannot see a solution where this movement subdivides as a three and meets all Elliott wave rules (with the sole exception of a very rare triple zigzag which does not look right). This means that intermediate wave (B) may not move beyond the start of intermediate wave (A) below 1,131.09. That is why 1,131.09 is final confirmation for the bear wave count at the daily and weekly chart level.
Intermediate wave (B) is a complete zigzag. Because intermediate wave (A) was a leading diagonal it is likely that intermediate wave (C) will subdivide as an impulse to exhibit structural alternation. If this intermediate wave up is intermediate wave (3) it may only subdivide as an impulse.
It is possible that the intermediate degree movement up for the bull wave count is beginning with a leading diagonal in a first wave position for minor wave 1.
A leading diagonal must have second and fourth waves which subdivide as zigzags. The first, third and fifth waves are most commonly zigzags but sometimes they may be impulses.
Within diagonals, the most common depth of the second and fourth waves is between 0.66 and 0.81. Minute wave ii is 0.67 of minute wave i.
Minute wave iii is now most likely to be a complete zigzag. Minute wave iv down must subdivide as a zigzag, must overlap back into minute wave i price territory, and may not be longer than equality with minute wave ii because this diagonal is contracting. The maximum depth for minute wave iv is at 1,178.08. Minute wave iv may be over in three more days if it lasts a total Fibonacci eight days.
Draw the diagonal ii-iv trend line as shown. Minute wave iv is likely to end when price touches this lower trend line, which may be a better guide for it than any price target.
Click chart to enlarge.
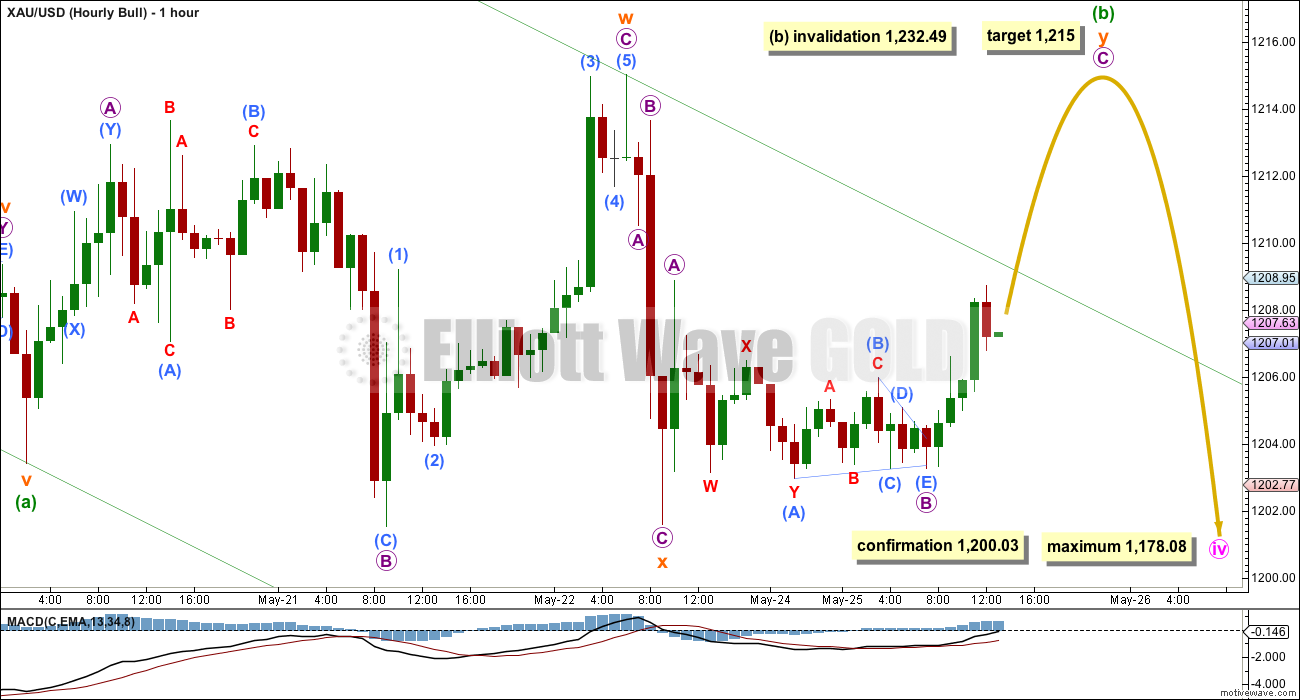
Sideways movement does not fit as part of a new five down; it would be a fourth wave which would be grossly disproportionate to its counterpart second wave. What does have a good fit and looks typical is an incomplete double combination for minuette wave (b).
The first structure in the combination was an expanded flat labelled submineutte wave w.
The double is joined by a three in the opposite direction, a simple zigzag labelled subminuette wave x.
The second structure in the double looks like it is unfolding as a simple zigzag labelled subminuette wave y.
Within subminuette wave y, at 1,215 micro wave C would reach 1.618 the length of micro wave A. This would bring subminuette wave y to about the same level as submiuette wave w which ended at 1,215.03.
The purpose of double combinations is the same as triangles. They take up time and move price sideways. To achieve that purpose the second structure in the double normally ends close to the same level as the first.
Minuette wave (b) may not move beyond the start of minuette wave (a) above 1,232.49.
Minuette wave (b) should end within the next 24 hours.
Minuette wave (c) downwards should follow, and is most likely to reach equality in length with minuette wave (a) so it is most likely to be about 29 in length.
Alternate Bull Wave Count
Click chart to enlarge.
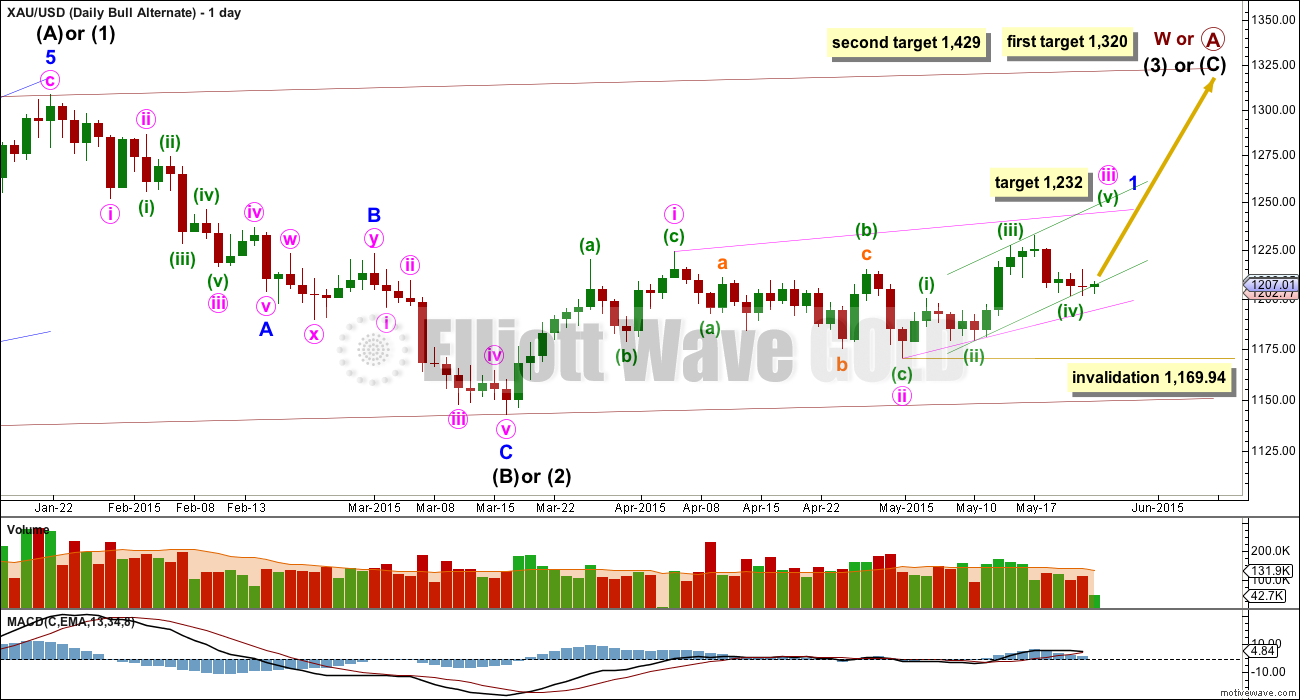
Within a leading diagonal, the second and fourth waves must be zigzags. The first, third and fifth waves are most commonly zigzags (main bull wave count), but they may also be impulses. Both structures must be considered for the bull wave count. The alternate looks at the possibility that minute wave iii is an impulse.
Within minute wave iii, if it is an impulse then minuette wave (iv) subdivides perfectly as an expanded flat correction and must be over here. There is almost no room left for it to move lower, and it may not move into minuette wave (i) price territory below 1,200.03.
Click chart to enlarge.
Minuette wave (v) would reach equality in length with minuette wave (iii) at 1,232. This wave count now expects a strong third wave up to be unfolding. The fact that price is not showing an increase in upwards momentum today does not support this wave count and further reduces its probability.
Price continues to not find support at the lower edge of the channel containing this possible five wave impulse up. This does not look right, but it’s still only a very small concern.
Minuette wave (iv) of an impulse may not move into minuette wave (i) price territory below 1,200.03.
Bear Wave Count
Click chart to enlarge.
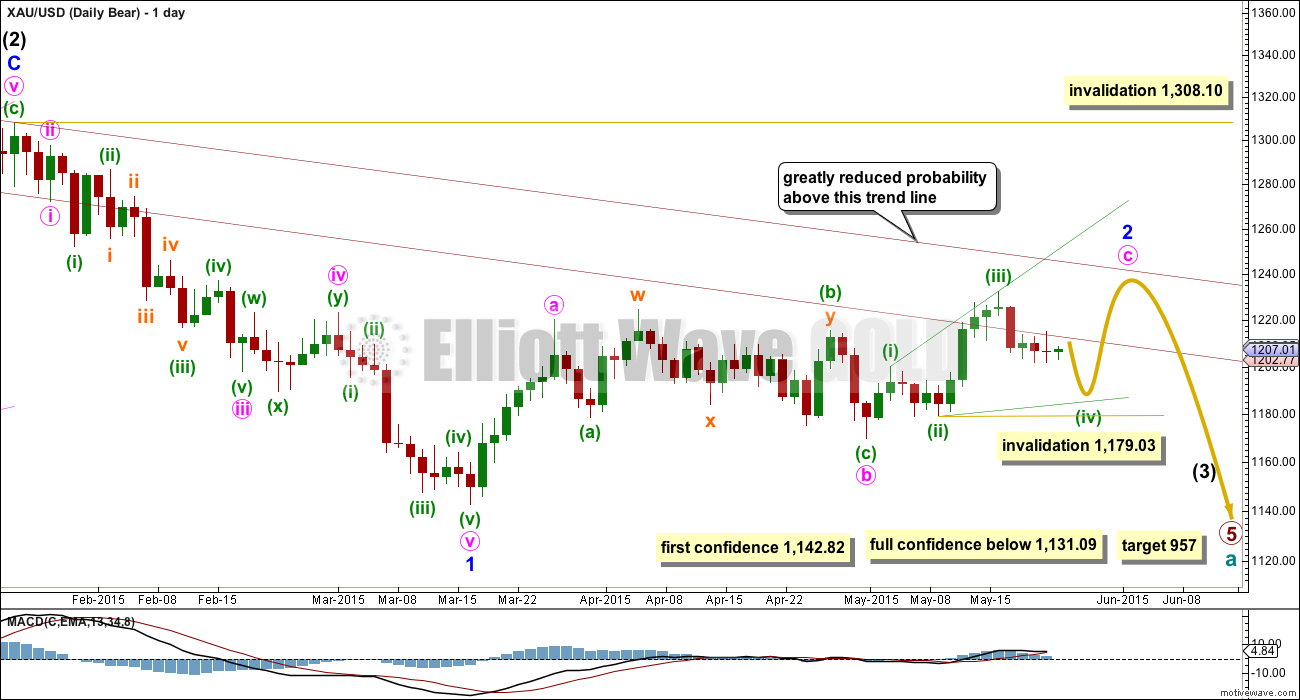
This wave count follows the bear weekly count which sees primary wave 5 within cycle wave a as incomplete. At 957 primary wave 5 would reach equality in length with primary wave 1.
Pros:
1. Intermediate wave (1) (to the left of this chart) subdivides perfectly as a five wave impulse with good Fibonacci ratios in price and time. There is perfect alternation and proportion between minor waves 2 and 4.
2. Intermediate wave (2) is a very common expanded flat correction. This sees minor wave C an ending expanding diagonal which is more common than a leading expanding diagonal.
3. Minor wave B within the expanded flat subdivides perfectly as a zigzag.
Cons:
1. Intermediate wave (2) looks too big on the weekly chart.
2. Intermediate wave (2) has breached the channel from the weekly chart which contains cycle wave a.
3. Minor wave 2 is much longer in duration than a minor degree correction within an intermediate impulse normally is for Gold. Normally a minor degree second wave within a third wave should last only about 20 days maximum. This one is in its 49th day and it is incomplete. It is now starting to look ridiculous; this is becoming a serious problem for the bear wave count.
4. Within minor wave 1 down, there is gross disproportion between minute waves iv and ii: minute wave iv is more than 13 times the duration of minute wave i, giving this downwards wave a three wave look.
This bear wave count now needs minute wave c upwards to complete as a five wave structure which looks most likely at this stage to be an ending expanding diagonal.
Minor wave 2 may not move beyond the start of minor wave 1 above 1,308.10. However, this wave count would be substantially reduced in probability well before that price point is passed. A breach of the upper maroon trend line, a parallel copy of the upper edge of the channel copied over from the weekly chart, would see the probability of this wave count reduced so much it may no longer be published before price finally invalidates it.
There are only two structural possibilities for minute wave c. It must be a five wave structure so it may be only an impulse or ending diagonal. The two wave counts for this bear count will look at both of those structural possibilities. The main hourly wave count follows on from the labelling here on the daily chart, and expects minute wave c is unfolding as an ending expanding diagonal. This has a higher probability than the alternate at this stage.
Main Bear Hourly Count
Click chart to enlarge.
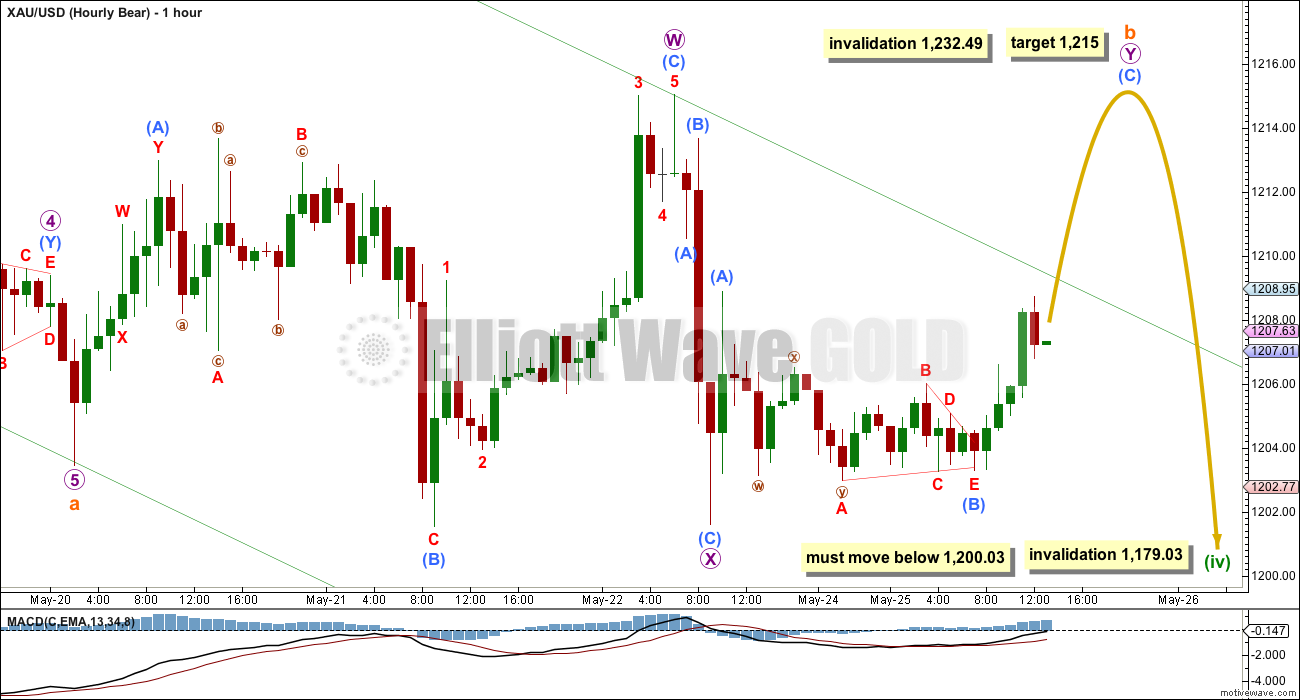
The main hourly bear wave count is almost the same as the main hourly bull count. This means there is little divergence in expectations between the two counts for this week.
The target for subminuette wave b to complete is the same at 1,215. The structure here is seen in the same way, an incomplete double combination.
Thereafter, for this bear wave count subminuette wave c may be shorter than the main bull wave count expects for its C wave down. Here subminuette wave c may only reach 0.618 the length of subminuette wave a, and may only be about 18 in length.
Minuette wave (iv) of this ending expanding diagonal must overlap back into minuette wave (i) price territory so it must move below 1,200.03. It may not move beyond the end of minuette wave (ii) below 1,179.03.
Alternate Bear Hourly Count
Click chart to enlarge.
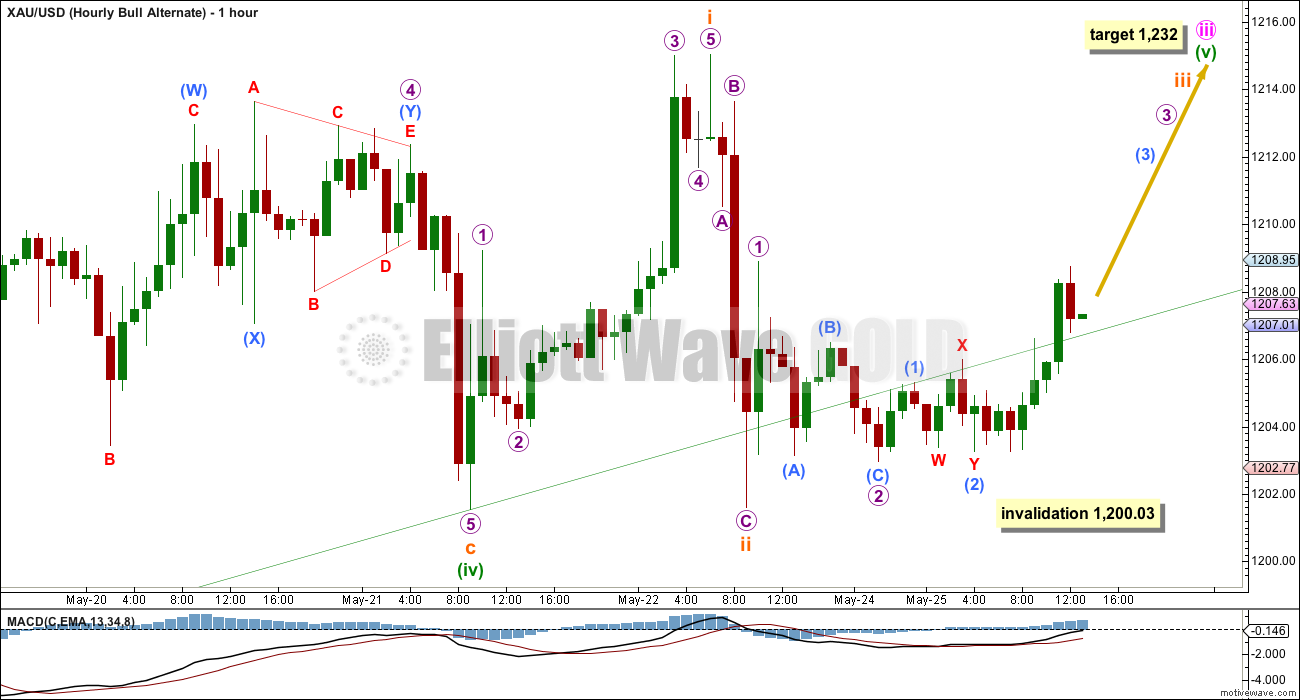
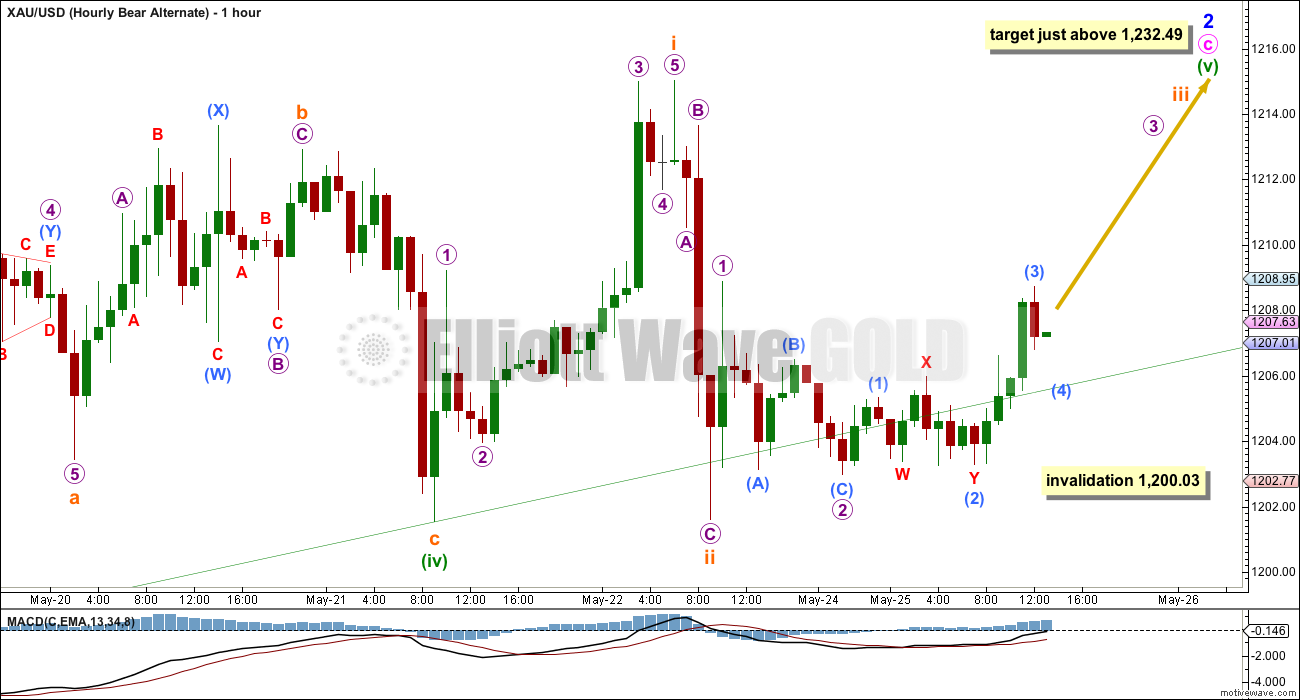
Like the alternate bull hourly wave count, this alternate bear wave count expects a strong third wave up to be in its early stages. This does not look right today.
Minuette wave (v) would avoid a truncation if it moves at least slightly above the end of minuette wave (iii) at 1,232.49. About this point, it would also reach equality in length with minuette wave (i).
If minute wave c is an impulse, then minuette wave (iv) within it may not move into minuette wave (i) price territory below 1,200.03. That is the price point which differentiates the diagonal from the impulse.
Technical Analysis
Click chart to enlarge.
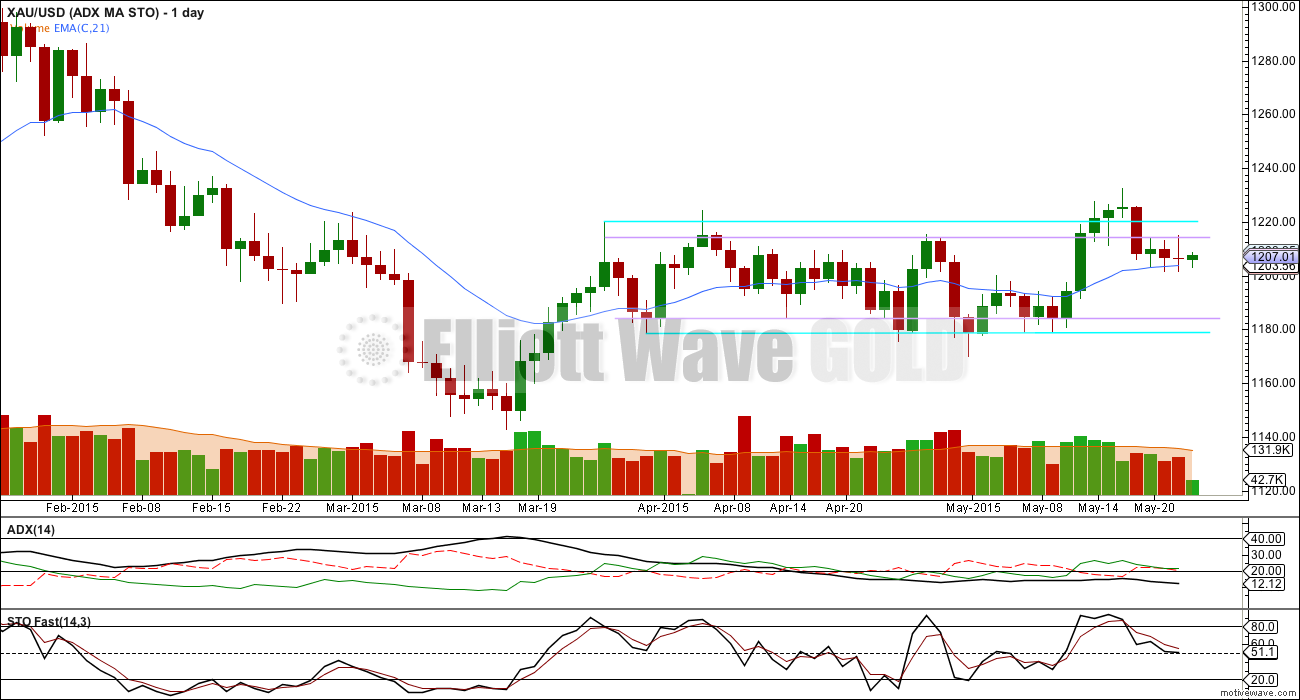
ADX continues to decline; the ADX line at 12.12 is below 15. This continues to indicate there is no clear trend. Short swings and low volatility should be expected to continue. Gold remains range bound within the price range it entered on 27th March.
If some kind of diagonal is unfolding, then low volatility and no clear trend would be expected. Diagonals have many corrective properties: they unfold as a series of zigzags and the fourth wave overlaps into first wave price territory. The regular technical analysis picture fits nicely with the main bull and main bear wave counts.
If we see more downwards movement this week, then stochastics may return down to oversold territory, or at least to 20 or slightly above. If this happens, then an end to the downwards swing may be expected and another upwards swing may begin from there.
While Gold remains within a consolidation phase, a range trading system should be employed as opposed to a trend trading system. Acknowledgement that range trading systems are more risky than trend trading systems is essential to manage risk. Range trading systems are more suitable for experienced traders and not as suitable for beginners.
This analysis is published about 05:07 p.m. EST.
This is for Mark. I really have enjoyed your input, charts and analysis. It seems to me that most of the time you are spot on. Is there another place you plan to post when your done here. It looks like you have several people who are following you including myself
The b wave was obviously complete as a single expanded flat, it didn’t move further sideways as a double combination. This downwards movement is the final C wave of a zigzag down for both bull and bear wave counts.
It looks most likely that the C wave down is currently in a small fourth wave correction which should move sideways in a very small range for a few hours yet, and be followed by a short final fifth wave down. The best place to see where that may end is the green downwards sloping channel on the main hourly charts for bull and bear. That lower trend line is currently showing where price is finding support. It may continue to do so.
There’s not much room left for downwards movement. The maximum limit for bull count is 1,178.08 and for the bear count is 1,179.03.
It’s also possible that the C wave down is complete if it’s fourth wave was much more brief than it’s second wave. That would look odd, but it’s possible. The price point which will tell us the C wave down is over is at 1,201.60. A new high above that point tells us it can’t be a fourth wave correction within C down, so C down must be over. At that stage a new high above 1,232.49 would be required for both bull and bear wave counts.
The regular TA picture sees downwards movement almost over too. It may touch the lower lilac trend line, which provided support on 14th April. That may be where this move ends too.
I’m leaving comments now to write that up.
Tham,
Hello. (hope you’re awake) Do you think minute iv is over or is there more downside? I just entered a bullish trade– probably smarter if I asked you first then clicked. 🙂
Hi dsprospering. I am too lazy to count the sub-sub-sub … waves. The drop could already be over or only subminuette 3 (of minuette c of minute 4) is over. Even if the drop is not over yet, the last drop will not be very large, at most I reckon down to 1181 or so, my second target.
I’ll wait a little longer to enter a bullish trade. Normally, I only enter after a small rise and then a dip NOT BELOW the previous low. That is for insurance, just don’t wish to get stopped out.
I would agree with the price points that you list here, but it won’t happen that quickly. My best guess would be that it should take another 24-48 hours for the C wave to complete on the downside. A small 4th wave within it needs to complete, which should take gold back into the lower 1190s, then a short 5th wave down to the low 1180s.
Thanks Matthias for your input. I can handle 24-48 hrs – good to know where you think the low is.
You’re welcome.
It appears that the current Disquis mode is using alternate names for some of us. I am a.k.a. “Matt.”
ah yes subminuette 3 of C explains why price was hanging around (in 4). Good to know last drop not very large. See you are waiting, should have asked you first! Ha. It’s all good. I didn’t start with hourly chart today so went in early. Hopefully this will be profitable for many. Thanks for ur response.
How do you allegedly start the next leg up now to gold 1320 with the GDX getting rejected hard at multi-year TL resistance and 200MA resistance?… and now heading to $17 where it could easily break down from an H&S pattern. It’s shown every sign of an exhaustion reversal right where it would be expected (if it were going to happen) and now Friday’s commercial COT position is crazy short gold and silver. Suddenly interpolations of standard retracements become the basis of “safe sequences of trades”. Sorry…my last post was going to be Friday….perhaps Bill Carson should pipe in again and explain why shorting resistance at $21 doesn’t work…that would be assuring.
Have you been reading the Elliott Wave analysis above? If you have, then there’s your answer about ‘how’.
I don’t understand why you would join this site and then pretend like the Elliott Wave analysis doesn’t exist while trying to argue with people who are here for this analysis specifically.
Hi Ben. I’m glad that there is at least one person who finds the attitude of some individuals in this forum appalling.
I welcome criticisms as well as diametrically opposing views in a civil gentlemanly manner, not a confrontational stance. In this way, we can all learn from each other and benefit collectively. There are a myriad ways to forecast market moves, be it EW, price movements, Gann charts, indicators, chart patterns, and even fundamental analysis. No one method can be said to reign supreme. All are mathematical models that try to project future moves in a non-linear entity. In some instances, some method may be more accurate, and in another, may be dead wrong. To be biased in one method and put down all others is not right.
I have been very polite in all my posts as I sincerely hope to share whatever knowledge I have with others. If many feel that I am not doing the right thing, then I don’t feel that I ought to continue here, and just keep my thoughts to myself.
Agreed. You do a nice job of stating your perceptions and analysis.
Thanks for your kind compliments.
Mark, I’m so glad you haven’t left. Saw your post Friday(?) and want to tell you your charts have been a w o n d e r f u l addition to this site’s blog! Was really upset to see you say you were not going to post anymore. Why not?
Don’t go. You’re valued!
My subscription will not renew after the end of the month. I gave it two months to see if good EW analysis would be a good supplement to my own TA. Unfortunately it just doesn’t seem to give me any additional insight for my style of trading. I do believe Lara’s understanding of EW is rock solid and I know it is helpful to many of you. I really don’t need to stick around just to blog here.
Mark, I have also enjoyed your posts and hope you will continue but if you do not, is there another forum I might follow your market opinions?
understood.
Oh. I reread my post. There is a typo. Too used to Disqus with its edit feature. I had meant 1230, not 1320. That is where minute 5 ends.
You work under the assumption that GDX and gold have a very good correlation. I think they are two separate entities. GDX may plunge but gold may rise a bit.
Since we do not agree on things, there is not much point in continuing this discourse. I work my way, and you work yours. As long as we make profits, it doesn’t matter who is right.
Tham
How Lara will conclude between bull or bear during one more wave up for gold high?
There are two invalidation price points for bear 1308 and for bull 1131. These are toooo far apart.
Wave structure is going up may not be definitive to determine bear/bull.
Thanks.
As I see it, after today’s price drop which completes minute 4, there will be a wave up targeting at least 1320. When that is reached, price will drop again.
Now, the magnitude of the fall will distinguish between bull and bear. Bull will drop back to about the same point as minute 4 and then turn up towards Lara’s target of 1320. Bear will continue to drop past that point, down towards Lara’s target of 957. So, this yields a very safe sequence of trades. One up, and one down. I will just go for these macro trades, and not worry about the intraday. They are juicy enough.
“So, this yields a very safe sequence of trades.” Where on earth does this statement come from??? What could possibly be the basis of calling this complete speculation with not a single technical point of reference a “very safe” sequence of trades?
My extrapolation of prices based on standard movements.
well that’s comforting.
As you know if gold above 1308 bear count is no longer valid. That means you are saying gold is in multi year bull trend if gets to 1320??????
Let’s take it one step at a time. The further the projection the less accurate it is. There are too many variables that can alter the prescribed course of action. This is one of the tenets of Chaos Theory. By extrapolating more than one day in advance, I am already stretching my “luck”.
All alternate hourly bull and bear wave counts are invalidated.
Gold has only pm bull and bear hour wave counts valid.
Hi papudi.
I have other ideas. I think the bull hourly alternate has been invalidated, and all the rest need to be reworked.
I have the count as a simple 3-wave decline for minute 4. Minuette a and b have completed. The large drop we are seeing is the standard behaviour of the final c wave down. This wave must subdivide into 5 waves. We are still dropping in the third wave (subminuette 3). I think the drop should complete around 1186, worst case 1181. Subminuette 2 was quite lengthy, so subminuette 4 should be quite fast. I expect the drop to complete by today’s trading session. Then, minute 5 will rise quite significantly. This is hiw I will trade today.
Reread the reply, but could not edit, so I clarify this. The drop to 1186 is the end of minute 4 (because as it stands it could have been interpreted as subminuette 3). Apologies.
Hi. I am just wondering – if Gold price does break below 1192 today that would likely open up downside risk 1148 and probably also signal that a top at 1232 is in. Currently upside risk is no more than 1214-15 subject to Gold price rise through 1207-09…. Time and price will tell I guess. Thanks
I agree with you Syed. But I think it will not be smooth sailing. There needs to be a rebound to complete the larger wave count first. Following that, it is either bull or bear. Bull will race to new highs, while bear will complete the long-awaited correction down to the 1100/1000 region.
Tham
Lara’s wave count is very accurate. Gold is trading at 1196. Both bull and bear hour counts are same.
Gold did not make the high of 1217 before trading lower.
Does it make any difference in wave count??
Thanks in advance.
Ever since I joined Lara’s advisory service I have developed confidence in gold.
Thanks Lara.
You’re welcome.