
A little more downwards movement was still allowed for. The invalidation points are now extremely close by, but still not breached.
Summary: Both bull and bear wave counts still expect upwards movement for a few days. The bull wave count has a minimum requirement at 1,232.49 and a maximum at 1,242.91. Upwards movement for the bull count may last about five days. The bear count requires upwards movement to a minimum at 1,233.82 and its maximum is the upper maroon trend line on the daily chart. It may last a little longer, maybe eight days. I favour the bull wave count.
To see weekly charts for bull and bear wave counts go here. Changes to last analysis are italicised.
Bull Wave Count

Click chart to enlarge.
The bull wave count sees primary wave 5 and so cycle wave a a complete five wave impulse on the weekly chart.
Pros:
1. The size of the upwards move labelled here intermediate wave (A) looks right for a new bull trend at the weekly chart level.
2. The downwards wave labelled intermediate wave (B) looks best as a three.
3. The small breach of the channel about cycle wave a on the weekly chart would be the first indication that cycle wave a is over and cycle wave b has begun.
Cons:
1. Within intermediate wave (3) of primary wave 5 (now off to the left of this chart), to see this as a five wave impulse requires either gross disproportion and lack of alternation between minor waves 2 and 4 or a very rare running flat which does not subdivide well.
2. Intermediate wave (5) of primary wave 5 (now off to the left of the chart) has a count of seven which means either minor wave 3 or 5 looks like a three on the daily chart.
3. Expanding leading diagonals (of which intermediate wave (A) or (1) is) are are not very common (the contracting variety is more common).
4. The possible leading diagonal for minor wave 1 and particularly minute wave ii within it look too large.
For volume to clearly support the bull wave count it needs to show an increase beyond 187.34 (30th April) and preferably beyond 230.3 (9th April). Only then would volume more clearly indicate a bullish breakout is more likely than a bearish breakout.
Within cycle wave b, primary wave A may be either a three or a five wave structure. So far within cycle wave b there is a 5-3 and an incomplete 5 up. This may be intermediate waves (A)-(B)-(C) for a zigzag for primary wave A, or may also be intermediate waves (1)-(2)-(3) for an impulse for primary wave A. At 1,320 intermediate wave (C) would reach equality in length with intermediate wave (A) and primary wave A would most likely be a zigzag. At 1,429 intermediate wave (3) would reach 1.618 the length of intermediate wave (1) and primary wave A would most likely be an incomplete impulse.
Intermediate wave (A) subdivides only as a five. I cannot see a solution where this movement subdivides as a three and meets all Elliott wave rules (with the sole exception of a very rare triple zigzag which does not look right). This means that intermediate wave (B) may not move beyond the start of intermediate wave (A) below 1,131.09. That is why 1,131.09 is final confirmation for the bear wave count at the daily and weekly chart level.
Intermediate wave (B) is a complete zigzag. Because intermediate wave (A) was a leading diagonal it is likely that intermediate wave (C) will subdivide as an impulse to exhibit structural alternation. If this intermediate wave up is intermediate wave (3) it may only subdivide as an impulse.
It is possible that the intermediate degree movement up for the bull wave count is beginning with a leading diagonal in a first wave position for minor wave 1.
A leading diagonal must have second and fourth waves which subdivide as zigzags. The first, third and fifth waves are most commonly zigzags but sometimes they may be impulses. The fourth wave must overlap first wave price territory.
Within diagonals, the most common depth of the second and fourth waves is between 0.66 and 0.81. Minute wave ii is 0.67 of minute wave i. So far minute wave iv is 0.88 of minute wave iii, a little deeper than normal range.
The maximum depth for minute wave iv is at 1,178.08 where it would reach equality in length with minute wave ii. Because the diagonal is contracting the fourth wave may not be longer than equality with the second wave, should be shorter, and the trend lines should converge. Minute wave iv is now extremely likely to be over.
Second wave corrections following leading diagonals in first wave positions are commonly very deep. When this leading diagonal structure for minor wave 1 is complete, then minor wave 2 should unfold lower, may be expected to reach at least the 0.618 Fibonacci ratio of minor wave 1 or may be quite a bit deeper than that, and may not move beyond the start of minor wave 1 below 1,142.82.
Click chart to enlarge.
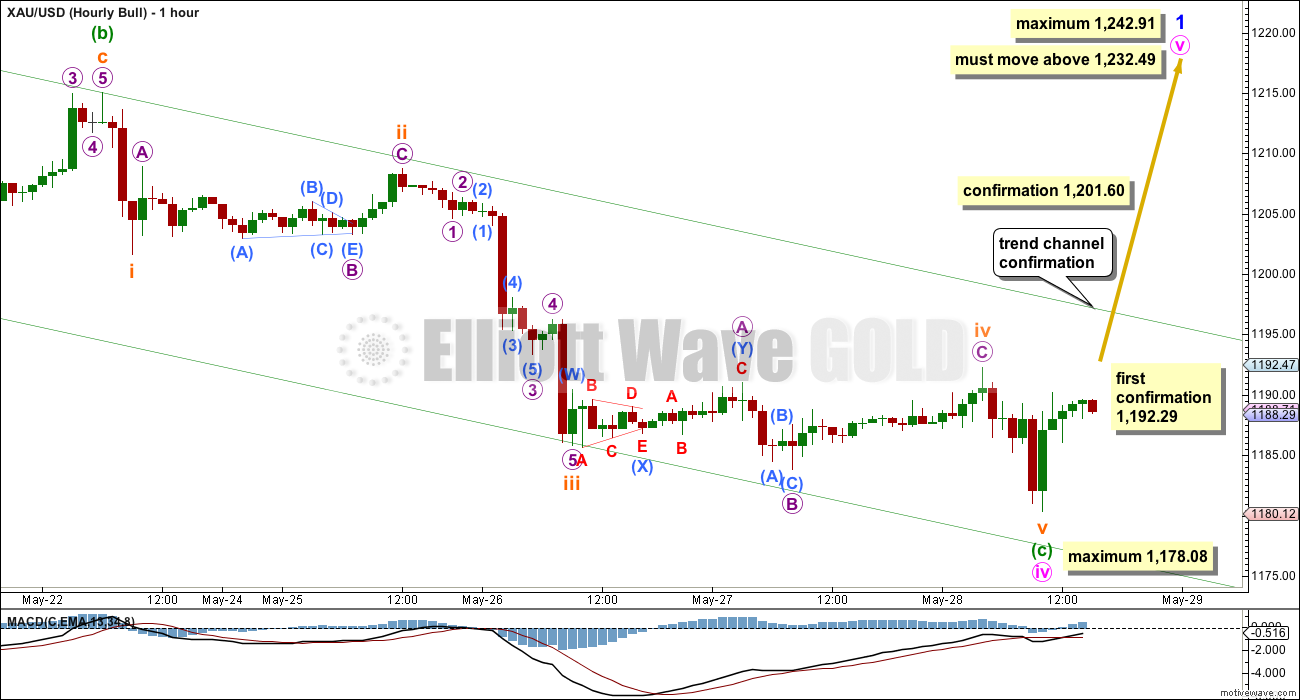
Downwards movement to a new low was the final fifth wave, after subminuette wave iv moved further sideways as an expanded flat correction.
Minuette wave (c) now has a good five wave look to it on the hourly and daily charts.
There is still no adequate Fibonacci ratio between subminuette wave v and either of i or iii, but it is close to equality to subminuette wave i now that it is longer.
A new high above 1,192.29 could not be a second wave correction within subminuette wave v, so at that stage submineutte wave v would have to be over. It looks extremely unlikely that subminuette wave iv could continue even further sideways as a double flat, but that would remain technically possible.
Subminuette wave iv may not move into subminuette wave i price territory above 1,201.60. A new high above this point would confirm minuette wave (c) as complete.
A breach of the channel about this downwards zigzag would provide a lot of confidence that there has been a trend change and the next upwards swing has begun.
While we have zero confirmation that there has been a trend change, the risk remains that I’m wrong and price will continue lower past the invalidation points for both bull and bear wave counts. I am looking for an alternate wave count which would allow for this, but so far I cannot find one which meets all Elliott wave rules and has the “right look”.
Depending on your risk appetite and approach to this analysis, you may or may not want to wait for one or more of the conditions to be met before you have confidence that an upwards wave will unfold from here.
Within the leading diagonal, minute wave v may not be truncated and must move above 1,232.49.
The diagonal is contracting. Minute wave v may not be longer than equality with minute wave iii. Its maximum is equality with minute wave iii at 1,242.91.
Minute wave v may take a Fibonacci five days to unfold.
Bear Wave Count
Click chart to enlarge.
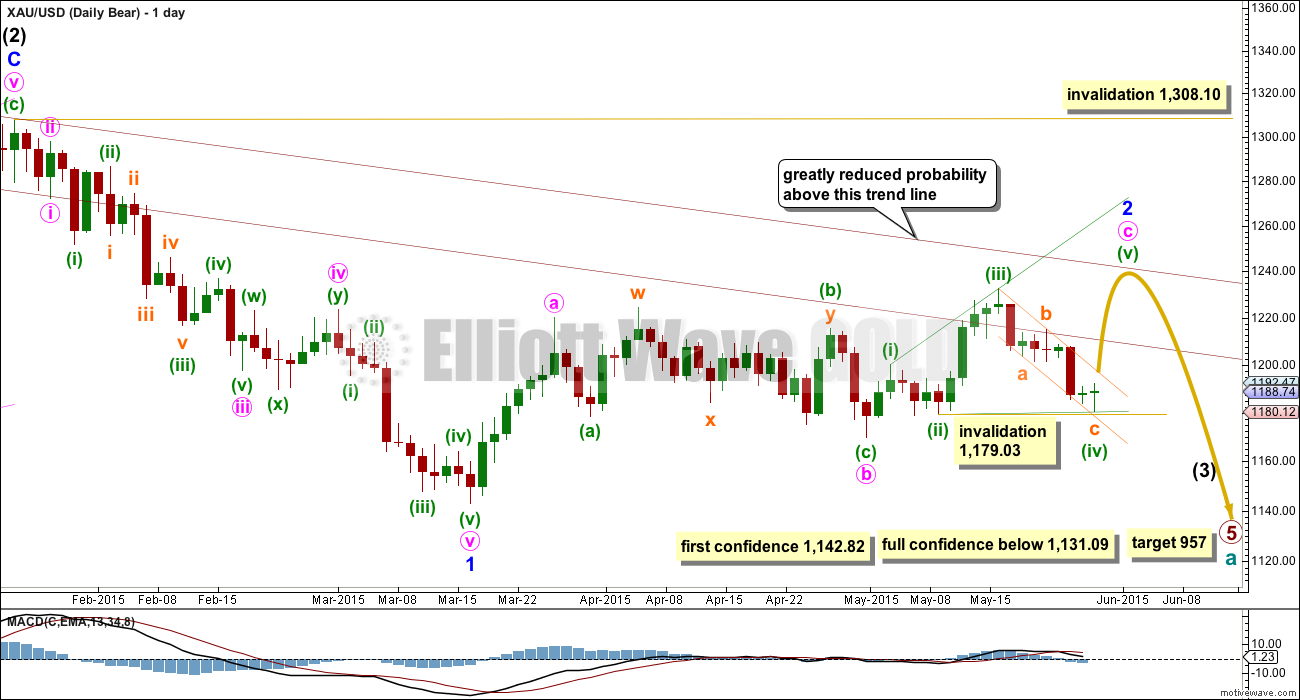
This wave count follows the bear weekly count which sees primary wave 5 within cycle wave a as incomplete. At 957 primary wave 5 would reach equality in length with primary wave 1.
Pros:
1. Intermediate wave (1) (to the left of this chart) subdivides perfectly as a five wave impulse with good Fibonacci ratios in price and time. There is perfect alternation and proportion between minor waves 2 and 4.
2. Intermediate wave (2) is a very common expanded flat correction. This sees minor wave C an ending expanding diagonal which is more common than a leading expanding diagonal.
3. Minor wave B within the expanded flat subdivides perfectly as a zigzag.
Cons:
1. Intermediate wave (2) looks too big on the weekly chart.
2. Intermediate wave (2) has breached the channel from the weekly chart which contains cycle wave a.
3. Minor wave 2 is much longer in duration than a minor degree correction within an intermediate impulse normally is for Gold. Normally a minor degree second wave within a third wave should last only about 20 days maximum. This one is in its 52nd day and it is incomplete. It is now starting to look ridiculous; this is becoming a serious problem for the bear wave count.
4. Within minor wave 1 down, there is gross disproportion between minute waves iv and ii: minute wave iv is more than 13 times the duration of minute wave i, giving this downwards wave a three wave look.
This bear wave count now needs minute wave c upwards to complete as a five wave structure which looks most likely at this stage to be an ending expanding diagonal.
Minor wave 2 may not move beyond the start of minor wave 1 above 1,308.10. However, this wave count would be substantially reduced in probability well before that price point is passed. A breach of the upper maroon trend line, a parallel copy of the upper edge of the channel copied over from the weekly chart, would see the probability of this wave count reduced so much it may no longer be published before price finally invalidates it.
When the ending diagonal structure is complete, then this bear wave count expects a strong third wave down for minor wave 3 within intermediate wave (3). At that stage, a new low below 1,142.82 would provide strong indication that the bear wave count would be more likely than the bull wave count. Only a new low below 1,131.09 would provide full confidence.
Click chart to enlarge.
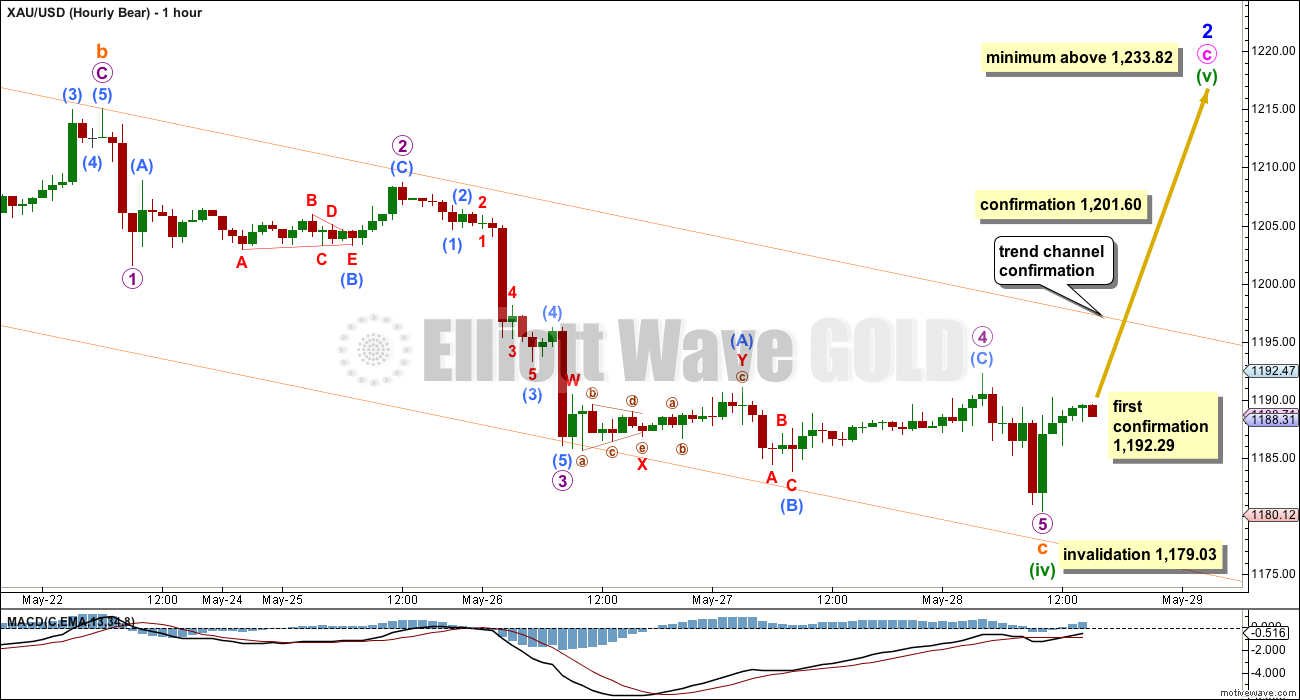
This wave count is mostly the same as the hourly bull wave count. It also requires upwards movement from here.
The diagonal of minute wave c is expanding, so the final fifth wave of minuette wave (v) must be longer than minuette wave (iii). It must move above 1,233.82.
For the expanding diagonal, minuette wave (v) may take a Fibonacci eight days to unfold.
Technical Analysis
Click chart to enlarge.
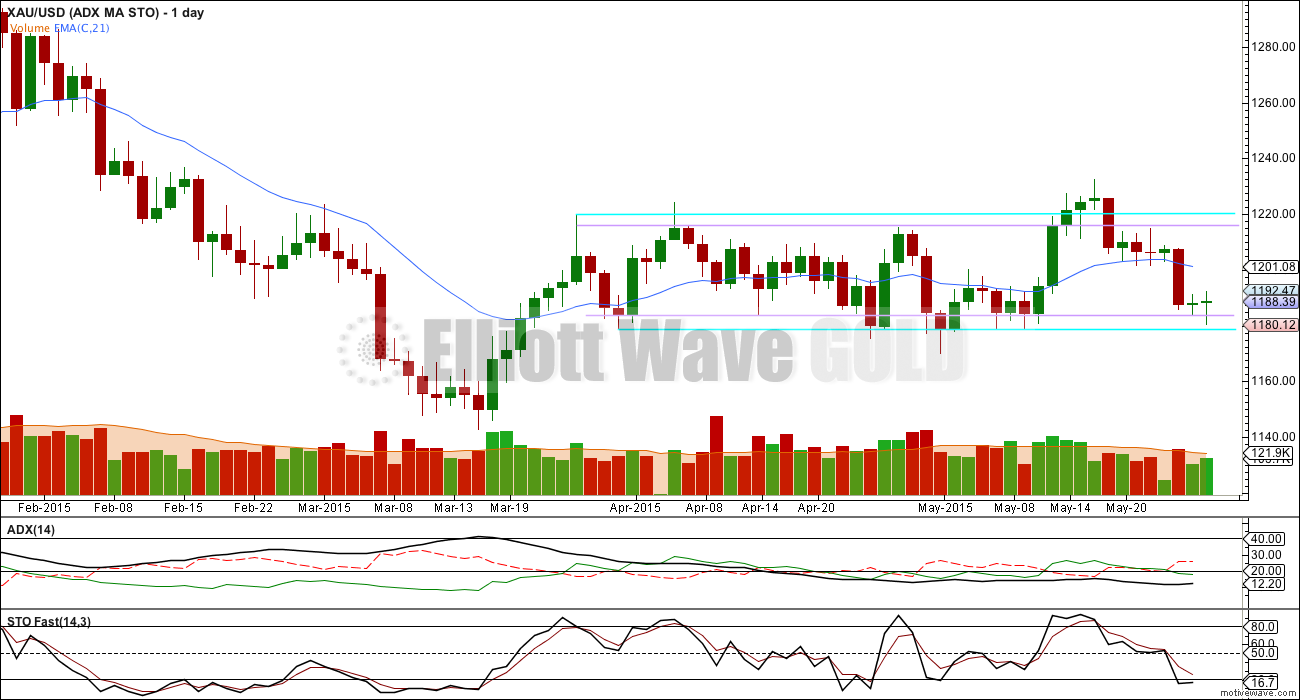
ADX remains flat and below 15 indicating a range bound consolidation phase continues. There is still no clear trend.
Stochastics has now spent a little time in oversold territory. The next upwards swing is now more likely to begin from here today. But it does not have to, price could yet move slightly lower and may even overshoot the lower aqua blue trend line as it has before.
A slight increase in volume for Thursday while price made a new low may indicate the end of this downwards swing.
The lower aqua blue trend line is so far again showing where price is finding support today. As before, this may initiate the next swing up.
This analysis is published about 04:11 p.m. EST.
Richard: I may have unintentionally given one of your postings a thumbs down. If so, sorry. It was just a fat finger mistake that I couldn’t undo. Wasn’t sure how to reply directly to your comment, so I am doing it here. Thought I should mention that next Friday, June 5th, is a significant market shifting day because of the May jobs report. In other words, the timing of an upward move from here would coincide well with that. Upward movement until next Friday, followed by a sharp reversal. On the flipside, it could be the opposite of that too – down now, up later.
Matthias thanks for tip of the May jobs report next Friday June 5th, which also is deadline for next Greece payment they said they can’t pay, although the other parties could agree to a delay.
I wasn’t aware of thumb up or down, not paying attention to them. When it comes to making money those are just distractions anyways.
Lara, it really looked like gold bottomed hard again today and has as you say been at the upper edge of the channel, which is a sign of strength. Gold already passed first confirmation above 1192.29. You mentioned the risk is wrong wave count and move strongly lower. Both hourly bull and bear wave counts are bullish.
I would think that would increase the probability more than a 50%.
Possibly. I guess I’m nervous about this call because the invalidation points are so close by.
When I look at the alternate bear count (which is the only decent scenario I have been able to see which expects a downwards breakout) it doesn’t look like it has a higher probability than the main bull wave count. So yes, I would agree the probability of an upwards break from here may be more than 50%.
Lara I appreciate the strong caution you have provided. It goes with the fact there still is no trend and gold has only reached the 1st of 3 levels of confirmation so risk has to be taken seriously. Thank you.
A dollar correction would be nice, but not yet confirmed. I am being cautious and waiting for price confirmations in gold.
Today was another typical day where gold inversely tracked the dollar. It seems apparent to me that the dollar will eventually make new highs, which will, in turn, crush gold. However, the one temporary glimmer of hope that gold has for one last mini-rally is if the dollar consolidates/ corrects some here. While I am not certain, it does look like the dollar may have completed a first wave up and has perhaps started a second wave correction. It won’t be anything major, but it may provide gold a small window for upward movement.
Matthias that sounds good to me just a short window of time for gold to drop about a week for gold to rally and I sell.
I meant 1 week for the US dollar to drop and gold to rally.
Interest gold chart compared to several currencies since 2013
The Chart above compares Gold, USD, Euro, Pound and the HUI.
http://seekingalpha.com/article/3217846-gold-has-2-major-hurdles-to-overcome
I was thinking of taking a nap, but this market is to exciting!
Edge of your seat nail biting heat of the moment excitement. Don’t blink!
3rd wave for nugt coming up! I will start scaling in under 10.90!
Any wave counts or how low this retrace now at 11:04 am EST may drop down to?
I am seeing two first and second waves up now, 1-2, 1-2. With it currently in the second 2. It could go as low as 1,185.82. Price is finding resistance right at the upper edge of the channel…. once it breaks through it should find support. But while it remains in that channel the risk is the wave count is wrong and it will move strongly lower not higher… when its ready to move.
Jaf here… what the hell happened to disqus? I havent followed EWG in a long time.. Golds not going anywhere… its still in the same triangle pattern I posted awhile ago. Despite the proportion problems its the only analysis that is making me money; just swing it with the MACD.. when this triangle is finished sometime this summer gold will drop to sub-1000. where do you guys post your charts now? Is this site going downhill? why the change?
reagrds…
We detected a security problem with Disquis. We’re looking for an alternative which allows charts to be uploaded from devices, and are yet to find a solution. For now this comment system is real time (once your first comment is approved). Charts must be uploaded via link. So you’ll need to use a file sharing site to get the link.
Gold jumped a lot same minute US GDP data news at 8:30 am EST.
Then it did a retrace.
It is very good gold got first confirmation with movement above 1192.29 both charts.
Gold is getting ready to explode hopefully to upside…can’t remember the last time it traded in a $3 range for more than 12 hrs like it has now.
Might stay tight today for month end.
GDX chart with some upside gap fill targets before drop.Article Link
This is the chart that I tried to upload yesterday. It’s an alternate idea at primary degree. I consider it to have an extremely low probability.
Lara, how do you upload a chart from your camera roll on an iPad? With these new comments, it asks for a url when you click on the camera. With Disqus, all I had to do was select the chart.
You need to upload a chart somewhere else, a file sharing site, and then provide a url. We still cannot find a solution where we can upload a chart from a device. It’s a pain I know. There are some technical issues with the website, we will be resolving those over a weekend (next), but for now this comment system is better than wordpress.
Friday 8:30 am EST US GDP data
GDP report expected to show shrinking economy
http://www.usatoday.com/story/money/business/2015/05/28/gdp-economy/28127283/?utm_source=feedblitz&utm_medium=FeedBlitzRss&utm_campaign=usatodaycommoney-topstories
We have wave surfer and also analyst- Skier.
His analysis also calls for long term bullish.
“Conclusion
The USERX and gold run patterns, as well as the negative divergences between gold and the gold stocks became pronounced to the bearish side on 5/13/15-5/15/15. Therefore, last week’s decline was expected. The more important intermediate-term and even long-term trend possibilities have not been clarified by the market’s behavior since the last SKI Report: It is still possible that the long-term trend turned higher on the 12/16/2014 index and run pattern buy signals, but the indices have not generated a bull market buy signal.
As this 3-day holiday weekend ends, a significant turn becomes more likely. Mechanical SKI remains on its 35-39 index buy signal, but that is definitively NOT a bull market. A bull market requires that SKI be on a 92-96 index buy signal. That index does have the opportunity to sell and re-buy for a potential bull market over the next several weeks because (if you look back 92-96 trading days) its back prices are about to rise and PEAK in the USERX 5.95 – 6.22 area during the next 2 weeks (as of this Tuesday, the 92-96 index’s back prices will be from 1/06/2015 – 1/12/15). If USERX can stay below those back prices to sell the 92-96 index (almost always on a decline) and then re-buy the index as its back prices subsequently decline, we do have the potential for a long-term rise. As of now, that has NOT happened. And, as per the report from 3 weeks ago, it’s the sell-stop that matters here.”
http://www.321gold.com/editorials/kern/current.html
SENTIMENT: Notwithstanding the fabulous analysis above, a bullish key reversal off the 1180.20 low appears to suggest that a rally / upturn is possible. However, as yet it is hard to see Gold price get past 1190-92 for 1196-97 limiting…. But these things have a way of changing on the spin of a coin lol…. Gold price remains bearish, down trending, oversold and likely to get more oversold before reversing. I remain cautiously short to target a break below 1187 for 1182 and possibly lower 1176…. //// DMI+ is below DMI- (bearish, indicative of down trending), ADX is rising favoring continuation of the down trend…. //// Good luck folks, this is a difficult one to catch, I would not want to get caught on the wrong side of the fence, hard to tell ~!
You wrote above”ADX is rising favoring continuation of the down trend”.
I do not understand black line ADX. How to interpret this line? As price rises this line supposed to rise and cross over the red/green line etc.
Can you shed some lite on this?
Thanks.
Hi Papudi: On the daily, currently ADX reading is 13.115. It was below 10 some time ago and has risen from 12.xxx since yesterday. The way I see it, because DMI+ve remains below DMI-ve (+ve had crossed below -ve some days ago) is indicative of bearish down trending and with a rising ADX further favoring downside continuation…. Got to run, say with Lara’s analysis. Oversold stochastic and a bullish key reversal favors a price rise. Remains to be seen how much juice it has in it and how far up Gold price can get. The key would probably be if Gold price can rise above 1213…. Good luck~!
Thanks for reply.
I do not have intraday capability for gold contract. If you do you will notice that +Dm has turn and -Dm has turn down. Plus gold has bullish engulfing for the day.
The black ADX line only indicates if the market is trending or not trending. Below 15 = no clear trend. 15 – 20 and rising ADX = the beginning of a trend.
When it’s below 15 indicating no clear trend then short swings, a range bound consolidation phase is expected. In this situation the +DX and -DX lines will repeatedly cross over, and so they’re not necessarily going to be useful in showing what direction the eventual breakout will be.
Look at how they’ve behaved on Gold since 27th March. They constantly cross.
Notice also how we only have ADX data for yesterday. Look back and see how useful it would have been to use the +DX and -DX lines with only the prior day data during this range. In short, it wouldn’t have been useful at all.
That is why I have Stochastics. Using the trend lines, and overbought and oversold from Stochastics, tells us reasonably well when to expect each swing to end and the next to begin.
This will work as long as price remains range bound. It will not work when price breaks out.