
US Oil continues to behave as expected.
Summary: Upwards movement is very close to completion. The target is at 64.39.
Click chart to enlarge.
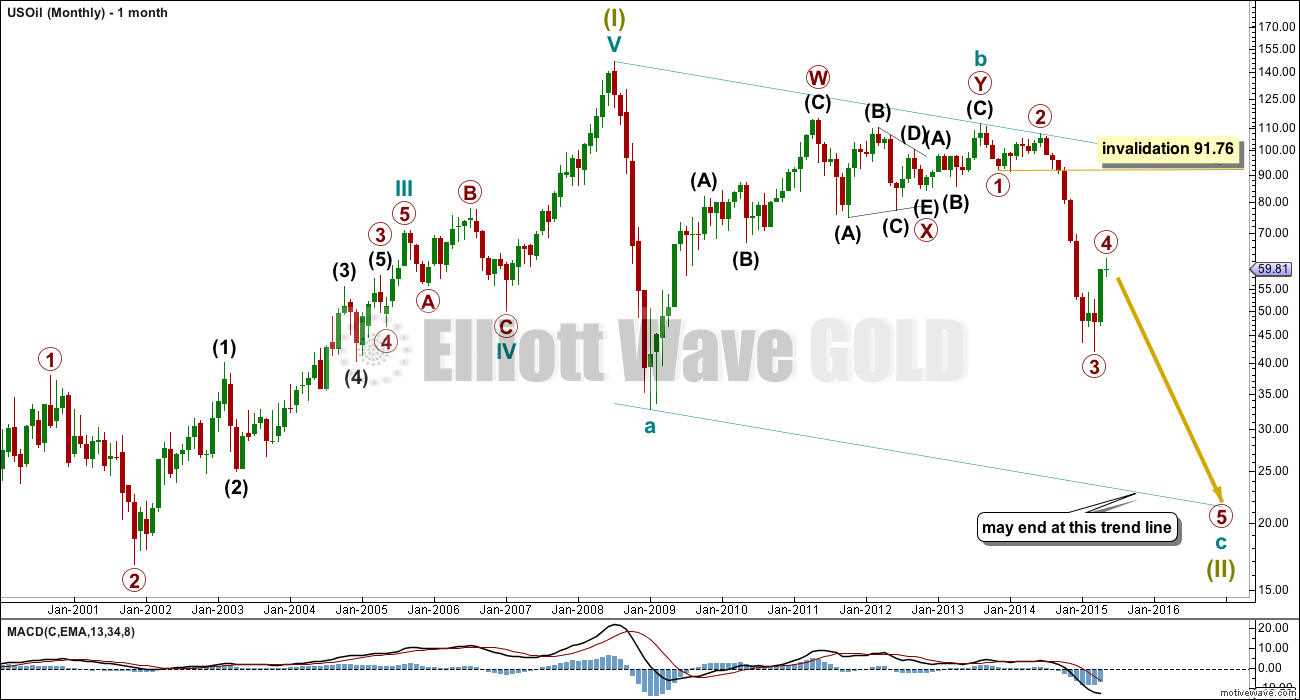
This wave count sees US Oil as within a big super cycle wave (II) zigzag. Cycle wave c is highly likely to move at least slightly below the end of cycle wave a at 32.70 to avoid a truncation. Cycle wave c may end when price touches the lower edge of the big teal channel about this zigzag.
Within cycle wave c, the degree of labelling has been moved up one degree. Cycle wave c is unfolding as an impulse. Within it, primary waves 1, 2, 3 and now almost 4 are complete. This wave count expects primary wave 5 to be extended which is typical for commodities. When primary wave 4 is complete, then a price target for primary wave 5 may be calculated.
Primary wave 4 may not move into primary wave 1 price territory above 91.76.
Click chart to enlarge.
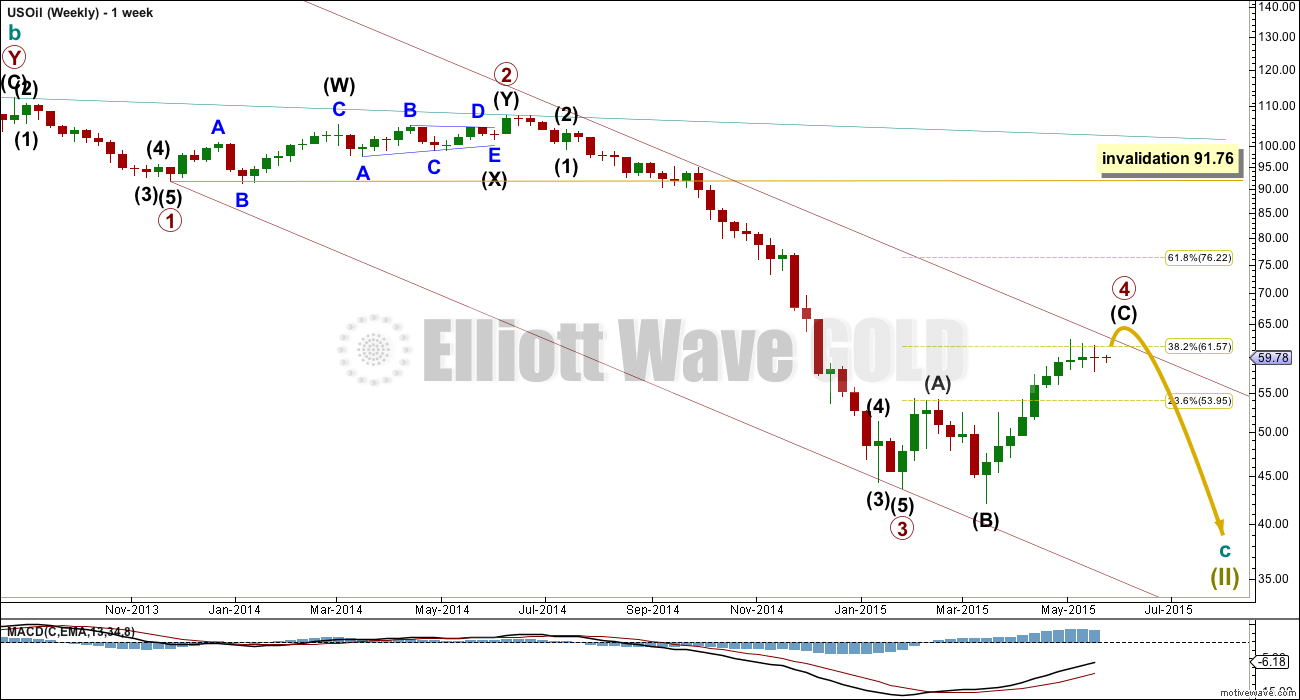
Primary wave 2 was a deep 0.78 double combination structure. Given the guideline of alternation, primary wave 4 may be expected to be more shallow and most likely a zigzag, flat or triangle. At this stage, it looks like primary wave 4 is unfolding as an expanded flat correction. This provides some structural alternation with the combination of primary wave 2.
Within primary wave 4, intermediate wave (C) has passed 1.618 the length of intermediate wave (A) and the structure is still incomplete. Intermediate wave (C) may not exhibit a Fibonacci ratio to intermediate wave (A). Minor wave degree would be better to calculate a target for this upwards movement to end.
The channel about cycle wave c is drawn here as a best fit. Primary wave 4 may find resistance about the upper edge, and this may be where upwards movement ends.
Click chart to enlarge.
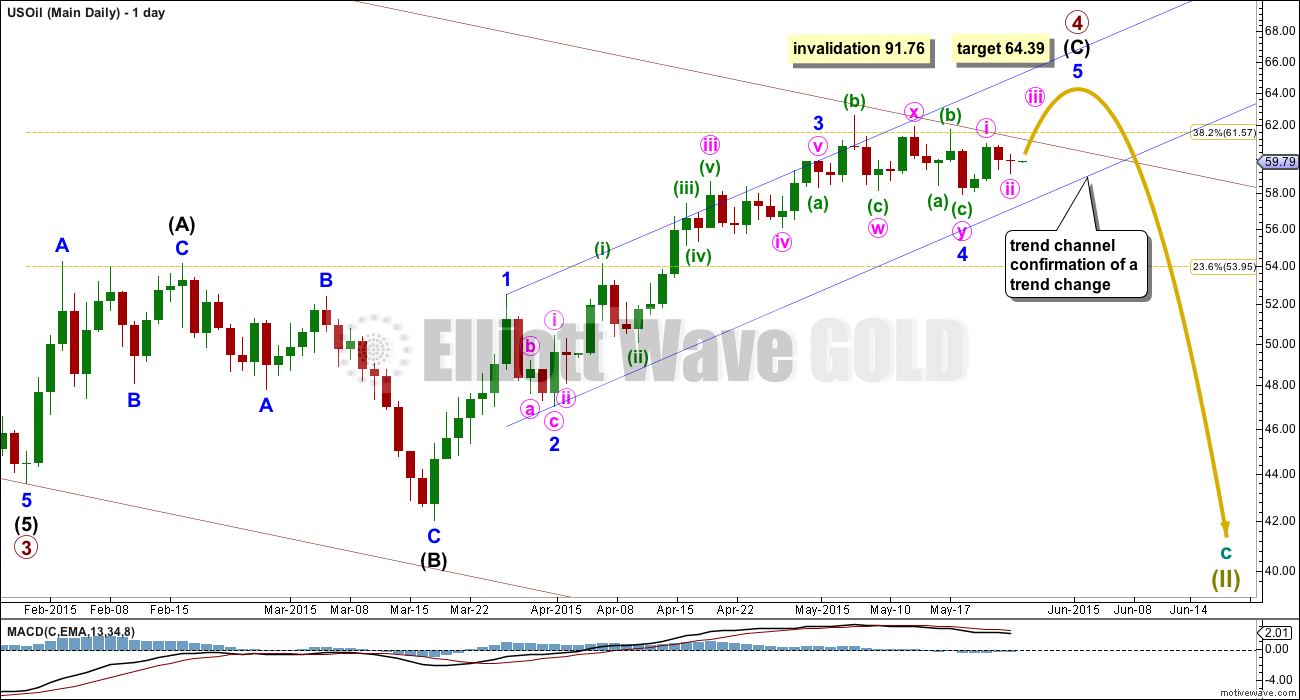
Intermediate wave (C) must subdivide as a five wave structure, and is unfolding as an impulse.
There is no Fibonacci ratio between minor waves 1 and 3. This makes it more likely that minor wave 5 will exhibit a Fibonacci ratio to either minor waves 1 or 3. At 64.39 minor wave 5 would reach 0.618 the length of minor wave 1. This ratio may be more likely because it does not allow too much of an overshoot of the upper edge of the best fit channel which is copied over here from the weekly chart.
Draw a channel about intermediate wave (C) using Elliott’s first technique. When there is at least one full daily candlestick below the lower edge of this blue channel and not touching the lower blue trend line, that shall provide trend channel confirmation that intermediate wave (C) is over. At that stage, it would be extremely likely that primary wave 4 in its entirety is over and primary wave 5 down would have begun.
In order to reach the target at 64.39, primary wave 4 will have to break through resistance at the upper edge of the downwards sloping maroon channel. Sometimes fourth waves are not contained within these channels. If that happens as expected, then the channel will be redrawn using Elliott’s second technique to show where primary wave 5 down may find support.
Hi Lara,
Thanks for this great analysis. By the way as my data feed seems different from yours, here’s my wave count: http://s12.postimg.org/qmzbh4s25/oil.png minor 3 is almost 150% the length of minor 1, and minor 4 retrace to 38.2% of minor 3. If minor 4 is over (with that daily pinbar) minor 5 is expected to end at 61.8% of minor 1 around 62.88 or 78.6% at 64.63.
Appreciate your view and comment.
Richard
For US oil I follow only Lara’s EW and then depend on Rambus charting as well as my momentum indicators to trade.
No one else. Just waiting for Lara to declare wave iv is complete.
Cuurently long using UCO with small bite to catch the min wave v to 64+.
Papudi, I know this isn’t breaking news but isn’t wave 4 now in gross disproportion to wave 4? I realize the channel has not had 1 full daily candlestick below it without touching it, but it’s dang close.
As close of today SCO Proshares ultra short 2xetf put in a reversal candle Dark Cloud. A powerful candle. I will not be surprised if SCO goes down tomorrow.
Means US oil have up day. Lara’ target 64+ still possible.
At close to day US oil will breach the channel. Is that means wave c and iv is complete.
UCO 2 hour chart broke below the neckline of HnS pattern.
Lara – today oil traded below wave Y. Does that mean wave Y is not complete yet? OR wave iv is complete?
It means that the fifth wave and so the whole structure for primary wave 4 may well be complete.
But before I have confidence upwards movement is over I want to see that trend channel breached.
As soon as it’s breached I’ll update US Oil analysis and calculate a target for primary wave 5 down.
Thank you very much. I was monitoring the channel during the day.
Thanks for your update on this. (I actually got the a-b-c(X)a-b-c on this marked right) And so I’m glad you’ve responded about this newer low because trading based on upward expected movement for minute 5th if the 5th wave has already finished would be a BAD thing.
So I think I’ll wait for more data. And even if moving up maybe just wait for Primary 4 to complete. (maybe) 🙂
scratch the minute — i meant Minor, ugh, its late!
Lara, looks like daily count will get invalidated quickly. im assuming this means wave 4 is continuing further as long as there’s no channel breach?
I would expect that the small fourth wave correction within the impulse for intermediate wave (C) up is over. The following fifth wave may also be over. It did move beyond the end of the third wave, there was no truncation, but it didn’t manage to move beyond the end of the fourth wave price territory.
If the upward sloping blue channel is breached then I will expect that the whole correction for primary wave 4 is over a bit earlier than expected.
Then I would calculate a target for primary wave 5 down to end.
Look out. It’s a fifth wave of a commodity. It is possible that it may be very swift and very strong.
Lara, I appreciate your oil analysis which has proven reliable over the last year. I would like to trade oil (swing trade-mediuum term) but probably need a weekly update. Any possibility you will create an EW Oil service or do a weekly oil update here on ElliottWaveGold?
Another question: I subscribe to both your gold and s&p service and also follow your oil analysis as it is available. Which (gold, oil, s&p) most closely adhere to EW analysis – is EW analysis more successful with gold, oil or s&p?
I can probably post charts at least once a week for US Oil.
EW analysis for Gold is currently taking me at least 3 hours each day. S&P 500 takes at least another 2 hours a day. My own analysis of NZDUSD must be done each day while I’m trading that one.
There is just not enough hours in the day to commit to any other market as paid analysis.
I will not be adding any further markets to the service offered. Analysis of any market apart from Gold and S&P 500 will always be free, and provided only when I have the time to do it.
Up until March this year I would have said that Gold is the market which most closely adheres to typical looking EW structures.
But this sideways chop for Gold has been an absolute nightmare to analyse. It is no longer showing perfect (or almost perfect) proportions within it’s waves.
I find the S&P normally hardest to analyse, but recently I’ve been getting that right more often than wrong. It’s been easier.
So the answer to your last questions is…. it changes.