
I have the same two Elliott wave counts for GDX. I still favour neither.
GDX does not appear to have sufficient volume for Elliott wave analysis of this market to be reliable. It exhibits truncations readily, and often its threes look like fives while its fives look like threes. I will let my Gold analysis lead GDX, and I will not let GDX determine my Gold analysis for this reason.
Bull Wave Count
Click chart to enlarge.
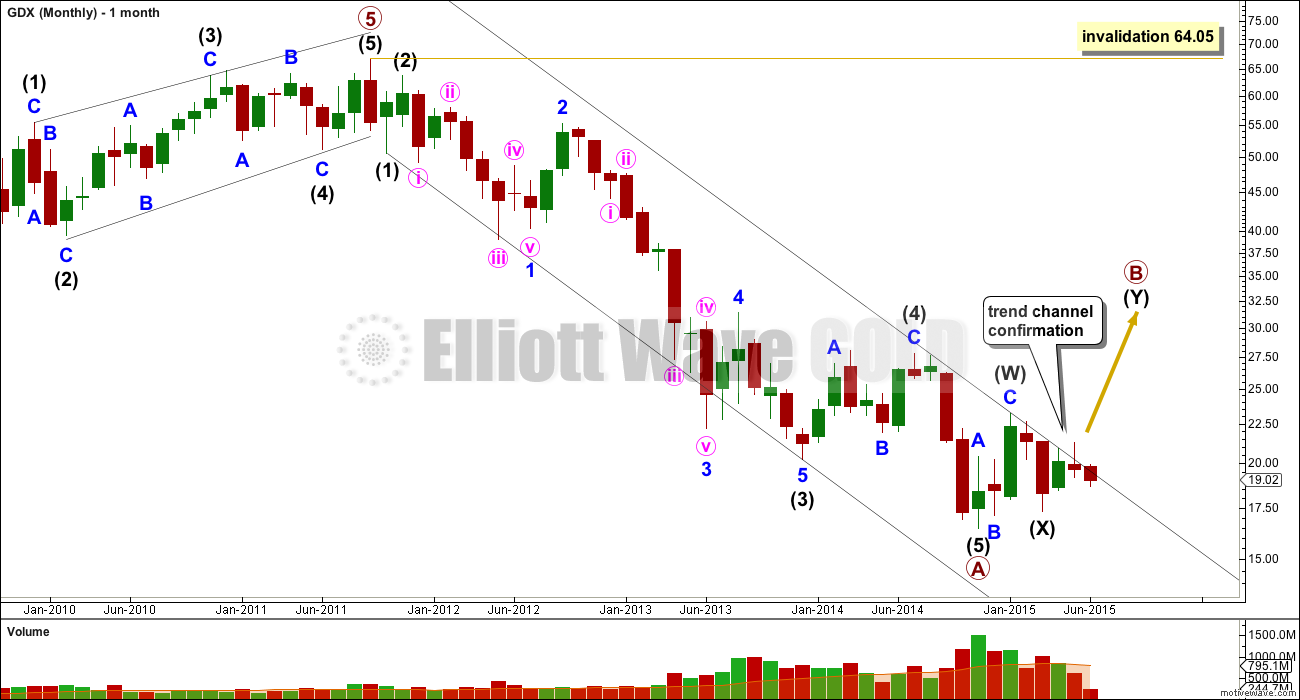
The bull wave count expects that a five wave impulse is complete for primary wave A down. Within it, the extended wave is intermediate wave (3). Intermediate wave (3) is 0.11 longer than 2.618 the length of intermediate wave (1), and there is no Fibonacci ratio between intermediate wave (5) and either of (1) or (3).
The channel drawn about primary wave A down is a best fit. The upper edge is still providing resistance. For the bear count (or any variation of it) to be discarded this trend line must be breached. That would provide trend channel confirmation that primary wave A is over and the next wave of primary wave B would then be underway.
Because primary wave A subdivides as a five, primary wave B may not move beyond its start above 64.05.
Primary wave B must subdivide as a corrective structure.
Click chart to enlarge.
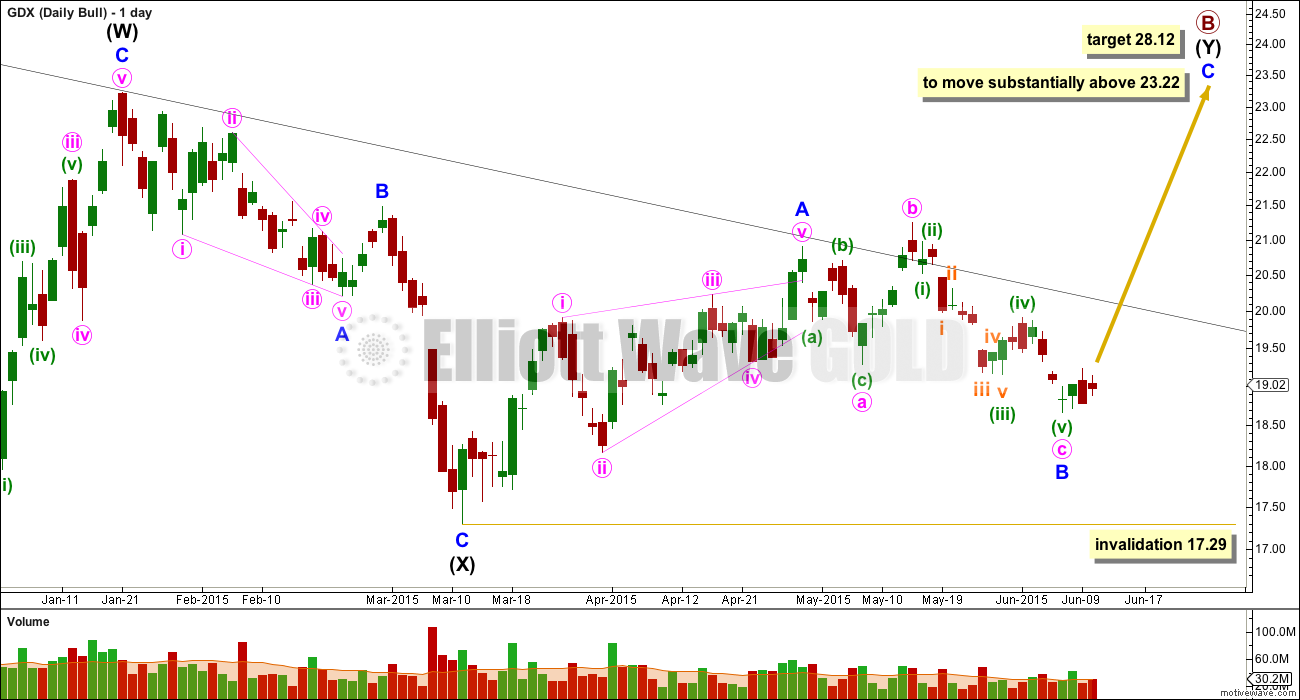
The wave down labelled intermediate wave (X) is 88% of the prior upwards wave of intermediate wave (W). A flat correction can be ruled out for primary wave B, at this stage, because this is less than 90%. Intermediate wave (W) subdivides well as a zigzag.
Primary wave B may be unfolding as a double zigzag. The first zigzag in the double labelled intermediate wave (W) is complete. The double is joined by a three in the opposite direction, a zigzag labelled intermediate wave (X) which is also now complete. The second zigzag in the double is underway labelled intermediate wave (Y).
The purpose of the second zigzag in a double (and the third in a rare triple) is to deepen the correction when the first (and second) zigzag does not move price deep enough. To achieve this purpose the second (and third) zigzag moves substantially beyond the end of the first (and second). Intermediate wave (Y) may be expected to move substantially above the end of intermediate wave (W) at 23.22.
Within intermediate wave (Y), minor wave A is a complete leading contracting diagonal. Minor wave B is now a complete expanded flat. Within it, minute wave c is 0.04 longer than 1.618 the length of minute wave a.
At 28.12 minor wave C would reach 2.618 the length of minor wave A. This would see intermediate wave (Y) achieve its purpose of deepening the correction for primary wave B.
Bear Wave Count
Click chart to enlarge.
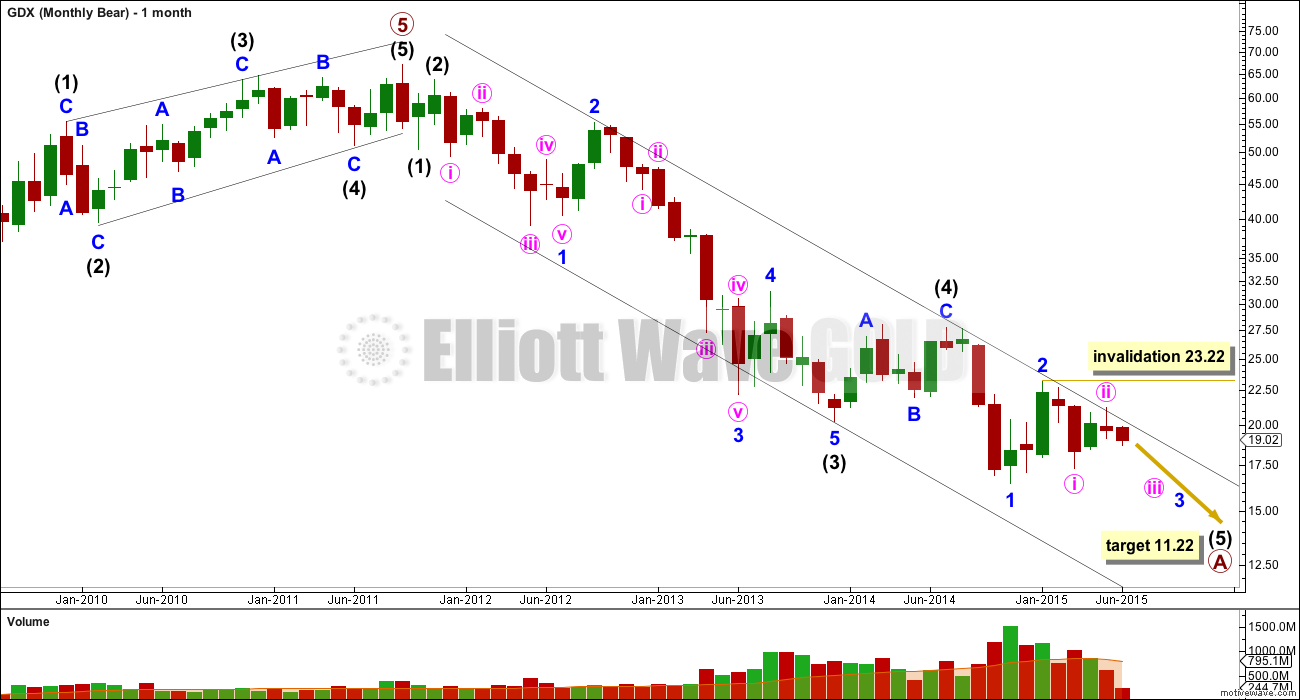
While price continues to find strong resistance at the upper black trend line of this channel, this bear wave count must be considered alongside the bull wave count for GDX.
Minute wave ii may not move beyond the start of minute wave i above 23.22.
At 11.22 intermediate wave (5) would reach equality in length with intermediate wave (1).
Click chart to enlarge.
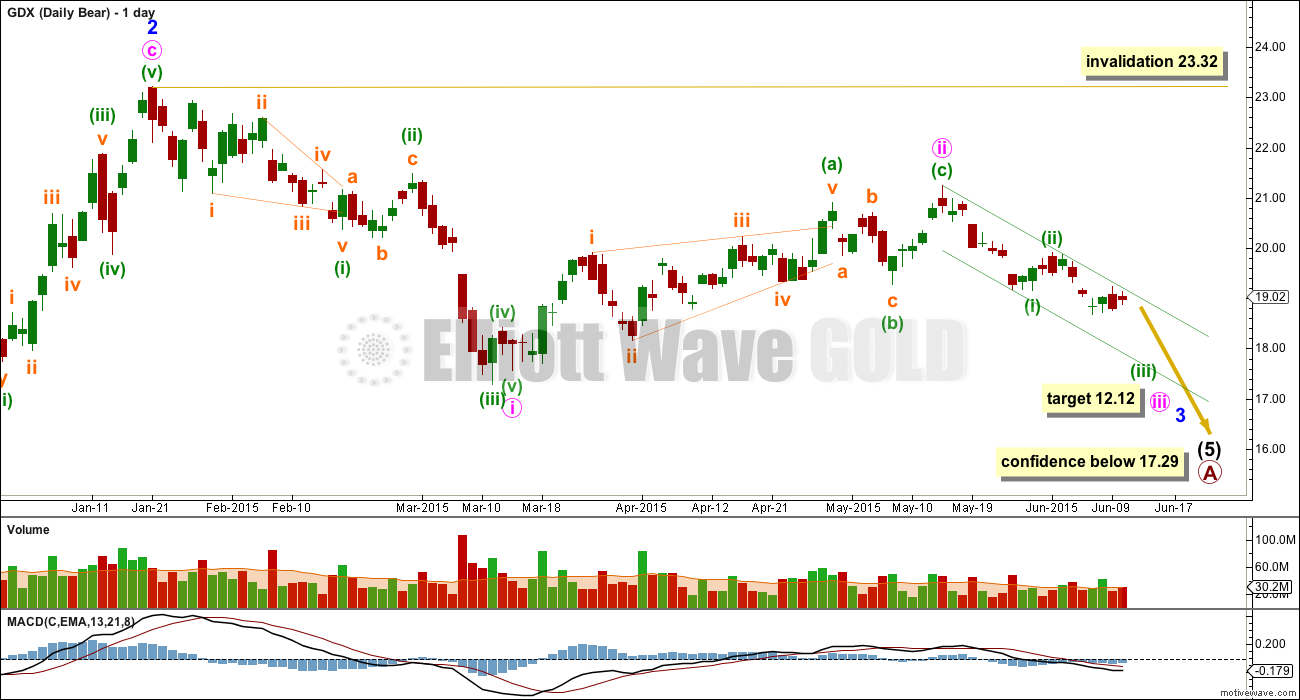
A new low below 17.29 would at this stage invalidate the bull wave count and provide confirmation for this bear wave count.
This bear wave count expects a third wave down to begin to gather momentum. At 12.12 minute wave iii would reach 1.618 the length of minute wave i.
Draw a base channel about minuette waves (i) and (ii). Along the way down, upwards corrections should find resistance at the upper trend line. A clear breach of the upper green line would reduce the probability of this bear wave count.
Technical Analysis
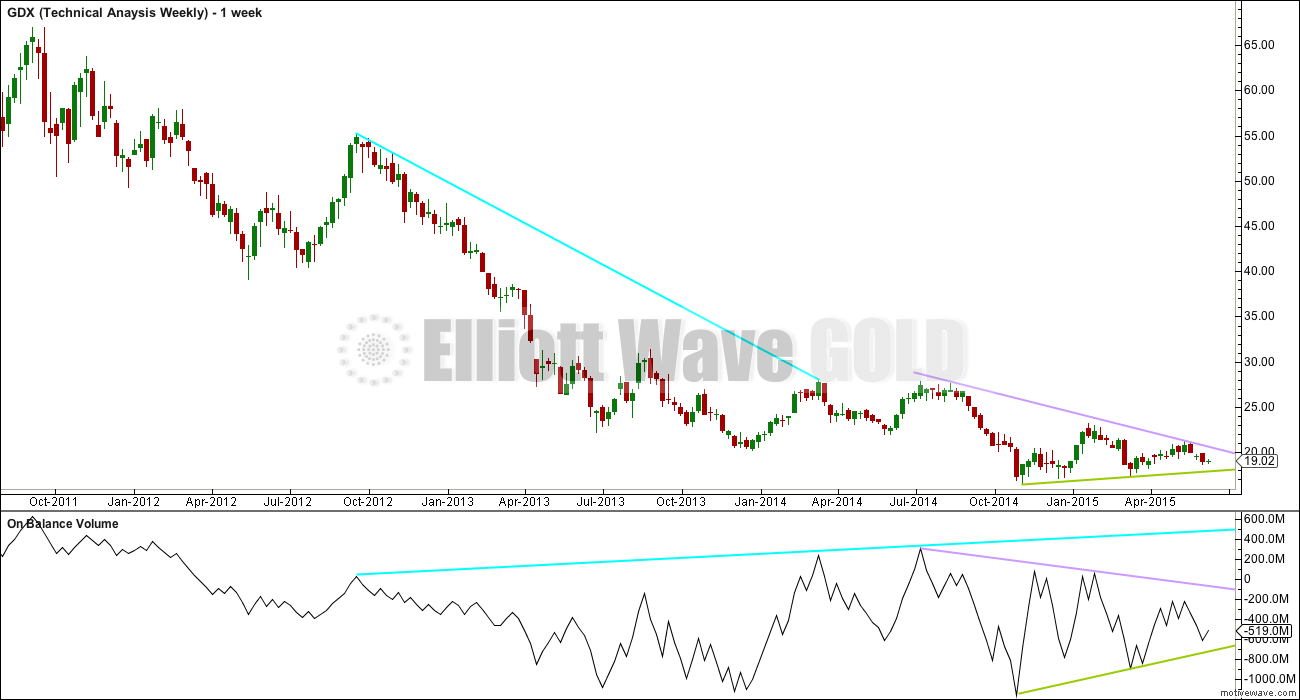
Click chart to enlarge.
Blue Lines: from the high at 55.25 to the high at 28.03 price moved lower while On Balance Volume moved higher. This negative divergence may indicate a larger fall to come.
Lilac Lines: More recently, as price has made lower highs, OBV has also made lower highs. There is no divergence, so the fall in price is supported by a fall in volume.
Green Lines: Recently price has also made higher lows. Again OBV agrees. There is no divergence.
The green and lilac trend lines on both price and OBV are converging suggesting a breakout is coming closer. With the strong divergence between price and OBV from September 2012 to July 2014 a downwards breakout may be slightly more likely.
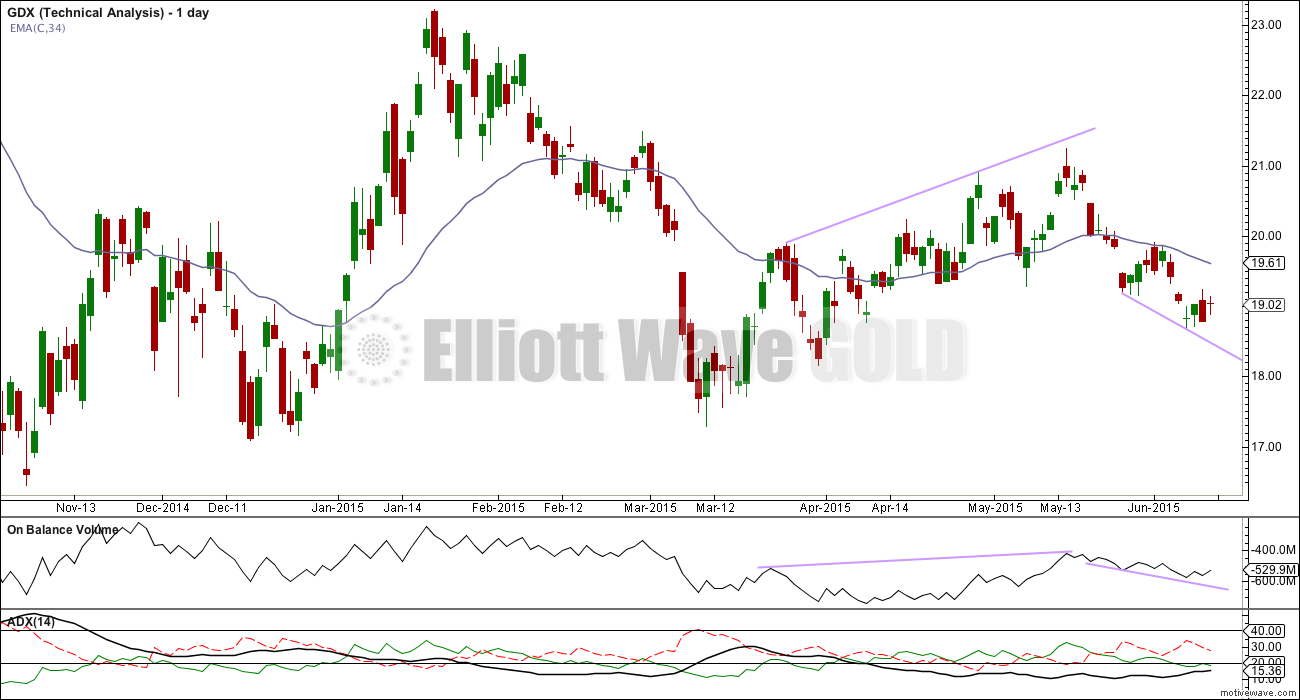
Click chart to enlarge.
ADX is just over 15 and rising. The -DX line (dashed red) is above the +DX line (green) indicating this may be the start of a new downwards trend. If ADX rises to 20 or above a downwards trend would be more clearly indicated.
As price falls OBV also falls. There is no divergence, so this fall in price is supported by OBV.
Price is below the 34 day EMA. The trend may be expected to be more likely down than up at this stage.
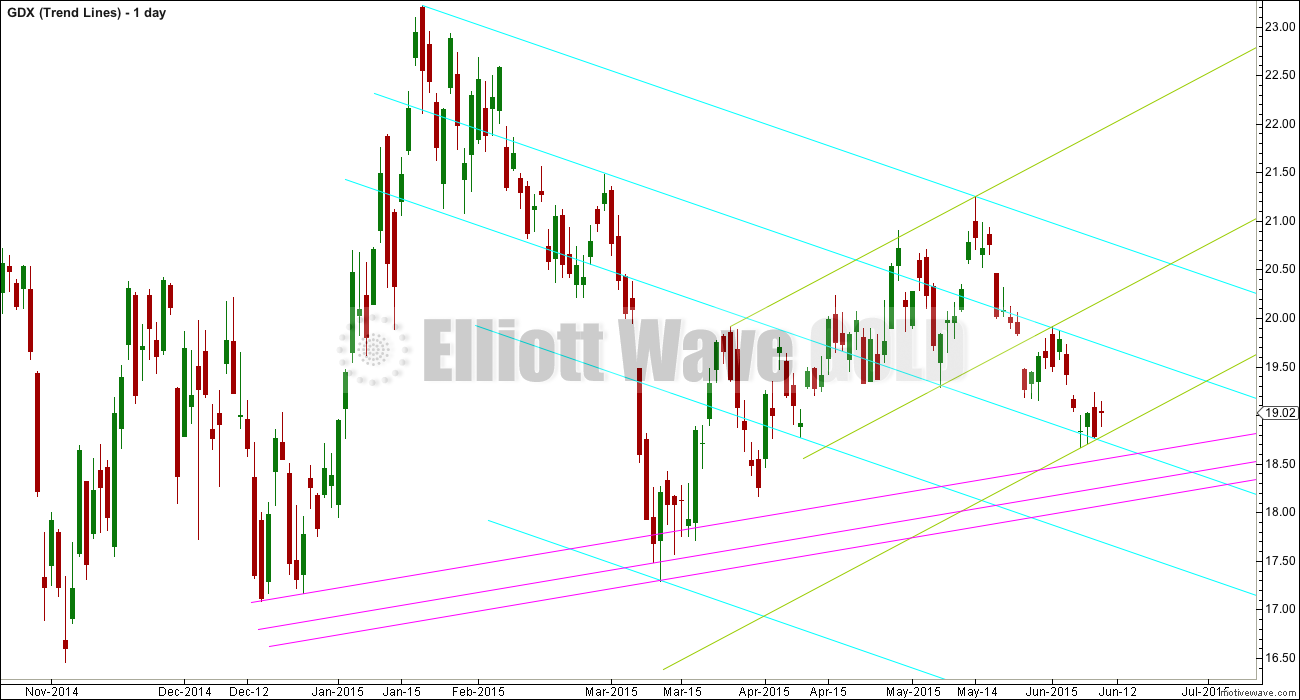
Click chart to enlarge.
This is my own particular method of trend line analysis.
Each series of parallel lines is coded with a different colour. I use this approach to suggest potential areas of support and resistance.
Lara, this is a good idea. Whenever EW analysis doesn´t give us clear clues, use TA as support and perhaps it will clarify the most likely direction of the market. For me, it´s clearly bearish.
Yes, there are a lot of very bearish indicators for both Gold and GDX. Overall the regular TA picture is more bearish than bullish. BUT a strong caveat on that: price is the ultimate determinator. And we don’t have price confirmation of a bear market. Price is most important of all.
Lara, wow! Thanks for all of the technical analysis. This seems to really help give directional clues until EW shows it’s hand.